Academic and Research Staff
Prof. W. L. Black Prof. W. F. Schreiber Dr. P. H. Liss Prof. M. Eden Prof. D. E. Troxel Dr. O. J. Tretiak Prof. T. S. Huang Dr. K. R. Ingham C. L. Fontaine Prof. F. F. Lee Dr. P. A. Kolers E. R. Jensen
Prof. S. J. Mason G. L. Wickelgren
Graduate Students
G. B. Anderson R. V. Harris III D. L. Peterson T. P. Barnwell III D. W. Hartman D. S. Prerau
A. K. Bhushan H. P. Hartmann G. M. Robbins
B. A. Blesser G. R. Kalan A. H. M. Ross
A. L. Citron R. W. Kinsley, Jr. C. L. Seitz
R. W. Cornew W. H. Lee D. Sheena
D. P. De Wan J. I. Makhoul R. M. Strong
H. D. Evans III L. C. Ng G. A. Walpert
A. Gabrielian J. A. Williams
A. ACQUIRED ASYMMETRY OF SHAPE LEARNING
Using geometrically transformed texts, we have been able to show that humans learn to decode them differentially.1 Mathematically equivalent transformations impose different burdens, both with respect to speed of decoding (as measured by the amount of time taken to read pages in a single geometrical transformation), and with respect to the rate of learning. The order of difficulty of the transformations shows that rota-tion in the plane of the page is easiest to master, while inversion on a horizontal axis and reflection about a vertical axis are far more difficult. Furthermore, there is a negative correlation between speed of initial learning and rate of acquisition of
skill - the easiest transformation shows the least improvement.
These results imply that learned sequences of visual scanning, in conjunction with learned preferences for shapes of differing orientation, powerfully affects the subjects' ability to decode the texts. To learn whether the asymmetrical preferences are specific characteristics of the nervous system or reflect special learning was the motivation for the following experiment.
The experiment was performed in Israel with native speakers of Hebrew who had virtually no familiarity with languages read from left to right. Their reading skill with Hebrew (and for some of them with Arabic, too) was at or near the level of college freshmen. For reasons that are irrelevant to this report, it was difficult to obtain
*This work was supported in part by the Joint Services Electronics Programs (U. S. Army, U. S. Navy, and U. S. Air Force) under Contract DA 38-43-AMC-02536(E), and in part by the National Science Foundation (Grant GK-835), the National Institutes of
Health (Grant 2 P01 MH-04737-06), and the National Aeronautics and Space Administra-tion (Grant NsG-496).
(XXII. COGNITIVE INFORMATION PROCESSING)
subjects, and the few whom we finally got could be tested only on a restricted set of
materials, because of various time commitments.
The array of 8 transformations that
we have used previously was therefore reduced to 6, and testing time itself reduced to
5 days.
Despite the small number of subjects, the results are quite clear.
The geometrical operations performed on the text were identical with those
previ-ously performed with English,
except for the 2 missing examples.
Hebrew, as all
Semitic languages, is read from right to left. A rotation in the plane of the page of
Hebrew, consequently, yields a geometry that is opposite, but symmetrical, to that of
English, and similarly with all other transformations that we have used.
That is,
identical geometrical transformations were performed on different bases (English and
Hebrew) which are left-right inversions of each other. On each of the 5 days, each of
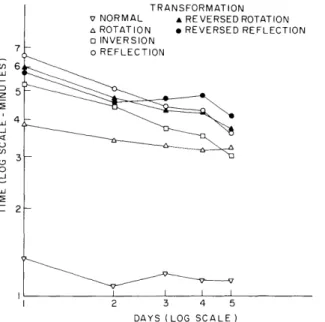
the 6 students read aloud one page of Hebrew text in each of the 6 transformations. The
results of the testing are shown in Fig. XXII-1, time being represented in minutes on
TRANSFORMATION v NORMAL A REVERSED ROTATION A ROTATION * REVERSED REFLECTION o INVERSION
7 to REFLECTION
-c
Fig. XXII-1.
Results of tests.
_J
2-I I I L
2 3 4 5
DAYS (LOG SCALE)
the ordinate, and successive pages (days) on the abscissa. Very little improvement
occurs in the reading of normally oriented Hebrew; rotation in the plane of the page is
the easiest of the transformations, followed by inversion and reflection.
In these
respects, the data are identical with those obtained from native readers of English for
the same transformations.
The results show clearly, therefore, that the relative
dif-ficulty with the transformations, which had previously been found with native readers of
English is not due to specific biases for orientation in the visual system. The difficulties
rather seem to be due to biases induced by a well-practiced scanning "program" upon
the ability to utilize other such "programs" (decoding strategies). If the biases were
specific to orientations, the results from the Hebrew readers would have shown
inver-sion to be far easier than reflection, in order for them to be consistent with those
obtained from English readers.
The fact that it is the relative orientation that orders
the difficulty with the transformations reveals clearly that the biases are acquired.
P. A. Kolers
References
1i.
P. A. Kolers, A. C. Boyer, and K. F. Rosenthal, "Protracted Practice on Decoding
Spatially Transformed Text," Quarterly Progress Report No. 78, Research
Labora-tory of Electronics, M. I. T.
,
July 15, 1965, pp. 229-231.
B.
TRANSMISSION AND CODING OF COLOR PICTURES
Efficient schemes for transmission and coding of color pictures have been
investi-gated by real-time processing of color television signals.1 Subjective effects of
ran-dom noise, PCM quantization noise, delta-modulation noise, and sampling and filtering
degradations in color signals were evaluated by direct viewing of kinescope displays.
2Such real-time displays are not only superior in quality to photographs obtained by
com-puter simulation process but also show frame-to-frame degradations, thereby making
evaluation more meaningful.
The blocks of a color picture transmission system are shown in Fig. XXII-2.
The
TRANSMITTER
OURC CAMERA MULTIPLEX CODER
QUANTIZATION
NOISE DIGITAL CHANNEL
CHANNEL NOISE
RECEIVER
EYE
BRAINAND
/
MAT1
EDISPLAY
DEMULTIPLEX
DECODER
Fig. XXII-Z.
Color picture transmission system.
source pictures (standard SMPTE and other color transparencies) are scanned by the
RCA TK-Z7 color camera to generate Red (R), Green (G), and Blue (B) signals of 2-MHz
bandwidth. These signals may be matrixed, if desired, and multiplexed suitably to give
a single analog signal. The analog signal is encoded into a digital stream and
trans-mitted. At the receiver, the digital signal is decoded back to its original analog form,
(XXII.
COGNITIVE INFORMATION PROCESSING)
original picture.
This picture is viewed by the human observer through his eye and
evaluated in his brain.
Time-division multiplexing may be more efficient and convenient if the signal is to
be transmitted digitally.
Thus sequential transmission of color television signals was
considered as an alternative approach to matrixing and subcarrier multiplexing.
For
this purpose, a time-division multiplexing unit was constructed for sampling and
multi-plexing the color signals at variable bit rates.
The two codecs (coder and decoder) that
were used primarily in the experiments were the 111 Mb/sec solid-state PCM facility
3of the High Speed PCM Terminal Department of Bell Telephone Laboratories, Inc., for
standard PCM, and the Ball Brothers Research Corporation Codec
4for the delta
mod-ulator.
The performance of the codecs and the multiplexing equipment was checked and
insured by appropriate noise-loading tests.
The noise performance of the multiplexer
was at least 10 dB better than a 9-bit PCM coder.
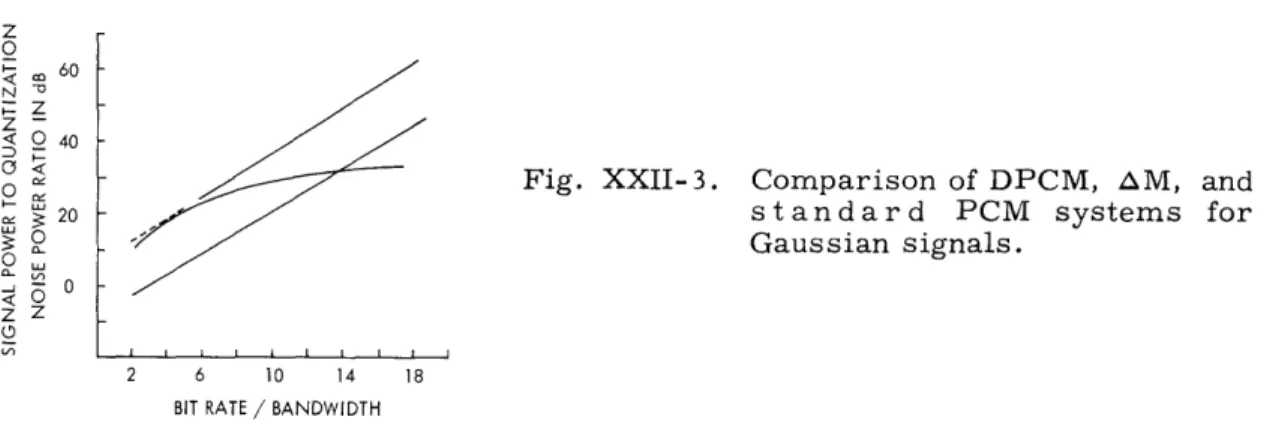
Figure XXII-3 compares the bound on signal-to-quantization-noise
ratio for
z
o
4 60
0
O 40
0
Fig. XXII-3.
Comparison of DPCM, AM, and
! 20 standard PCM
systems for
2 - Gaussian signals.
-- 0
ZZ (0
2 6 10 14 18
BIT RATE / BANDWIDTH
differential PCM (DPCM), delta modulation (AM), and standard PCM systems for
Gaus-sian signal inputs.
5This figure indicates how efficient the coding scheme is at the
desired signal-to-noise ratio (SNR), or alternatively the best SNR obtainable at the
desired bit rate.
The SNR given is the rms signal-to-rms noise ratio. To calculate
the peak-to-peak signal-to-rms-noise ratio, we have to add 18-20 dB, the amount
depending on the statistics of the television signal.
6Thus to obtain (SNR)pp of 54, 46,
38, and 29 dB by AM, we need bit rates of 16, 8, 4, and 2 times the bandwidth; for
standard PCM this figure is approximately 12, 10, 7, and 4 times the bandwidth,
respectively. Although for standard PCM, the SNR in dB increases linearly with bit
rate, for AM it increases only logarithmically.
Thus for higher SNR standard PCM
would be more efficient than AM, and for lower SNR, AM would be superior.
The
quality of a television picture cannot be judged, however, by its SNR alone. Though
these analytical results and physically measurable tests are often helpful in making
gross judgments, it is the perceptual significance of transmission distortion that is the
crucial factor in determining the merit of a transmission system. Only a subjective test can lead to a meaningful judgment in the final evaluation of picture quality.
Evaluation and subjective tests consisted of assigning a comment on the degradation perceived on a high-quality color monitor display. The comments were chosen from a comment scale ranging from 'not perceptible' to 'extremely objectionable,' as indicated in Figs. XXII-5, XXII-7 and XXII-8. The results were viewed by several trained observers in a dark studio with a viewing distance of 4 times the picture height (5 ft). The screen highlight brightness was kept at 25 ft L (85 cd/m2), and from ten to twelve slides with widely varying color, tones, content, and details were used for the tests. The arithmetic mean of comments from all observers and on all pictures was taken for the final results. The standard deviation in comments for observers was, on the aver-age, 0.5, while that for pictures was 1. 0. Thus for accurate evaluation of color picture-transmission schemes not only a large number of observers but also a large number of widely varying pictures should be used.
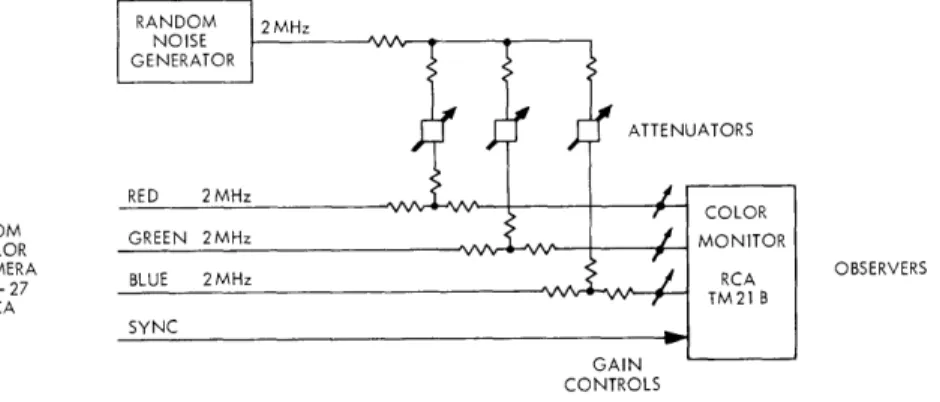
To study subjective effects of random noise in the three color channels, the experi-mental arrangement of Fig. XXII-4 was used. The SNR can be varied by the attenuators
RANDOM 2MHz NOISE GENERATOR ATTENUATORS RED 2MHz COLOCOLOR
FROM GREEN 2MHz / MONITOR
CAMERA BLUE 2 MHz OBSERVERS
TK - 27 BLUE 2MHz RCA
RCA
SYNC
GAIN CONTROLS
Fig. XXII-4. Experimental arrangement for evaluating the effects of random noise.
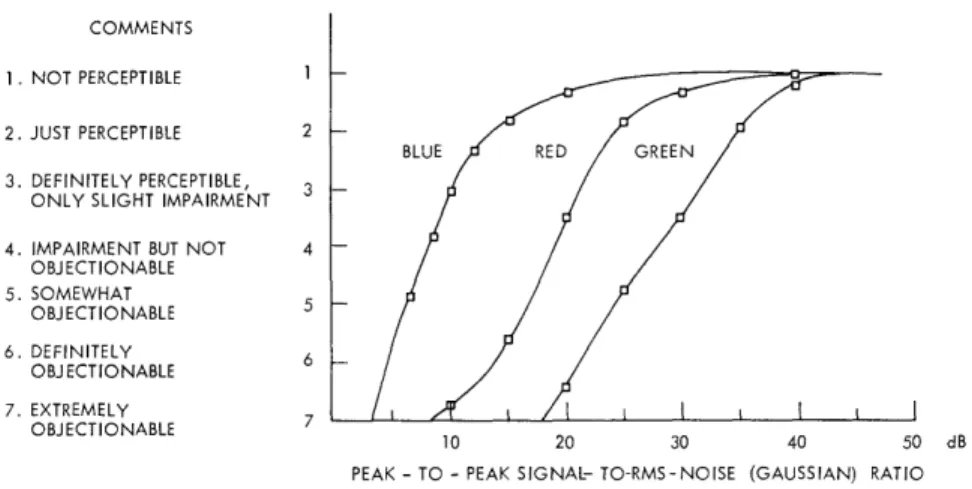
for each of the channels. Noise added in this form is perfectly correlated. To observe the effects of uncorrelated noise, delays of 20 and 40 iLsec (1/3 and 2/3 of line scanning time) were added to the noise path of two of the channels. For evaluating the subjective effects of degradation by random noise for the channels individually, the SNR in two of the channels were maintained at a level of 55 dB, while the SNR of the third channel varied. The results are shown graphically in Fig. XXII-5. There is an approximate 10-dB difference in the SNR required for the blue, red, and green signals for the same transmission objective (just perceptible, not objectionable, etc.). With noise present in all three channels together, correlated noise, which appears more as luminance
(XXII.
COGNITIVE INFORMATION PROCESSING)
COMMENTS
I . NOT PERCEPTIBLE
2. JUST PERCEPTIBLE
3. DEFINITELY PERCEPTIBLE, ONLY SLIGHT IMPAIRMENT
4. IMPAIRMENT BUT NOT OBJECTIONABLE 5. SOMEWHAT OBJECTIONABLE 6. DEFINITELY OBJECTIONABLE 7. EXTREMELY OBJECTIONABLE 10 20 30 40 50 dB
PEAK - TO - PEAK SIGNAL- TO-RMS-NOISE (GAUSSIAN) RATIO
Fig. XXII-5.
Subjective effects of random noise in color channels.
degradations, is slightly more degrading than uncorrelated noise, which appears more
as true degradations (see Table XXII-1).
Subjective effects of delta-modulation noise and PCM quantization noise in the three
color channels were evaluated by individually coding and decoding each of the color
Table XXII- 1.
Effects of correlated and uncorrelated random noise.Source
SNR (db)
Mean Comment
Green
Red
Blue
Correlated
35
25
15
3.5
Correlated
37
27
17
3.1
Correlated
40
30
20
2. 1
Uncorrelated
39
28
10
4. 1
Uncorrelated
36
25
14
4
Uncorrelated
40
30
18
2. 3
Uncorrelated
40
30
20
1.8
Uncorrelated
42
31
21
1.4
Uncorrelated
43
32
24
1
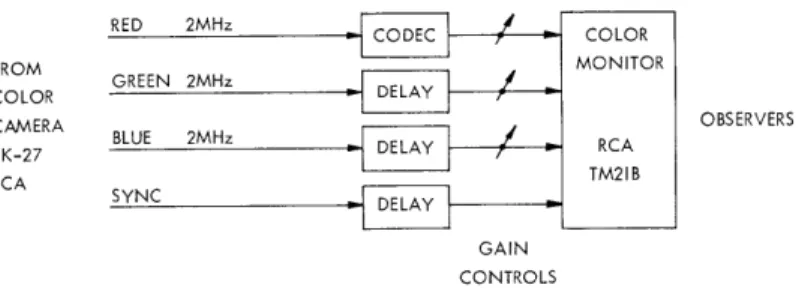
signals while directly transmitting the other two (unimpaired analog signals) (see
Fig. XXII-6).
The results for delta modulation are summarized in Fig. XXII-7.
The
bit rates for transmission by AM that are required for a given transmission objective
may be determined from Fig. XXII-7.
For a transmission objective of 4 (impairment
but not objectionable) the bit rates required by the green, red, and blue signals are 9,
8, and 4 mB/sec, respectively.
AM is slightly more degrading subjectively than
RED 2MHz
!
COLOR
FROM MONITOR
COLOR =
CAMERA OBSERVERS
CAMERA BLUE 2MHz RCA
TK-27 RCA
RCA STM21B
SYNC
GAIN CONTROLS
Fig. XXII-6.
Experimental arrangement for evaluating the
effects of modulation noise and quantization
noise.
COMMENTS
1. NOT PERCEPTIBLE 1
2. JUST PERCEPTIBLE 2
-3. DEFINITELY PERCEPTIBLE, 3 - BLUE RED GREEN
ONLY SLIGHT IMPAIRMENT 4. IMPAIRMENT BUT NOT
OBJECTIONABLE 4 5. SOMEWHAT OBJECTIONABLE 5 6. DEFINITELY 6 OBJECTIONABLE 7. EXTREMELY OBJECTIONABLE 2 2 4 4 6 6 8 8 110
DELTA MODULATION BIT RATE Mb/s
7 15 18 23 26 31 33
THEORETICAL S/N RATIO IN dB
Fig. XXII-7.
Subjective effects of AM noise in color channels.
random noise for the same SNR.
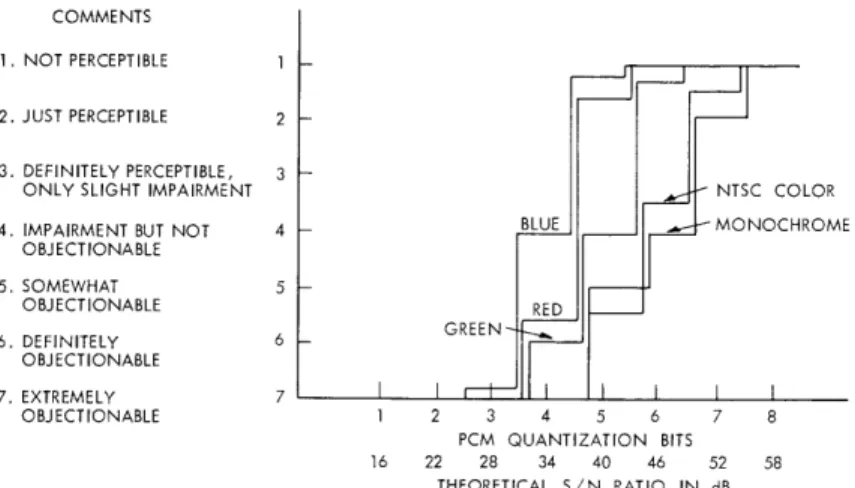
In transmission of signals by standard PCM much higher SNR are required, as PCM
quantization noise is subjectively most annoying.
The subjective effects of PCM
quan-tization noise are shown graphically in Fig. XXII-8.
For a comment of 4 the
quantiza-tion bits required for the green, red, and blue signals are 5, 5, and 4, respectively.
This corresponds to SNR of 40, 40, and 34 dB, which is much higher than the 32, 31,
and 23 dB required by delta modulation.
Not only is delta modulation more efficient in
terms of SNR but also at the low SNR involved delta modulation requires a lower bit
rate for transmission than standard PCM, as shown in Fig. XXII-3.
The crossover
point when standard PCM becomes more efficient than delta modulation for the same
SNR is at 50 dB peak-to-peak signal-to-rms noise ratio.
Three different kinds of filters were used for bandlimiting the color signals, and
the subjective effect on the composite picture was evaluated.
The filters were the
Thomson and the overshoot filters which were identified by their 20-dB down point, and
COMMENTS
1. NOT PERCEPTIBLE
2. JUST PERCEPTIBLE
3. DEFINITELY PERCEPTIBLE, ONLY SLIGHT IMPAIRMENT 4. IMPAIRMENT BUT NOT
OBJECTIONABLE 5. SOMEWHAT OBJECTIONABLE 6. DEFINITELY OBJECTIONABLE 7. EXTREMELY OBJECTIONABLE BLUE NTSC COLOR MONOCHROME 1 2 3 4 5 6 7 8 PCM QUANTIZATION BITS 16 22 28 34 40 46 52 58 THEORETICAL S/N RATIO IN dB
Subjective effects of PCM quantization noise
in color signals.
0 I Mc/s 2 Mc/s SHARP (3 STAGE) SC THOMSON 20 ----700 kc OVERSHEET .- - -- -1 Mc/s BROAD (1 STAC ©40 V) 1st INFINITY 60 .05 0.1 0.2 0.5 1.0 2.0 5.0 10 20 FREQUENCY IN MEGACYCLESFig. XXII-9. Filter characteristics.
Table XXII-2.
Lowpass filtering of color signals.
Mean
Blue
Red
Green
Comment
Thomson
0. 7 MHz
Thomson 1. 5 MHz
Original 2 MHz
4
Thomson
1
Thomson 1. 5
Original 2
2
Thomson
1
Thomson 1
Original 2
2. 5
Thomson
1
Broad
1
Original 2
2
Overshoot 0.7
Broad
1
Original 2
2. 5
Overshoot 0.7
Overshoot 1. 5
Original 2
4. 5
the broad filter, which was identified by its design frequency, fc. The filter charac-teristics are shown in Fig. XXII-9. The overshoot filter acts as a crispener, by
over-emphasizing the steepness of transition at edges. It achieves edge enhancement by addition of the inverted second derivative (or approximate) of the image signal to the image signal.7 The overshoot filter also produces a ring, because of its sharp cutoff characteristics. The comments obtained about the composite picture when the indicated filters were used are shown in Table XXII-2. The ringing caused by the overshoot fil-ter is not perceptible in the blues, but is objectionable in the reds and results in a false chroma edge.
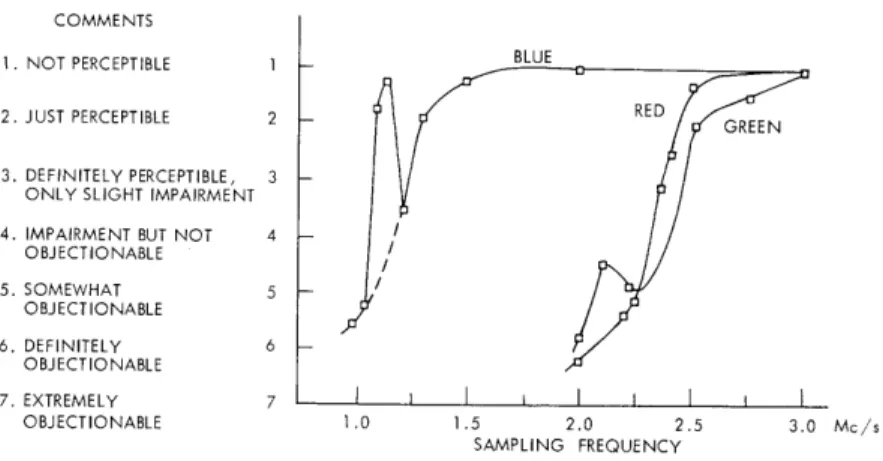
To determine the subjective effects of degradations introduced during sampling, the color signals were sampled at variable rates by the time-division multiplexing unit built for this purpose. Fig. XXII-10 shows the results of sampling the individual color channels at different sampling rates. In these experiments only one signal was sampled and the other two transmitted directly. The filter losses at the sampling rate and half the sampling rate were computed and the results are shown in Table XXII-3. The efficiency of transmission by standard PCM can be improved by judicious choice of sampling frequency. The idle bands generated in the spectrum of a television signal, because of the scanning process, can be shared by frequency-interleaving8 it with the image band around the sampling frequency, thereby minimizing foldover dis-tortion. When such is the case, we no longer need to sample at the Nyquist rate of twice the bandwidth, but at a much lower rate. Thus an 800-kHz blue signal can be sampled at a frequency of 1. 15 MHz (see Fig. XXII-10) with almost no perceptible deg-radations. The filter losses required for the blue, red, and green signals are indicated to be approximately 4, 7, and 12 dB at half the sampling frequency, and 16, 36, and 44 dB at the sampling frequency. For monochrome signals comparable results are 16-19 dB .at half the sampling rate, and 38 dB at the sampling rate.9 A comparison of bit rates required for sequential transmission of color signals by delta modulation and standard PCM is shown in Table XXII-4 for different transmission objectives.
For the NTSC signal transmitted by standard PCM (quantized to 6 bits and sampled at 9 MHz) the bit rate required is 54 Mb/sec. This represents a transmission objec-tive of 3-4. Taking into account the fact the combined degradation in the picture from all three signals will make it subjectively worse (this effect is approximately one step on the comment scale), we need approximately 26 Mb/sec for transmission by delta modulation and 33 Mb/sec for transmission by standard PCM for the same transmis-sion objective in a sequential transmistransmis-sion system. The picture in the last case will not be as sharp, however, because the green signal transmitted is of 2-MHz quality. For a sharper picture a bit rate only slightly higher would be required. Thus for dig-ital transmission of color signals, time-division multiplexing would be more efficient than frequency-division multiplexing by a considerable amount. The bit rate required
COMMENTS
I. NOT PERCEPTIBLE
2. JUST PERCEPTIBLE
3. DEFINITELY PERCEPTIBLE, ONLY SLIGHT IMPAIRMENT 4. IMPAIRMENT BUT NOT
OBJECTIONABLE 5. SOMEWHAT OBJECTIONABLE 6. DEFINITELY OBJECTIONABLE 7. EXTREMELY OBJECTIONABLE BLUE I I I I I I I I I 1.0 1.5 2.0 2.5 SAMPLING FREQUENCY
Fig. XXII-10.
Subjective effects of sampling degradations
in color channels.
Table XXII-3.
Sampling of signals and filter insertion losses.
Combined Filter
Output Filter
Sampling
Loss at Half
Loss at
Mean
Signal
Rate (Mc/sec)
Sampling Rate
Sampling Rate
Comment
Blue Red Green1.
1.
2.
2.
2.
2.
4 172. 0
2. 20
2. 25 2.35 2.40 2. 50 3.0 2. 0 2.10 2. 25 2.5 2.75 3.0 7 8.5 10 10.5 11 1216
26 7 8 9 9. 5 10 11 16 7 7. 5 9 11 12 16 5. 8 4.5 4.8 2 1.5 1 3.0 Mc/s-Bit Rates Required (Mb/sec)
Trans-mission
Objective Delta Modulation Standard PCM
Total Green Red Blue Total
Bit Bit
Green Red Blue Rate S. R. Q. B. B.R. S. R. Q. B. B.R. S. R. Q. B. B.R. Rate
1-2 16 10 6 32 3 6 18 2.5 5 12.5 1.5 5 7.5 38 2-3 12 8.5 5 25. 5 2. 5 6 15 2.35 5 11.75 1.25 5 6. 25 33 3-4 9 8 4 21 2.4 6 14.4 2. 30 5 11.50 1.Z 5 6 31.9 4-5 8 7 3 18 2.3 5 11.5 Z. 25 5 11. Z5 1. 1 4 4.4 Z7. 2 5-6 7 6 2. 5 15.5 2. Z25 5 11. Z25 2. 0 4 8 1 4 4 23.3 S.R. - Sampling rate in MHz Q.B. - Quantization bits B.R. - Bit rate in Mb/sec
(XXII. COGNITIVE INFORMATION PROCESSING)
for transmission of the NTSC signal by delta modulation was not determined, but it is suspected to be much higher, as the NTSC signal is very sensitive to the phase and amplitude errors that delta modulation will introduce.
A great amount of frame-to-frame redundancy exists in the color television signal, and this can be exploited by using delays that can store entire frames. The highlight brightness for the blue and red signals is much lower, and this considerably reduces the critical flicker frequency. This fact can be exploited by transmitting fewer frames per second for these signals. Also, the vertical resolution in the color pictures is greater than necessary. It is more difficult to resolve the line structure in the Blue and Red components of the picture, than for the luminance component. Low-cost line delays may be used to further exploit the redundancy in vertical resolution. Such tech-niques seem to be very promising, and further investigation is called for.
The transmission of a low-resolution monochrome signal by several kinds of dif-ferential PCM schemes was also studied. We found that for the same bit rate a 3-bit DPCM system produces a picture that is less noisy than either AM or 2-bit DPCM pictures, but subjectively the AM picture is preferred, because of the sharpness
resulting from the permitted higher sampling rate. For a higher quality of transmis-sion, the 3-bit DPCM system would be more efficient, as indicated by Fig. XXII-3.
A. K. Bhushan References
1. This work was done at Centre 321, Bell Telephone Laboratories, Inc., Holmdel, New Jersey, and was submitted as a thesis in partial fulfillment of the require-ments for the degree of Master of Science, Department of Electrical Engineering, M. I. T., June 1967, with the title, "Efficient Transmission and Coding of Color Pictures."
2. A. K. Bhushan, "Efficient Transmission and Coding of Color Pictures, " S.M. Thesis, M.I.T., June 1967.
3. J. O. Edson and H. H. Henning, "Broadband Codecs for an Experimental 224 Mb/s PCM Terminal," Bell System Tech. J. 44, 1887-1940 (1965).
4. Ball Brothers Research Corporation, Boulder, Colorado, "Technical Manual for BBRC Variable Bit Rate A/D-D/A Converter," n. d.
5. J. B. O'Neal, Jr., "A Bound on Signal to Quantizing Noise Ratio for Digital Encoding Systems," Proc. IEEE 55, p. 862 (1967).
6. J. B. O'Neal, Jr., "Quantizing Noise in Delta Modulation for Gaussian and Tele-vision Signals," Bell System Tech. J. 45, 117-142 (1966).
7. E. F. Brown, "A New Crispener Circuit for Television Images," SMPTE J. 72, 849 (November 1963).
8. P. Mertz and F. Gray, "A Theory of Scanning and Its Relation to the Characteristics of the Transmitted Signal in Telephotography and Television," Bell System Tech. J. 34, 464 (July 1934).
9. F. W. Mounts, "An Experimental Digital System for Evaluating Bandwidth Reduc-tion Techmiques," Bell System Tech. J. 47, 181 (January 1967).
C. SUBJECTIVE EFFECT OF ADDITIVE WHITE PICTORIAL NOISE WITH VARIOUS PROBABILITY DISTRIBUTIONS
The purpose of this study was to find out how strongly the objectionability of picto-rial noise depends on its probability distribution.
The noisy pictures were generated on a digital computer. A picture with a camera-man as a central object was used as the original, to which noise with various proba-bility distributions was added.
For the simulation on the computer the picture was divided into 256 X 256 points, and the intensity at these points quantized to 210 = 1024 levels. The noise was generated by using the random-number generator subroutine of the computer in conjunction with
suitable transformations. To the picture samples were then added the noise samples, thus producing the output noisy picture. The noise samples were independent of each other and of the original picture samples.
The signal-to-noise ratio, S/N, is defined as
SZ S
S max max
- = 10 log1 0 = 20 log 0
N 10 Z 0
where
S
max
= peak signal amplitude = 10232
2 = variance of the noise.
Table XXII-5 shows the signal-to-noise ratios that were used and the corresponding values of
a-
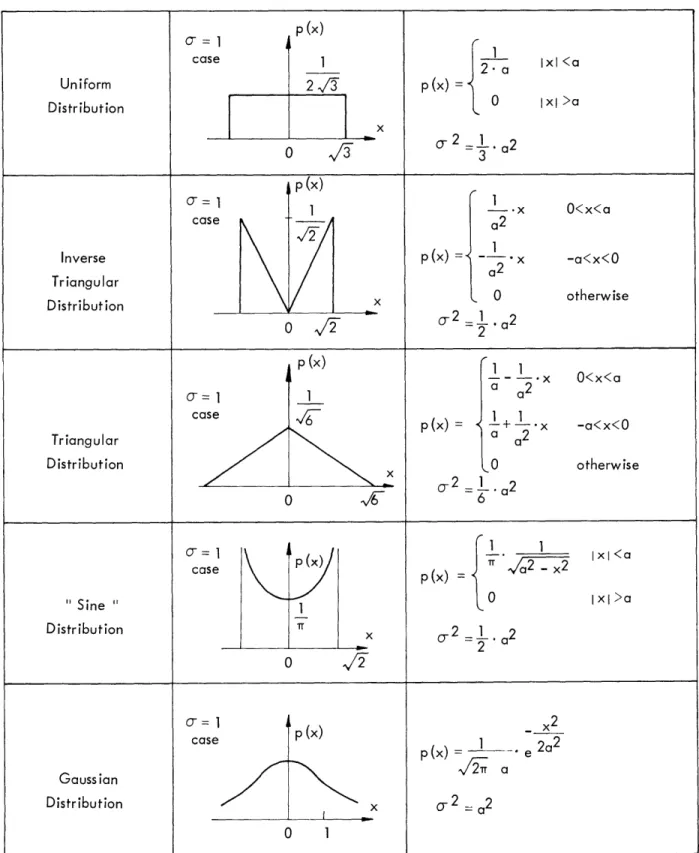
and a.Table XXII-6 shows the probability distributions that were used, together with their variances.
Table XXII-5. Signal-to-noise ratios.
S/N
2
(db)
26
51.2
2620
22 81.3 6610 20 102. 3 10485 18 129 16650 14 204 41620Table XXII-6.
Probability distributions.
p
(x)
1
case Ixl <a
Uniform
2
~/
p (x) =
o
Ixl>a
Distribution
>a
x
-
-
21
a2
p (x)
-= 1
S1-
1
x
O<x<a
case
a2
Inverse
p (x)
x
-a<x<O
a
2 TriangularDistribution
x
otherwise
0/
T2 a2 p(x)
1
1
x 0<x<aa
a2
case
v
p(x
W
.x
-a<x<O
Triangular
a a2
Distribution0
Sx
0-2
a2t
otherwise
o1
0
6
o-= 1
\
/
xi<a
case p(x) p(x) = r ,a 2 - x2"
Sine
"1
0
lxl>a
Distribution T x 2 . 22
7= 1
c-
p (x) -x 2case
1
e2a2
Gaussian
Distribution
x
o- 2
a2
0
1
Table XXII-7 shows the values of a (see Table XXII-6) for the various probability
distributions and the different signal-to-noise ratios.
The fourth moments were also computed; their values
are shown in Table XXII-8.Table XXII-7. Values of a.
S/N
26
22
20
18
14
Distribution Uniform 88.8 141.0 177. 8 223.9 354.0 Inverse triangular 72. 4 115. 0 144.9 182. 4 288. 8 Triangular 125. 4 199 Z51 316 500 "Sine" 72. 4 115. 0 144.9 182. 4 288.8 Gaussian 51. Z2 81.3 102. 3 129 204Table XXII-8. Values of x4 . (These values have to be multiplied by 106.)
S/N
26
22
20
18
14
Distribution Uniform 12.37 78.8 198.0 500.0 3120 Inverse triangular 9. 13 58. 1 146.3 368 2310 Triangular 1.83 11.7 29.3 74.0 462 "Sine" 10.3 65.5 165 416 2600Gaussian
20.6
131
330
832
5200
By inspection of the noisy pictures, we found that the difference between the objec-tionabilities of noises having the same variance but different probability distributions was hardly noticeable, although the fourth moments of the noises were quite different. It seems therefore, that for pictures with additive white noise, the signal-to-noise ratio can be used as a good measure of picture quality for a wide class of noise proba-bility distributions, including at least the five that we studied.
(XXII.
COGNITIVE INFORMATION PROCESSING)
D. STOCHASTIC MODEL FOR WEATHER MAPS
An investigation was undertaken1 to see if a two-state Markov source2 was an ade-quate model for weather maps in the following sense. Segments of weather maps were quantized into an n X n array of 1's and O's. The array was then scanned in line-by-line fashion. The one-dimensional sequence of zeros and ones thus generated was modeled as a stochastic source, for which line-to-line dependencies in the original picture were ignored.
The two-state Markov model implies that the run lengths are independent and geo-metrically distributed. Three statistical tests were performed to test the hypotheses that the one runs were independent, the zero runs were independent, and the one runs were independent of the zero runs. The results of the last two tests were consistent with the hypothesis of independence at approximately the .05 level of significance. The first hypothesis was rejected, however, at the same significance level. The test of the
one runs was repeated, only those one runs being counted were preceded by a one run of length 3 or larger. This was motivated by the fact that the pictures present regions of high detail and other regions of low detail. If a different run-length density were used within each region, the resulting model might be more accurate. This test (at the
. 05 level) was consistent with the hypothesis of independence. The experimental
prob-ability transition functions were calculated and compared with the geometric run-length probabilities of the two-state Markov model. The Chi-Square test of significance was used in this comparison. The tests indicated a significant deviation; however, graphs of the data revealed that the geometric approximation was apparently quite good.
Sequences of run lengths from the pictures were coded by using Huffman coding. The probability of overflow and the expected amount of overflow were determined from the data. We chose to encode T = 1800 cells at a time. If a maximum of RT = .575 X
1800 bits were used in encoding the original 1800 cells, the expected overflow would be 7 bits. The entropy of the pictures as calculated from the model was . 455 bits. A bound to the probability of overflow was derived which is exponentially decreasing in T, the number of cells encoded for a given rate R (=number of bits allowed in encoding T cells/T). From this, a bound to the expected over-flow was calculated. Both of these bounds were quite loose when compared with the actual data for T = 1800.
J. W. Woods References
1. J. Woods, "Run-Length Coding of Weather Maps," S.M. Thesis, Department of Electrical Engineering, M. I. T., June 1967.
2. J. Capon, "A Probabilistic Model for Run-Length Coding of Pictures," IRE Trans., Vol. IT-5, No. 4, No. 4, pp. 157-163, December 1959.