HAL Id: hal-03014992
https://hal.archives-ouvertes.fr/hal-03014992v2
Preprint submitted on 14 Dec 2020
HAL is a multi-disciplinary open access
archive for the deposit and dissemination of sci-entific research documents, whether they are pub-lished or not. The documents may come from teaching and research institutions in France or abroad, or from public or private research centers.
L’archive ouverte pluridisciplinaire HAL, est destinée au dépôt et à la diffusion de documents scientifiques de niveau recherche, publiés ou non, émanant des établissements d’enseignement et de recherche français ou étrangers, des laboratoires publics ou privés.
Yseult Héjja-Brichard, Samy Rima, Emilie Rapha, Jean-Baptiste Durand,
Benoit Cottereau
To cite this version:
Yseult Héjja-Brichard, Samy Rima, Emilie Rapha, Jean-Baptiste Durand, Benoit Cottereau. Stereo-motion Processing in the Nonhuman Primate Brain. 2020. �hal-03014992v2�
Stereomotion processing in the
non-human primate brain
Yseult HÉJJA-BRICHARD1,2, Samy RIMA1,2, Emilie RAPHA1,2, Jean-Baptiste DURAND1,2, Benoit R. COTTEREAU1,2
1
Centre de Recherche Cerveau et Cognition, Université de Toulouse, 31052 Toulouse, France.
2
Centre National de la Recherche Scientifique, 31055, Toulouse, France.
Abbreviated title: Stereomotion processing in the macaque brain
Corresponding authors: Yseult Héjja-Brichard ([email protected]) & Benoit R Cottereau ([email protected])
Number of pages: 42 Number of figures: 8 Number of tables: 1
Number of words: Abstract (181), Introduction (467), Discussion (1,947) Conflict of interest: None
Acknowledgments: This work was supported by the Agence Nationale de la Recherche Jeunes Chercheuses et Jeunes Chercheurs (Grants ANR-16-CE37-0002-01, 3D3M) and an ATP funding from the Paul Sabatier University awarded to B.R.C. We thank the Inserm/UPS UMR1214 Technical Platform for the MRI acquisitions.
Abstract
(200 words max.)The cortical areas that process disparity-defined motion-in-depth (i.e. cyclopean
stereomotion) were characterised with functional magnetic resonance imaging in two
awake, behaving macaques. The experimental protocol was similar to previous
patterns that continuously changed their binocular disparity over time with those to a
control condition that shared the same properties, except that the temporal frames
were shuffled. A whole-brain voxel-wise analysis revealed that in all four cortical
hemispheres, three areas showed consistent sensitivity to cyclopean stereomotion.
Two of them were localised respectively in the lower bank of the superior temporal sulcus (CSMSTS) and on the neighbouring infero-temporal gyrus (CSMITG). The third
area was situated in the posterior parietal cortex (CSMPPC). Additional ROIs-based
analyses within retinotopic areas defined in both animals indicated weaker but
significant responses to cyclopean stereomotion within the MT cluster (most notably
in areas MSTv and FST). Altogether, our results are in agreement with previous
findings in both human and macaque and suggest that the cortical networks that
process cyclopean stereomotion is relatively well preserved between the two primate
species.
Introduction
Motion perception is a fundamental property of the visual system in most animal
species. It enables to track over time the position of elements in a scene and thereby
facilitates navigation or interactions with moving objects. Historically, numerous
studies have characterised planar (i.e. 2D) motion processing in the primate nervous
system (see e.g. Maunsell and Newsome, 1987). In macaque, single-cell recordings
showed that it is computed at the cortical level within an extended network that
begins in the primary visual cortex and includes higher-level visual areas such as
area V4 in the ventral patway (Li et al., 2013) and area V3A (Galetti et al., 1990) or
V6 (Pitzalis et am., 2013) in the dorsal pathway. Within the Superior Temporal Sulcus
motion direction (see e.g. Maunsell & Newsome, 1987) and also reflects motion
perception (Newsome & Paré, 1988; Britten et al., 1996). In human, neuroimaging
studies suggested that 2D motion is also processed within an extended network that
includes a putative homologue of area MT: hMT (Huk et al., 2002). Over the last 20
years, the emergence of monkey fMRI (see e.g. Vanduffel et al., 2001) made
possible the further characterisation of the correspondence between the cortical
areas involved in motion processing in the two species. This comparative approach
revealed that 2D motion engaged largely similar networks in macaques and in
humans. It notably suggested that motion processing in MT and its satellite areas
(V4t, FST, and MSTv) on the one hand and in hMT and its satellites (pV4t, pFST,
and pMSTv) on the other hand could be homologous (Kolster et al., 2009; 2010). Yet,
functional differences between both species have also been documented, since
sensitivity to motion in area V3A and other regions within the intraparietal sulcus
(IPS) was found to be more pronounced in human than in macaque (see Orban et
al., 2003 for a review). For instance, cortical areas responsive to motion-defined
structures are encountered in the human IPS but not in its monkey counterpart
(Vanduffel et al., 2002).
Rather surprisingly, much less is known about the neural mechanisms that process
motion along the depth dimension in primates. Motion in depth is nonetheless a very
common and important component of motion in everyday life as it can notably signal
objects moving towards the head and/or the body. Its estimation derives from two
binocular cues: The change of disparity over time (CDOT), which tracks dynamic
increase or decrease in horizontal disparity, and the interocular velocity difference
(IOVD), based on opponent motion vectors between the two eyes (Nefs et al., 2010).
The characterisation of the cortical areas processing each of these cues in both
objects is integrated in the primate brain and to further establish the similarities but
also the differences between motion processing in the two species. Over the last ten
years, this important line of research inspired a growing number of studies based on
neuroimaging measurements in human and single-cell recordings in macaque.
In human, a pioneer fMRI study (Likova and Tyler, 2007) found that the strongest
responses to CDOT arise in a cortical region anterior to the hMT+ complex. This
region had reduced responses to 2D motion and was labelled ‘CSM’, for Cyclopean
StereoMotion, by the authors. It might therefore be specialised in processing
motion-in-depth. From additional analyses within independently defined regions of interest
(ROIs), this study also found that several visual areas, such as V3A, V4, and hMT+,
were more responsive to CDOT than to static disparity planes. Two years later,
Rokers et al., (2009) found specific responses to CDOT and IOVD in the hMT+
complex, but also in area V3A and in lateral occipital regions (LO1/LO2). However,
this study did not investigate activations in regions anterior to the hMT+ complex.
More recently, Kaestner et al. (2019) confirmed that the hMT+ complex and two
groups of ROIs that respectively gathered dorsal (V3A/B and IPS-0) and ventral (V4,
LO-1 and LO-2) areas were more responsive to CDOT than to a control condition
where the temporal frames were scrambled. These authors also found significant
responses to CDOT in the CSM area but that were not as pronounced as those
measured in hMT+. Altogether, these three human studies found consistent patterns
of cortical responses to CDOT even though the precise functional role of area CSM,
and notably how its responses to both 2D and 3D motion differ from those measured
in hMT+, remains to be better understood.
In macaque, explorations of motion in depth selectivity at the single-cell level began
with electrophysiological recordings in area MT, notably on the grounds that this
studies found that MT neurons were selective to motion in depth (Czuba et al., 2014;
Sanada et DeAngelis, 2014) but that this selectivity was primarily driven by the
IOVD cue, with only a small contribution from the CDOT cue (Sanada & DeAngelis,
2014). Based on the human findings, it is possible that stronger responses to CDOT
could be found in other satellite regions of the MT cluster (e.g. in FST or MSTv)
and/or in more anterior regions of the STS. It is also possible that significant
responses to CDOT exist in other regions of the ventral and dorsal visual pathways.
In order to clarify which regions of the macaque cortex should be explored to better
understand the neural mechanisms underlying motion-in-depth processing in
primate, it is essential to first determine whether the areas that were identified in
human from neuroimaging measurements could have putative homologues in
macaques by using a similar approach.
In the present study, we performed fMRI recordings in awake behaving macaques to
identify the cortical regions sensitive to motion-in-depth defined by changing
disparity over time (CDOT). To facilitate the comparison with previous human data,
we used an experimental protocol that was directly inspired from the neuroimaging
studies described above (Likova and Tyler; 2007; Rokers et al., 2009; Kaestner et
al., 2019). In order to precisely determine the limits of the MT cluster, we ran an
additional retinotopic mapping experiment that permitted to delineate its four
constituting areas V4t, MT, MSTv, and FST (Kolster et al., 2009). This approach
allowed us to clarify whether the strongest responses to CDOT in macaque emerge
beyond this cluster or within one or several of its components. It also permitted to
document CDOT responses in retinotopic area of the early visual cortex (V1, V2,
and V3) and along the dorsal (V3A) and ventral (V4) pathways. To determine
last experiment where we characterised the responses to moving versus static
objects.
Materials and Methods
Subjects
Two female rhesus macaques (age: 15-17 years; weight: 5.4-6.2 kg) were involved in
the study. Animal housing, handling, and all experimental protocols (surgery,
behavioural training, and MRI recordings) followed the guidelines of the European
Union legislation (2010/63/UE) and of the French Ministry of Agriculture (décret
2013–118). All projects were approved by a local ethics committee (CNREEA code:
C2EA – 14) and received authorisation from the French Ministry of Research
(MP/03/34/10/09). Details about the macaques’ surgical preparation and behavioural
training are provided elsewhere (Cottereau et al., 2017).
Data Availability
Data and analysis code will be made available after acceptance of the paper on a
dedicated platform (OSF: https://osf.io/yxrsv/).
Experimental design
Our stimuli were derived from those of previous fMRI studies that investigated how
cyclopean stereomotion (motion-in-depth based on CDOT) is processed in humans
(Likova & Tyler, 2007; Rokers et al.; 2009 and Kaestner et al., 2019). Our aim was to
facilitate the comparison between the cortical networks involved in the two species.
of radius) and refreshed at 30Hz. The dot density was 15%. To manipulate binocular
disparity between the two retinal projections, dots were green in one eye and red in
the other and stimuli were observed through red-green anaglyph filters (stimulus
code made available on OSF: https://osf.io/yxrsv/). In the ‘cyclopean stereomotion’
(‘CSM’) condition, dots within the upper and lower parts of the disk changed their
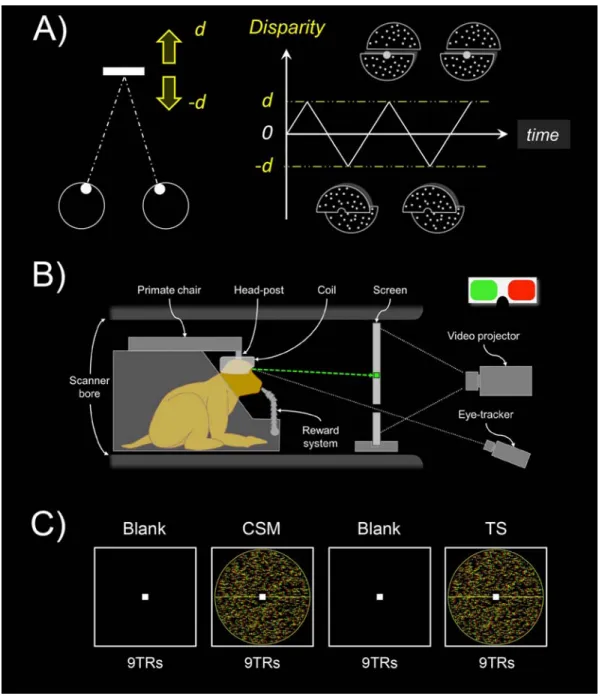
disparity in opposition of phase, following a triangular function (1Hz) between ±23.3 arcmin (see figure 1-A). This disparity range was chosen to maximise the cortical
responses to binocular disparities (see e.g. Backus et al., 2001; Cottereau et al.,
2011). The opposition of phase between stereomotion of the dots in the upper and
lower parts of the disc led to an average disparity across the visual field of zero at
each frame and thereby prevented stimulus-induced change in vergence eye
movement. Note that in this condition, motion in depth is defined from the change of
disparity over time (CDOT). We chose to use the term cyclopean stereomotion in
reference to the original human fMRI study of Likova and Tyler (2007).
Figure 1: Stimulus design and experimental protocol. A) In the main condition (‘CSM’ for cyclopean stereomotion), the motion occurs along the antero-posterior axis (leftward panel). The stimulus consisted of a disk (11° of radius) defined by dynamic random dot stereograms (dRDS) refreshed at 30Hz. Its upper and lower parts moved in depth between d = ±23.3 arcmin in opposition of phase, following a 1Hz triangular function (rightward panel). In our control condition (‘TS’ for temporally scrambled), the individual frames of the CSM condition were shuffled in time to disrupt the smooth change of disparity over time. Our two conditions had identical retinal disparity distributions but only the CSM condition conveyed motion-in-depth. B) Schematic representation of the monkey fMRI setup. The animal was seated in a sphinx position within the primate chair, in the bore of the scanner, with the 8-channel, phased-array coil placed on top of the head. The animal was involved in a fixation task while
its eye position was monitored by an infrared video-based eye-tracker. Horizontal disparity was introduced through red/green anaglyphs. C) Illustration of the experimental protocol. Recordings were performed using a blocked design, with the alternation of CSM and TS stimuli separated by blank periods. Each run contained 3 repetitions of such blocks plus an additional baseline period of 9TRs (117TRs in total). CSM conditions were shown first in half of the runs and TS conditions appeared first in the other half of the runs.
%%%%%%%%%%%%%%%%%%%%%%%%%%%%%%%%%%%%%%%%%%
Our CSM stimulus led to perceive two planes continuously moving alongside a
horizontal axis in opposite directions, one plane being located in front of the point of
fixation and the other behind the fixation point. The control stimulus consisted of a
‘temporally scrambled’ version (‘TS’) of the CSM stimulus. To create this temporally
scrambled condition, we shuffled the frames from the ‘CSM’ stimulus in order to
disrupt the temporal sequence and thus, the motion in depth. Importantly, both
conditions were monocularly identical and contained the same disparity distributions.
The average relative disparities between dots in the upper versus lower parts of the
disc were also identical between our two conditions.
MRI recordings
Image acquisition: Templates of reference and functional sessions
Whole-brain images were acquired on a 3 Tesla MR scanner (Phillips Achieva) using
a custom 8-channel phased-array coil (RapidBiomed) specifically designed to fit the
skull of our macaques while preserving their field of view. Four T1-weighted
anatomical volumes were acquired prior to the study for each monkey at a high
resolution (MPRAGE; repetition time, TR = 10.3 ms; echo time, TE = 4.6 ms, flip
angle = 8°; FOV: 155x155 mm; matrix size: 312x192 mm; voxel size = 0.5 x 0.5 x
0.5mm; 192 sagittal slices acquired in an interleaved order), as well as 300 functional
factor = 1.6; FOV: 100x100 mm; matrix size: 68x64 mm; voxel size = 1.25 × 1.25 ×
1.5mm, 32 axial slices acquired in an interleaved order with a thickness of 1.5 mm
and no gap). Those data were recorded in a single session whilst the macaques
were slightly anaesthetised (Zoletil 100:10 mg/kg and Domitor: 0.04mg/kg) and their
constants monitored with an MR compatible oximeter. Those volumes were then
used to create individual anatomical and functional templates of reference.
Our T2*-weighted functional images were acquired with a gradient-echo EPI
sequence with interleaved slice acquisition (TR = 2,000 ms, TE = 30 ms, flip angle =
75°, SENSE factor = 1.6; FOV: 100x100 mm; matrix size: 68x64 mm; voxel size =
1.25 × 1.25 × 1.5 mm, 32 axial slices acquired in an interleaved order with a
thickness of 1.5 mm and no gap).
Scanning Procedure
During the functional recording sessions, macaques were head-fixed and seated in a
sphinx position in a dedicated primate chair (see figure 1-B). They had to maintain
their gaze within a central fixation window (2x2°) during daily sessions of up to 2
hours. Their fixation was monitored with an ASL© infrared video-based eye tracking
setup at 60Hz and they were rewarded through a liquid delivery system (Crist
Instrument) at intervals whose frequency depended on their fixation performance.
Our cyclopean stereomotion stimuli were video-projected using a 23° x 23° field of
view (viewing distance = 85cm). We used a blocked design based on cycles within
which our two conditions (‘CSM’ and ‘TS’) were interleaved with baseline periods of
fixation (see figure 1-C). Both the condition and baseline blocks lasted 18 seconds (9
TRs) and a cycle was therefore 72-second long (36 TRs). Each run contained 3
duration of 117 TR (234 seconds). We displayed the stimuli, controlled for the
delivery of the liquid reward and the fixation performance using the EventIDE
software (Okazolab®).
Data analysis
Templates of reference
Anatomical and functional templates of reference were created for each individual
with the volumes acquired prior to the current study. The anatomical template was
obtained with the four T1-weighted anatomical volumes being realigned, averaged,
and then co-registered on the MNI space of the 112RM-SL template (McLaren et al.,
2009, 2010). To create the functional template, the 300 functional volumes (GE-EPI)
were realigned, averaged, and then co-registered on the anatomical template. Both
the T1 and the EPI mean images were segmented separately in order to obtain
tissue probability maps for the grey matter, the white matter, and the cerebrospinal
fluid (CSF). These probability maps were used to estimate the normalisation
parameters from functional (mean EPI) to structural (mean T1) images for each
individual.
Pre-processing of the raw functional data
Pre-processing and volume-based analyses were carried out with SPM12 in the
Matlab environment (MathWorks®). Only runs with central gaze fixation above 85%
were kept for further analysis. In total, we kept 43 and 60 runs for both macaques,
respectively. The 4 first volumes of each run were discarded (dummy scans) to
account for the establishment duration of the BOLD steady-state response.
performed first using as a reference the slice acquired in the middle of the acquisition
of each TR. Images were then reoriented, co-registered with the EPI template, and
transformed to fit the individual T1 template (with the normalisation parameters
estimated between the mean EPI and T1 images; see the ‘Templates of reference’
section). No motion correction was applied to the images. Finally, the images were
smoothed with a spatial Gaussian kernel (FWHM = 2x2x2 mm).
HRF estimation
Prior to our statistical analyses, we used independent datasets to characterise the
BOLD haemodynamic impulse response functions (HRF) separately for each animal.
These datasets respectively contained 16 (M01) and 12 (M02) 204s long runs that
consisted of 6 cycles of 4s full field counter phasing (10Hz) checkerboards separated
by a 30s blank interval (see more details about this procedure in Cottereau et al.,
2017). Data were pre-processed using the pipeline described above and projected
onto individual surfaces generated with the CARET software (Van Essen et al.,
2001). Following Dumoulin and Wandell’s procedure (2008), we extracted the BOLD
responses from nodes within the anatomically defined V1 of each individual. We only
kept visually responsive nodes, that is those whose signal-to-noise ratio (SNR) was
greater than 3. This SNR was estimated with a Fourier analysis of the average time
courses across runs where the signal corresponded to the Fourier coefficient
amplitude at the stimulation frequency F (i.e. F = 1/34) and the noise was given by
the average moduli at the two neighbouring frequencies (i.e. F – δf and F + δf, where δf = 1/2 is the resolution of our frequency analysis). We computed the average time course of these nodes during one cycle and used this average time
stimulus (our fMRI sampling rate). Note however that our stimulus duration was 4s
rather than 2s because linearity deteriorates at short durations (Boynton et al. 1996;
Logothetis and Wandell, 2004) and also because this duration was used in a
previous monkey fMRI study that characterised the BOLD HRF in macaque (Leite et
al., 2002). For each monkey, the average response to the 4s stimulus was fit as the
convolution of the responses to two 2s responses, each of which is the HRF. We
parameterised the HRF as the difference of two gamma functions (Friston et al.,
1998). This functional form of the HRF captures the late undershoot of the response
better than a single gamma function (Boynton et al., 1996).
General linear model (GLM) and whole-brain univariate analyses
Univariate statistics were performed at the voxel level in SPM12, using a general
linear model (GLM). Our visual (CSM and TS) and baseline conditions were
implemented as the three main regressors of the GLM. As reported above, we only
analysed runs with fixation performance greater than 85%. We used the oculometric
data of those runs to define regressors of non-interest that were included in the GLM
to exclude the possible contribution of eye movements from our analyses. These
regressors were obtained by automatically detecting the presence (1) or absence (0)
of saccades in the different volumes of every run. The corresponding saccade
regressors were then convolved with the HRF and introduced into the model. To
characterise and eliminate noise in our recordings, we also performed a principal
component analysis on voxels located outside the brain (see Farivar and Vanduffel,
2014). Indeed, time courses in those voxels should not be influenced by our
experimental design but rather reflect artefacts caused by movements of the animal.
For each run, we determined the number of principal components that were
corresponding principal vectors as regressors of non-interest in our model. This
adaptive procedure typically added an average of 13.3 (±9.3) and 11.3 (±5.1)
additional regressors in the models for Monkey 1 (MO1) and Monkey 2 (MO2),
respectively.
We estimated the beta values associated with our GLM using the RobustWLS
toolbox (Diedrichsen & Shadmehr, 2005), which is provided as an additional toolbox
for SPM12 (http://www.diedrichsenlab.org/imaging/robustWLS.html). This approach
allows estimating the noise variance for each image in the time series, using the
derivative of a maximum likelihood algorithm. Variance parameters are then used to
obtain a weighted least square estimate of the regression parameters of the GLM. It
therefore helps to reduce the impact of noisier volumes on beta estimation. Previous
studies showed that such a method significantly improved estimations in
blocked-design fMRI experiments (see e.g. Takeuchi et al., 2011). The beta weights obtained
from the GLM were subsequently used to perform univariate analyses (t-scores) at
the whole brain level. These analyses were performed on the pre-processed EPI
data and the beta weights were then projected onto the high-resolution volumes of
our two animals. They were also projected on the individual cortical surfaces and on
the cortical surface of the F99 template using the Caret software (Van Essen et al.,
2001).
Localisation of areas selective to motion-in-depth and description of their responses
In order to identify areas with specific responses to motion-in-depth, we examined
the statistical parametric map corresponding to the contrast between our two visual
conditions (‘CSM’>‘TS’) and thresholded this map at p<10-3 (uncorrected,
CSM than to TS in both hemispheres and in each animal were considered. We
controlled that these areas overlapped when projected on the right cortical surface of
the F99 template. To further document the activations in those areas, we identified
their local maxima and considered 3x3x3 voxel cubes around their coordinates. We
then computed the percentage of signal change (PSC) corresponding to our main
condition and its control using the following equations:
PSCCSM = (βCSM – βbaseline) / βconstant x 100
PSCTS = (βTS – βbaseline) / βconstant x 100
These values were extracted within small (3x3x3) voxel cubes rather than within
patches determined by anatomical and/or statistical criteria, due to the fact that
anatomical borders between areas are difficult to determine precisely and that our
contrast led to extended activations that cannot be accurately divided into clusters
corresponding to different functional regions (see figures 2, 3 and 4). Our approach is
more conservative and avoids subjectivity when dealing with borders between areas.
Importantly, we reproduced our analyses with betas extracted from smaller (1x1x1)
or larger (5x5x5) voxel cubes, and this did not impact our results. Note that here we
just document activations around the local maxima of selective areas (notably the
relative difference between activations in our main condition and in its control and
also the variability across runs) but we do not perform additional statistical analyses
so as to avoid double dipping (Kriegeskorte et al., 2009).
Definition of retinotopic areas and characterisation of their responses to motion-in-depth
We also performed a wide-field retinotopic mapping to delineate retinotopic regions
acquired with an identical setup as for the main experiment. In this case, visual
stimuli were displayed using a large field-of-view (80° of visual angle, viewing
distance = 25cm) and consisted of videos of a fruit basket that was moving laterally,
forward and backward in monocular viewing. Traditional (clockwise/counter
clockwise) rotating wedges (radius: 40°, angular extent: 49°) and
expanding/contracting rings (eccentricity linearly varying between 0° and 40°) were
used as visual apertures through which the fruit basket was displayed. Each run
lasted 230s and contained 5 cycles of 44s with the first 10 seconds of a run being
discarded (dummy scans) for the signal to reach its baseline. A small green square
(0.4° x 0.4°) at the centre of the screen was used to control for fixation during passive
viewing. As in our main experiment, only runs with more than 85% of correct fixation
(respectively 47 and 48 runs for M01 and M02) were kept for further analyses. A
pre-processing pipeline similar to the one described above was performed on the
selected runs except that no smoothing was applied to the volumes and a fixed
number of components (18 components) was used when performing the PCA, later
used as a regressor of non-interest in the GLM. We projected the volume data onto
individual surfaces using the Caret software (Van Essen et al., 2001) and a custom
reorientation algorithm.
A population receptive field (pRF) analysis (Dumoulin & Wandell, 2008) was
performed using the Matlab analyzePRF toolbox developed by Kay et al., (2013). For
each surface node, an exhaustive set of theoretical pRF parameters (polar angle,
eccentricity and size) was used to generate time courses that were compared to the
real recordings. pRF size and position parameters that best predicted the data were
selected as the node pRF parameters. With this approach, we obtained polar angle
described in previous monkey fMRI studies: V1, V2, V3, V4, V3A, as well as the
regions within the Superior Temporal Sulcus (STS) (V4t, MT, MSTv, and FST) that
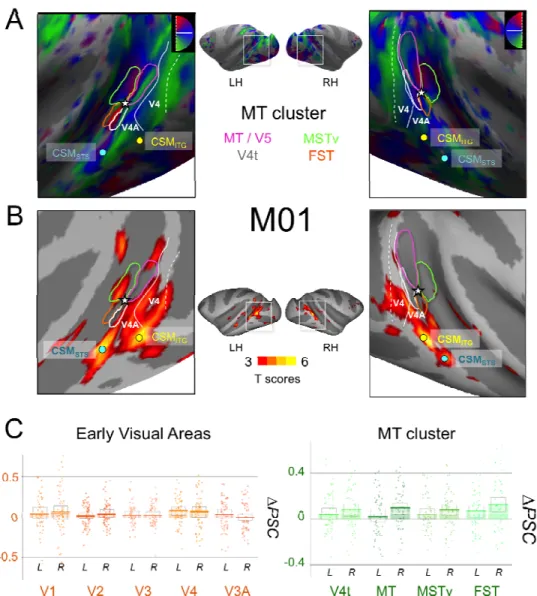
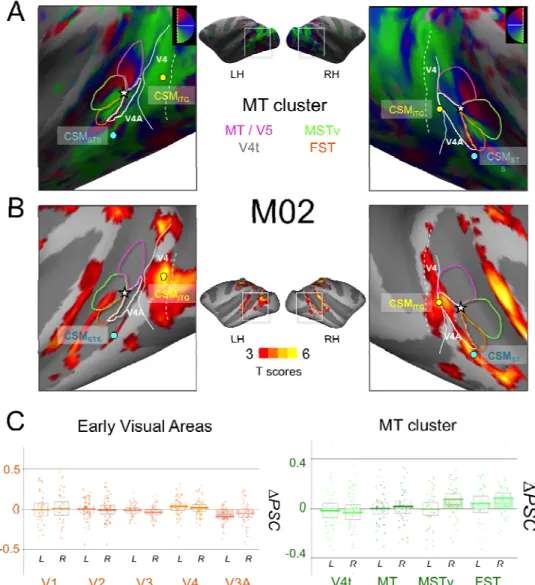
form the MT cluster as described by Kolster et al. (2009). Those 8
retinotopically-defined regions were then projected back to the volumetric space to perform a
ROI-based analysis of our motion-in-depth data. This was done using the inverse of the
transformation between the volumetric and surface spaces mentioned above.
To test whether these retinotopic areas had specific responses to motion in depth,
we first estimated their average PSC during the CSM condition and its TS control.
We subsequently computed the corresponding difference between PSCs:
ΔPSC = PSCCSM - PSCTS,
Note that we chose here to use the difference of PSCs because the PSCs for the
CSM and TS conditions are paired. In order to estimate whether our observed PSC
differences in these retinotopic areas were not due to chance, we computed
permutation tests. We randomly attributed a negative sign to our PSC values and
computed the mean difference, repeating this procedure 10,000 times. We then
calculated a p-value defined as the proportion of random differences that were
superior to our observed difference.
2D motion localisers
To determine whether the regions that have specific responses to binocular 3D
motion are also responsive to 2D motion, we performed a control experiment in
which we contrasted responses to static images versus rich 2D motion stimuli. The
scanning procedure was identical to the main experiment procedure. Motion localiser
experiment. For the static version, static images were randomly drawn from the video
and refreshed at 1Hz. For the moving version, the video was normally played. Stimuli
were displayed either centrally (<3° of eccentricity) or peripherally (>3° of
eccentricity). As for the retinotopic experiment (see the previous section), these
visual stimuli were displayed using a large field-of-view (80° of visual angle) at a
viewing distance of 25cm. Each visual condition lasted 6 seconds and was
interleaved with a 10-second baseline. The four visual conditions were presented in a
pseudo-randomised order and were repeated 3 times within each run. Five extra
baseline scans were added at the beginning of a trial for the signal to reach its
baseline, thus resulting in a total duration of 202 seconds (101 TRs) for each run. In
total 42 and 26 runs with fixation above 85% were kept for our analyses. Selected
data was pre-processed as previously described, with an adaptive number of
components that were necessary to explain 80% of the variance for each run, adding
an average of 12.6 (±10.1) and 11.9 (±3.7) additional regressors in the model.
To estimate motion sensitivity in our regions of interest and in our retinotopic areas,
we contrasted moving and static conditions, by combining central and peripheral
presentations. We then performed a ROI-based analysis, looking at the BOLD
activity within our independently defined regions.
Results
The aim of this study was to identify the cortical network that processes
disparity-defined motion-in-depth (i.e. cyclopean stereomotion) in two awake, behaving
macaques using functional magnetic resonance imaging. Our experimental design was directly derived from previous human neuroimaging studies (Likova & Tyler,
2007; Rokers et al., 2009; Kaestner et al., 2019) so as to determine the homologies
but also the differences between the BOLD activations in the two species (Orban,
2002). Our cyclopean stereomotion (‘CSM’) condition and its temporal scramble
(‘TS’) control were defined from dynamic random dots stereograms (dRDS). They
had identical retinal disparity distributions but differ in their temporal sequences (see
the materials and methods section). Only the CSM condition conveyed
motion-in-depth. Figures 2 and 3 show the statistical parametric maps obtained for the contrast
between ‘CSM’ and ‘TS’ on the individual anatomical templates of each subject (M01
on figure 2 and MO2 on figure 3). These data are shown for different coronal slices.
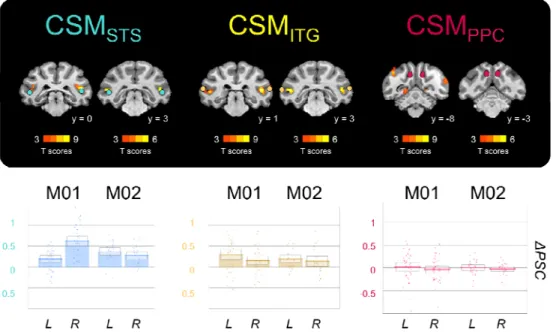
Figure 2: Activations for the contrast between Cyclopean Stereomotion (CSM) and its temporally scrambled version (TS) for M01. Figure shows activations that were stronger for the CSM condition than for the TS condition (T-score>3.1; p<10-3 uncorrected). Data are projected on the individual anatomical template of the macaque and are shown for different coronal slices. Coloured arrows indicate the localisation of our three regions of interest: CSMSTS (in blue), CSMITG (in yellow), and CSMPPC (in pink). T-scores were obtained after
computing the statistical parametric map for the contrast of interest between CSM and TS.
%%%%%%%%%%%%%%%%%%%%%%%%%%%%%%%%%%%%%%%%%%
%%%%%%%%%% INSERT FIGURE 3 ABOUT HERE %%%%%%%%%%%
Figure 3: Activations for the contrast between Cyclopean Stereomotion (CSM) and its temporally scrambled version (TS) for M02. Conventions are similar to figure 2.
On these two figures, red-to-orange colours indicate significantly stronger BOLD
activations for the CSM condition than for the TS condition (p<10-3, uncorrected).
Despite differences in the activation patterns observed in the two animals, this
analysis reveals a network encompassing the temporal and parietal cortices in both
monkeys. Notably, three cortical areas are consistently found in both the left and the
right hemispheres of our two macaques. Coloured arrows show these areas. For
sake of comparison with previous human neuroimaging studies, we named those
areas after Likova and Tyler’s denomination (Likova & Tyler, 2007), that is, CSM for
Cyclopean StereoMotion responsive areas. The first area (CSMSTS) is located on the
posterior bank of the superior temporal sulcus (STS) and extends posteriorly on the
infero-temporal gyrus. The second one (CSMITG) is located on the infero-temporal
gyrus, at the intersection between the lunate sulcus, the inferior occipital sulcus (IOS)
and the STS. The last area (CSMPPC) is localised in the posterior parietal cortex
(PPC), mostly on the medial bank of the intra-parietal sulcus (even though activations
can also be observed on its lateral bank in M02). This area might therefore
correspond to the posterior intra-parietal (PIP) area. To be sure that the anatomical
localisations of these 3 areas are not affected by our projections on the individual
anatomical (T1) images, we confirmed their position on the functional (EPI) images in
both monkeys (see supplementary figure 1). The MNI coordinates corresponding to
the local maxima of these areas in the two animals are provided in table 1.
%%%%%%%%%% INSERT TABLE 1 ABOUT HERE %%%%%%%%%%%
ROI M01 M02 x y z x y z CSMSTS L R CSMITG L -23 21 -29 0 0 4 15 17 15 -19 20 -23 3 4 3 16 16 18
R CSMPPC L R 28 -5 5 1 -8 -7 20 28 27 26 -6 6 3 -3 -2 19 30 30
Table 1: MNI coordinates (in mm) of the local maxima for the 3 regions that were significantly more responsive for the CSM condition than for the TS control in the two hemispheres of the two animals.
%%%%%%%%%%%%%%%%%%%%%%%%%%%%%%%%%%%%%%%%%%
To demonstrate the consistency of these results across hemispheres, we show on
figure 4 the projections of these activations on the individual cortical surfaces (see
panel A).
Figure 4: Activations for the contrast between Cyclopean Stereomotion (CSM) and its temporally scrambled version (TS) projected onto individual cortical surfaces and on the F99 template. A) Activations that were stronger for the CSM condition than for the TS condition. Data were thresholded at p<10-3 (uncorrected) and projected on the individual cortical surfaces of each animal (dorsal, frontal, and medial views). Coloured dots indicate the localisation of our three regions of interest: CSMSTS (in blue), CSMITG (in yellow), and CSMPPC
(in pink). B) Degree of overlap between the activations found in the two hemispheres of the two animals. The 4 individual cortical surfaces were morphed onto the right cortical surface of the F99 macaque template for projection of all the thresholded maps (frontal, dorsal and medial views). Blue colour indicates the overlap of 3/4 hemispheres and green colour of 4/4 hemispheres. C) Percentages of signal change (PSC) for the 2 visual conditions (CSM and TS) with respect to baseline (fixation on a black screen) in our three regions of interest. The boxes give the 95% confidence intervals for the average values. The dots provide the data for each run. A small jitter was introduced to facilitate visibility.
%%%%%%%%%%%%%%%%%%%%%%%%%%%%%%%%%%%%%%%%%%
As can be observed, our three regions of interest are found in all the individual
surfaces, even though CSMPPC is less visible in the right hemisphere of M01. This
was confirmed by our projections of these activations on the right hemisphere of the
F99 template. Figure 4-B shows that our three regions overlap in at least 3
hemispheres for CSMPPC and in 4 hemispheres for CSMSTS and CSMITG. The bar
graphs on figure 4-C provide the activations elicited by our CSM condition and its TS
control relative to baseline (blank screen) around those local maxima (see the
material and methods). The thick lines provide the average values and the boxes
give the corresponding 95% confidence intervals.
Finally, it is worth noting that in monkey M02, significant BOLD activations were also
found in more anterior parts of the IPS notably within the ventral and anterior
intraparietal areas (VIP and AIP, respectively). VIP has been shown to be involved in
and human (Wall & Smith, 2008), whereas AIP has been suggested to play a role in
3D object processing and visually guided hand movements in both species as well
(Sakata et al., 1997; Durand et al., 2007; Shikata et al., 2007). However, these
activations were not confirmed in the second animal, potentially revealing a greater
inter-subject variability in higher-order areas. In M02, activations were also found on
the anterior part of the STS but they reflect responses from the fundus of the STS
and/or from its posterior bank that were smoothed by our pre-processing pipeline
and/or our transformations from the volume to the individual surfaces. The activations
observed in the anterior part of the STS actually belong to clusters centred on the
posterior bank.
Finally, it is important to emphasise here that we did not observe significant CSM
responses on the cortex medial faces. Neither the anterior bank of the
parieto-occipital sulcus, where the motion sensitive area V6 is located (see e.g. Pitzalis et
al., 2013), nor the posterior part of the cingulate sulcus, where our group previously
identified an area (pmCSv) responsive to egomotion-compatible optic flow
(Cottereau et al., 2017), seem to have strong sensitivity to motion-in-depth.
Retinotopic analysis
Previous studies in human found that the hMT+ complex had significant responses to
stereomotion, notably based on changing disparity over time (CDOT) (Rokers et al.,
2009; Joo et al., 2016). A single-cell study in macaque also found a weak but
significant selectivity to CDOT in area MT (Sanada & DeAngelis, 2014). In order to
determine whether the CSM-responsive ROIs we obtained from our univariate
analyses overlap with (or correspond to) area MT and/or its neighbour regions, we
and methods section). This allowed us to delineate the areas of the MT cluster: V4t,
MT, MSTv and FST (see Kolster et al., 2009), which is not possible with more
classical motion localisers of the MT / hMT+ complex (even though some human
studies proposed solutions to separate hMT from hMST, see Huk et al., 2002). In
figures 5-A and 6-A, we show the locations of these areas and of our two
CSM-responsive regions around the STS and the ITG, CSMSTS and CSMITG, respectively.
Figures 5-B and 6-B present the activations for the contrast between cyclopean
stereomotion (CSM) and its temporally scrambled version (TS) projected on the
same views.
Figure 5: A) Retinotopic mapping of the Superior Temporal Sulcus (STS) for M01 and delimitation of the MT cluster areas: MT (dark blue), V4t (pink), MSTv (orange), and FST (green). We show here the polar angle maps that were used to delineate the borders between these areas. The extent of those areas was obtained from the eccentricity maps. We also show the representations of the vertical and horizontal meridians that delineate the borders between V3 and V4 and between V4 and V4A. Coloured dots indicate the local maxima positions for areas CSMSTS (in blue) and CSMITG (in yellow). As shown on the maps,
CSMSTS and CSMITG are in the vicinity of the MT cluster, but clearly exterior to it. B)
Activations for the contrast between Cyclopean Stereomotion (CSM) and its temporally scrambled version (TS) projected on the individual surfaces of M01, for both left and right hemispheres. C) Difference in percent signal change (∆PSC) between the CSM and TS conditions in retinotopic areas. On the left, thick lines of the bar graphs provide average values for the left and right hemispheres of early visual areas: V1, V2, V3, V4, and V3A. On the right, average values are given for the MT cluster areas: V4t, MT, MSTv, and FST. The
boxes give the 95% confidence intervals for the average values. The dots provide the data for each run. A small jitter was introduced to facilitate visibility.
%%%%%%%%%%%%%%%%%%%%%%%%%%%%%%%%%%%%%%%%%%
%%%%%%%%%% INSERT FIGURE 6 ABOUT HERE %%%%%%%%%%%
Figure 6: A) Retinotopic mapping of the Superior Temporal Sulcus (STS) for M02 and delimitation of the MT cluster areas: MT (dark blue), V4t (pink), MSTv (orange), and FST (green). B) Activations for the contrast between Cyclopean Stereomotion (CSM) and its temporally scrambled version (TS) projected on the individual surfaces of M02, for both left and right hemispheres. C) Difference in signal change (∆PSC) between the CSM and TS conditions in retinotopic areas. Conventions are similar to figure 5.
We can see that although our two regions are close to the MT cluster, they do not
overlap with it. Area CSMSTS is located more anteriorly along the posterior bank of
the STS. Area CSMITG is located more posteriorly on the ITG, in a position that might
correspond to areas V4 and/or V4A (see discussion).
To complete our study and to allow a direct comparison with previous human data
(Likova and Tyler, 2007; Rokers et al., 2009; Kaestner et al., 2019), we performed
ROI-based analyses within retinotopically-defined areas constituting the the MT
cluster as well as the early-to-intermediate visual cortex: V1, V2, V3, V4, and V3A.
The differences between the percentages of signal change (∆PSC) for CSM versus TS in our two macaques are shown on figure 5-B and 6-B for early visual areas (V1,
V2, V3, V3A and V4) and for the MT cluster (V4t, MT, MSTv, and FST). We can
observe that if CSM selectivity in all these areas is not as pronounced as in CSMSTS,
CSMITG, and CSMPPC, responses in the MT cluster tend to be stronger than those
measured in V1, V2, and V3. Permutation tests demonstrated significant CSM effects
in areas MT and V4t (1/4 hemispheres), MST (2/4 hemispheres, right hemispheres
only), and FST (3/4 hemispheres). This suggests the presence of a marginal
selectivity to cyclopean stereomotion in these regions. We also found that responses
were significantly stronger for motion in depth in area V4 for one animal (2
hemispheres) but not for the other. Responses to CSM were not significantly stronger
in V3A.
2D motion analysis
To test whether our three regions are only responsive to motion-in-depth or whether
they are activated by motion in general, and notably by 2D motion, we ran an
M02, see more details in the Materials and methods section). We then computed the
difference between the percentages of signal change (ΔPSC) corresponding to the 2D motion versus static image conditions. As expected from such a localiser, this
analysis led to significantly stronger responses to motion in most of the retinotopic
areas and more specifically within areas of the MT cluster. In particular, permutation
tests demonstrated that all 4 regions of the MT cluster had significantly stronger
responses to 2D motion in the two animals (p<0.05, except for left V4t in M02). We
show in figure 7 the results of these analyses in our 3 CSM responsive areas
(CSMSTS, CSMITG, and CSMPPC).
%%%%%%%%%% INSERT FIGURE 7 ABOUT HERE %%%%%%%%%%%
Figure 7: Sensitivity to 2D motion in CSMSTS, CSMITG, and CSMPPC. Stronger responses to
2D motion than to static snapshots of the same video sequences are shown on coronal slices from the individual anatomical template of each animal (upper panel). The colour dots provide the position of CSMSTS, CSMITG, and CSMPPC. For these 3 regions, PSC difference
between responses evoked by 2D motion and static images is shown on the lower panel. The thick lines of the bar graphs provide the average values across runs for the left (L) and right (R) hemispheres of the two monkeys (M01 and M02). The boxes give the 95%
confidence intervals for these average values. The dots provide the data for each run. A small jitter was introduced to facilitate visibility.
%%%%%%%%%%%%%%%%%%%%%%%%%%%%%%%%%%%%%%%%%%
We can observe that only CSMSTS and CSMITG have a significant response to 2D
motion (permutation tests, p<0.05), in both hemispheres for CSMSTS and in the left
hemisphere for CSMITG, for each monkey. Their motion selectivity (in particular in
CSMSTS) is therefore not specific to cyclopean stereomotion. On the opposite,
responses to 2D motion in area CSMPPC are not different from responses to static
patterns (permutation tests, p>0.1). It implies that this region might uniquely respond
to cyclopean stereomotion.
Selectivity to 3D versus 2D motion within the lower bank of the STS
To further characterise the selectivity to 3D and 2D motion within the STS, we
defined a path running along the posterior bank of this sulcus on the cortical surfaces
of each hemisphere of our two animals. Each path departs from MT area and ends in
the CSMSTS area. For each voxel along this path, we computed the average t-score
within its first order neighbourhood (i.e. within a 3x3x3 cube centred on this voxel) for
both the stereomotion versus temporal scramble and 2D motion versus static images
contrasts. As t-scores for the second contrast were usually higher, we normalised the
values along each path by dividing them by the maximum t-scores along the path.
This facilitates comparisons between the sensitivity profiles for 3D and 2D motion. As
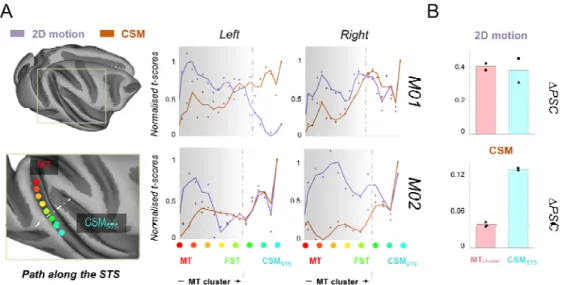
shown in Figure 8-A, these profiles suggest that selectivity to stereomotion varies
within the STS, with lower t-score values within the MT cluster and higher values in
sensitivity to 2D motion. This observation was confirmed by computing the average
percentages of signal changes (∆PSC) for 2D and 3D motion in those two regions (N.B.: the value for the MT cluster is the average ∆PSC across the path). The corresponding bar graphs are shown in Figure 8-B.
%%%%%%%%%% INSERT FIGURE 8 ABOUT HERE %%%%%%%%%%%
Figure 8. Selectivity to cyclopean stereomotion (CSM) and 2D motion within the STS. A) The left panel is a schematised view of the path drawn along the lower bank of the STS, starting from MT area (red dot) and ending within the CSMSTS area (cyan dot) defined from
the stereomotion versus temporal scramble contrast. The grey dotted line represents the end of the MT cluster. On the right panel, responses to the cyclopean stereomotion (CSM, i.e. stereomotion versus its temporal scramble control) and 2D motion (i.e. 2D motion versus static images) contrasts are respectively shown in orange and purple for each hemisphere of both macaque subjects. Dots provide the normalised t-score values along the path whilst the curves were obtained from a median filtering of these values. The general trend is an increase of CSM selectivity along the STS, with the highest value outside the MT cluster. Selectivity to 2D motion peaks in the MT cluster and tends to decrease along the STS path. B) Average differences in signal change (∆PSC) values in response to both types of tested motions (2D and CSM) in the four MT cluster areas (red bars) and in the CSMSTS area (cyan bars) for both subjects (triangle symbols for M01 and circle symbols for M02).
%%%%%%%%%%%%%%%%%%%%%%%%%%%%%%%%%%%%%%%%%
Discussion
The aim of the present study was to characterise the cortical areas that process
cyclopean stereomotion in rhesus macaque. To that end, we adapted the
experimental protocols of previous human fMRI studies that investigated the cortical
processing of motion in depth (Likova & Tyler, 2007; Rokers et al., 2009; Kaestner et
al., 2019). Our main condition (‘CSM’ for cyclopean stereomotion) and its control
(‘TS’ for ‘temporally scrambled’) shared the same disparity distribution and were
monocularly identical (figure 1) but only the CSM condition conveyed stereomotion,
since the temporal sequence was scrambled in the TS condition. We recorded
whole-brain BOLD responses from two behaving macaques involved in a passive
fixation task using a block design. Our analyses revealed a network of three areas
whose responses to our CSM condition were consistently (i.e. across hemispheres
and animals) stronger than those to our control condition (figures 2, 3, and 4). In
reference to the original study of Likova & Tyler (2007), we labelled those regions
CSMSTS, CSMITG, and CSMPPC. To complete these analyses, we also documented
responses to our CSM condition in visual areas estimated from independent
wide-field retinotopic mapping procedures (figures 5 and 6).
Our CSMSTS region is located on the inferior bank of the superior temporal sulcus
(STS) and extends on the infero-temporal gyrus (see figures 2, 3, and 4), at a
location (see table 1) anterior to the MT area and its satellites (V4t, MSTv, and FST,
outside the MT cluster (only a marginal overlap with area FST was found in the right
hemisphere of M02). Our additional motion localiser demonstrated that it is also
responsive to 2D motion (figure 7). Previous studies in macaque reported additional
motion-sensitive regions in anterior portions of the STS. Using fMRI, Nelissen et al.,
(2006) notably documented an area in the lower superior temporal sulcus (LST) that
responds to opponent motions and to actions. This area was 6-8mm anterior to FST
and therefore does not fully coincide with our CSMSTS area. Another monkey fMRI
study found several regions of the macaque inferior temporal cortex that had specific
responses to disparity-defined stimuli (Verhoef, Bohon, and Conway, 2015). Among
them, a region labelled ‘Pd’ (for posterior disparity) was localised in the lower bank of
the STS, at a position that matches very well with our CSMSTS area. CSMSTS might
thus be a distinct motion and disparity-selective area of the STS that notably
processes motion in depth. In human, two studies (Likova and Tyler, 2007; Kaestner
et al., 2019) found specific responses to cyclopean stereomotion in a cortical region
anterior to the hMT+ cluster: CSM (N.B.: Rokers et al., (2009) only performed
ROI-based analyses and it is therefore not possible to know whether they also had
significant responses to motion in depth in this region). Our CSMSTS area might
therefore be its macaque homologue. It is nonetheless important to note here that in
the human studies, the delineation of the hMT+ complex (and sometimes its hMT and
hMST sub-regions) was based on a contrast between the responses to uniform
versus random motion whereas in our case the MT cluster was obtained from
retinotopic mapping. To further clarify the potential homology between human CSM
and macaque CSMSTS, it would be interesting for future human studies to properly
define area MT and its satellites using retinotopic mapping (see Kolster et al., 2010)
in order to precisely determine the location of the CSM area with respect to those
Our stereomotion contrast was based on a smooth variation in depth versus its
temporally scrambled version (as in Kaestner et al., (2019) and in the ‘TS’ control of
the second experiment of Rokers et al. (2009)). Although we used dynamic random
dot stereograms, it is possible that this temporally scrambled control still evokes
some apparent percept of motion. However, it lacked the smooth change of disparity
of our main condition. In their experiments, Likova and Tyler (2007) used two planes
that alternated between two different depths (thereby generating an apparent motion
in depth) in their main condition whereas their corresponding control was a plane at a
unique depth. We hypothesise that in both human and macaque, the CSMSTS / CSM
area might be activated by different types of motion in depth, and notably by our
contrast and the one used by Likova and Tyler (2007). This hypothesis is further
supported by a control performed by these authors (see their supplementary
materials) that demonstrated that significant activations were also obtained in this
area with stimuli smoothly varying in depth (i.e. where binocular disparity was
changed according to a sine wave), being therefore closer to those used in our own
study.
Although our univariate statistics did not show significant responses in the MT area
and its satellites, ROI-based analyses demonstrated that for some animal and/or
hemispheres, responses in V4t (1/4 hemispheres), MT (1/4 hemisphere), MSTv (2/4
hemispheres), and FST (3/4 hemispheres) were significantly stronger for our
stereomotion condition (figures 5 and 6). In a pioneer study, Maunsell and Van Essen
(1983) concluded from single-cell recordings in area MT of anaesthetised macaques
that neurons in this region had no selectivity to motion-in-depth (see also Felleman
method, that MT does host neurons tuned to motion-in-depth (see also Czuba et al.,
2014) but that these neurons were mostly driven by the inter-ocular velocity
difference (IOVD) between the two eyes with only a modest contribution of the
change of disparity over time (CDOT): ~10% of their neurons had significant
selectivity for CDOT versus ~57% for IOVD. These findings are in line with our study
and suggest that if selectivity to stereomotion is observable in area MT, it remains
moderate. To our knowledge, selectivity to motion-in-depth was not directly tested in
areas MSTv and FST. Based on our data, we hypothesise that a larger proportion of
neurons tuned to cyclopean stereomotion could be found there. Altogether, the
responses we measured in the STS are consistent with a model where stereomotion
would be progressively integrated along a posterior-to-anterior axis with moderate
responses in MT, intermediate responses in areas MSTv and FST, and stronger
responses in CSMSTS. This hypothesis is supported by our analysis of the responses
on a path defined along the STS (see figure 8), which suggests that selectivity to
stereomotion progresses beyond area MT.
Using a ROI-based analysis, all three previous human studies found significant
responses to motion in depth in the hMT+ cluster. Likova and Tyler (2007) reported
that selectivity in this cluster was weaker than in their CSM region, in agreement with
what we found in macaque. In contrast, Kaestner et al. (2019) found that responses
in hMT+ (in both hMT and hMST) were stronger than in CSM (see their figure 7).
Given their use of a relatively small field of view (i.e. their stimuli had 5° of radius)
contrasting with much larger stimuli in our experimental protocol (11° of radius) and
in Likova and Tyler’s experiment (i.e. their display was a square of 30 x 40°), one
possibility would be that neurons in the CSMSTS and CSM regions prefer more
eccentricities and sizes in the MT cluster and in CSMSTS (see supplementary figure
3-B and 3-D) and showed that in CSMSTS these parameters are actually similar to those
found in V4t and FST, thus discarding this hypothesis. Further studies, notably in
human where retinotopic mapping could be used to better define the position of CSM
with respect to area MT and its satellites, will be needed to clarify this point.
Our CSMITG region is located on the infero-temporal gyrus, at the intersection of the
lunate sulcus, the inferior occipital sulcus (IOS), and the STS (see figures 2, 3, and
4). It is therefore posterior to the MT cluster (see figures 5 and 6). This location
matches well with area V4A that was previously described using single-cell
recordings (Pigarev et al.; 2002) and fMRI (Kolster et al., 2014). CSMITG also
overlaps with area V4, as suggested by our retinotopic analyses for which responses
to motion in depth were significantly stronger in this area for one animal (see also
panel B of figures 5 and 6). Unfortunately, signal-to-noise ratios in our retinotopic
data were not sufficient to properly map area V4A (notably its anterior border with
area OTd) and further studies will be needed to clarify its responses to stereomotion
relatively to those estimated in V4. Both V4 and V4A are activated by disparity
(Watanabe et al., 2002; Verhoef et al., 2015) and motion (Li et al., 2013; Kolster et
al., 2014), even though their motion selectivity is not as pronounced as in the MT
cluster (Kolster et al., 2014). This in line with our finding that CSMITG has only
moderate responses to 2D motion, notably when compared to motion responses in
area CSMSTS (figure 7). Interestingly, two human studies on motion in depth (Likova
and Tyler, 2007; Kaestner et al., 2019) reported significant CSM responses in area
V4. Kaestner et al. (2019) also found strong steremotion responses in area LO-1
(and Rokers et al. (2009) in area LO which includes LO-1) which was proposed to be
good correspondence between CSM responses in those regions of the human and
macaque brains.
Area CSMPPC is localised in the posterior parietal cortex (PPC), mostly on the medial
bank of the intra-parietal sulcus (IPS). Responses in this region were not stronger for
2D motion than for static stimuli, in agreement with previous monkey fMRI studies
(see e.g. Vanduffel et al., 2001). Because of its localisation, area CSMPPC might
correspond to the posterior intra-parietal area (PIP) (Colby et al., 1988; Markov et al.,
2014). Even though further studies will be needed to clarify this point, it is tempting to
hypothesise that there might be a functional dissociation for 3D processing between
this area and its counterpart on the lateral bank of the IPS, the caudal intra-parietal
area (CIP). Indeed, in a previous monkey fMRI study, Durand et al. (2007) revealed
sensitivity to kinetic depth in area PIP and AIP (for which we also found activations in
M02) but not in area CIP. Area PIP has also been shown to respond to 3D structure
(see e.g. Alizadeh et al., 2018). It might therefore play a role in the detection of and
interaction with moving objects whereas CIP could be involved in processing 3D
orientation and/or 3D features/arrangement of elements (Tsutsui et al, 2002; Durand
et al., 2007; Rosenberg et al., 2013). In human, the studies of Likova & Tyler (2007)
and of Rokers et al. (2009) did not explore stereomotion selectivity in the parietal
cortex (the latter nonetheless reported significant responses to CDOT in dorsal area
V3A). The only study that reported results at the whole-brain level (Kaestner et al.,
2019) found strong stereomotion responses in area IPS-0, which is located in the
caudal part of the human IPS and therefore constitutes a potential homologue of our
CSMPPC region. Further studies will be necessary to clarify this point.
Finally, we did not find CSM specific activations in area V3A although this area is
activated human area V3A in previous studies (Likova & Tyler, 2007; Rokers et al.,
2009; Kaestner et al., 2019). In this area, this is not the only functional difference in
motion processing between the two species as responses to structure from motion
are known to be much stronger in human V3A than in macaque V3A (Vanduffel et
al., 2002, see also Orban et al., 2003).
In order to avoid eye movements, and notably vergence, to contaminate our
activations, we took several precautions. As mentioned in the Material and methods
section, we only kept runs for which fixation performance was above 85%.
Furthermore, our stimuli were designed to avoid driving vergence, with an average
disparity value across space that was always equal to zero. Finally, we used the
detected saccades as regressors of non-interest in our GLM. It is also worth noting
that the activations we observed when contrasting our two conditions of interest
(CSM vs. TS) are different from the vergence networks as investigated in terms of
vergence tracking and vergence steps by Ward and collaborators (Ward et al. 2015).
Additional analyses based on fixation performances and variance of eye position
along the x and y axes during the CSM and TS conditions further demonstrated that
eye movements did not impact our results (see supplementary figure 2 and the
accompanying text).
Conclusion
Our fMRI recordings in two macaques demonstrated that cyclopean stereomotion is
mainly processed by three cortical areas: CSMSTS, CSMITG, and CSMPPC. We also
observed a moderate selectivity in areas of the MT cluster, mostly MSTv, and FST.
protocol and therefore suggest that the cortical network processing stereomotion is
relatively well preserved between the two primate species.
References
Alizadeh, A. M., Van Dromme, I., Verhoef, B. E., & Janssen, P. (2018). Caudal Intraparietal Sulcus and three-dimensional vision: A combined functional magnetic resonance imaging and single-cell study. Neuroimage, 166, 46-59.
Backus, B.T., Fleet, D.J., Parker, A.J., & Heeger, D.J. (2001). Human cortical activity correlates with stereoscopic depth perception. Journal of Neurophysiology, 86(4), 2054-2068.
Boynton, G.M., Engel, S.A., Glover, G.H., Heeger, D.J. (1996). Linear systems analysis of functional magnetic resonance imaging in human V1. Journal of Neuroscience, 16(13), 4207-4221.
Britten, K. H., Newsome, W. T., Shadlen, M. N., Celebrini, S., & Movshon, J. A. (1996). A relationship between behavioral choice and the visual responses of neurons in macaque MT. Visual neuroscience, 13(1), 87-100.
Colby, C. L., Gattass, R., Olson, C. R., & Gross, C. G. (1988). Topographical organization of cortical afferents to extrastriate visual area PO in the macaque: A dual tracer study. The Journal of Comparative Neurology, 269(3), 392–413. https://doi.org/10.1002/cne.902690307
Cottereau, B. R., McKee, S. P., Ales, J. M., & Norcia, A. M. (2011). Disparity-tuned population responses from human visual cortex. The Journal of Neuroscience, 31(3), 954–965.
Cottereau, B. R., Smith, A. T., Rima, S., Fize, D., Héjja-Brichard, Y., Renaud, L., Durand, J.-B. (2017). Processing of Egomotion-Consistent Optic Flow in the Rhesus Macaque Cortex. Cerebral Cortex, 1-14.
Czuba, T. B., Huk, A. C., Cormack, L. K., & Kohn, A. (2014). Area MT encodes three-dimensional motion. Journal of Neuroscience, 34(47), 15522-15533.
Diedrichsen, J., & Shadmehr, R. (2005). Detecting and adjusting for artifacts in fMRI time series data. NeuroImage, 27(3), 624–634.
Dumoulin, S.O. & Wandell, B.A. (2008). Population receptive field estimates in human visual cortex. Neuroimage, 39, 647– 660.
Durand, J. B., Nelissen, K., Joly, O., Wardak, C., Todd, J. T., Norman, J. F., ... & Orban, G. A. (2007). Anterior regions of monkey parietal cortex process visual 3D shape. Neuron, 55(3), 493-505.
Farivar, R. & Vanduffel, W. (2014). Functional MRI of Awake Behaving Macaques Using Standard Equipment. Advanced Brain Neuroimaging Topics in Health and Disease - Methods and Applications.
Felleman, D.J. & Kaas, J.H. (1984). Receptive-field properties of neurons in middle temporal visual area (MT) of owl monkeys. Journal of Neurophysiology,52, 488–513.
Friston, K.J., Fletcher, P., Josephs, O., Holmes, A., Rugg, M.D., & Turner, R. (1998). Event-Related fMRI: Characterizing Differential Responses. Neuroimage, 7, 30-40.
Galletti, C., Battaglini, P. P., & Fattori, P. (1990). ‘Real-motion’ cells in area V3A of macaque visual cortex. Experimental Brain Research, 82(1), 67-76.
Huk, A. C., Dougherty, R. F., & Heeger, D. J. (2002). Retinotopy and functional subdivision of human areas MT and MST. Journal of Neuroscience, 22(16), 7195-7205.
Joo, S. J., Czuba, T. B., Cormack, L. K., & Huk, A. C. (2016). Separate perceptual and neural processing of velocity-and disparity-based 3D motion signals. Journal of Neuroscience, 36(42), 10791-10802.
Kaestner, M., Maloney, R. T., Wailes-Newson, K. H., Bloj, M., Harris, J. M., Morland, A. B., & Wade, A. R. (2019). Asymmetries between achromatic and chromatic extraction of 3D motion signals. Proceedings of the National Academy of
Sciences, 116(27), 13631–13640.
https://doi.org/10.1073/pnas.1817202116
Kay, K.N., Winawer, J., Mezer, A., & Wandell, B.A. (2013). Compressive spatial summation in human visual cortex. Journal of Neurophysiology, 110(2), 481-494.
Kolster, H., Janssens, T., Orban, G. A., & Vanduffel, W. (2014). The retinotopic organization of macaque occipitotemporal cortex anterior to V4 and caudoventral to the middle temporal (MT) cluster. Journal of Neuroscience, 34(31), 10168-10191.
Kolster, H., Mandeville, J. B., Arsenault, J. T., Ekstrom, L. B., Wald, L. L., & Vanduffel, W. (2009). Visual field map clusters in macaque extrastriate visual cortex. Journal of Neuroscience, 29(21), 7031-7039.
Kolster, H., Peeters, R., & Orban, G. A. (2010). The retinotopic organization of the human middle temporal area MT/V5 and its cortical neighbours. Journal of Neuroscience, 30(29), 9801-9820.
Kriegeskorte, N., Simmons, W. K., Bellgowan, P. S., & Baker, C. I. (2009). Circular analysis in systems neuroscience – the dangers of double dipping. Nature Neuroscience, 12(5), 535–540.
Leite, F.P., Tsao, D., Vanduffel, W., Fize, D., Sasaki, Y., Wald, L.L., Dale, A.M., Kwong, K.K., Orban, G.A., Rosen, B.R., Tootell, R.B.H., Mandeville, J.B. (2002). Repeated fMRI using iron oxide contrast agent in awake, behaving macaques at 3Tesla. Neuroimage, 16(2), 283– 294
Li, P., Zhu, S., Chen, M., Han, C., Xu, H., Hu, J., ... & Lu, H. D. (2013). A motion direction preference map in monkey V4. Neuron, 78(2), 376-388.
Likova, L. T., & Tyler, C. W. (2007). Stereomotion processing in the human occipital cortex. Neuroimage, 38(2), 293-305.
Logothetis, N.K. & Wandell, B.A. (2004). Interpreting the BOLD signal. Annual Review of Physiology, 66, 735-769.
Markov, N. T., Ercsey-Ravasz, M. M., Ribeiro Gomes, A. R., Lamy, C., Magrou, L., Vezoli, J., … Kennedy, H. (2014). A weighted and directed interareal connectivity matrix for macaque cerebral cortex. Cerebral Cortex (New York, N.Y.: 1991), 24(1), 17–36. https://doi.org/10.1093/cercor/bhs270
Maunsell JH, Van Essen DC (1983) Functional properties of neurons in middle temporal visual area of the macaque monkey. II. Binocular interactions and sensitivity to binocular disparity. J Neurophysiol 49:1148–1167.
Maunsell, J. H., & Newsome, W. T. (1987). Visual processing in monkey extrastriate cortex. Annual review of neuroscience, 10(1), 363-401.