HAL Id: inserm-00270565
https://www.hal.inserm.fr/inserm-00270565
Submitted on 9 Apr 2008
HAL is a multi-disciplinary open access archive for the deposit and dissemination of sci-entific research documents, whether they are pub-lished or not. The documents may come from teaching and research institutions in France or abroad, or from public or private research centers.
L’archive ouverte pluridisciplinaire HAL, est destinée au dépôt et à la diffusion de documents scientifiques de niveau recherche, publiés ou non, émanant des établissements d’enseignement et de recherche français ou étrangers, des laboratoires publics ou privés.
Bone marrow mesenchymal stem cells are abnormal in
multiple myeloma.
Jill Corre, Karène Mahtouk, Michel Attal, Mélanie Gadelorge, Anne Huynh,
Sandrine Fleury-Cappellesso, Clotaire Danho, Patrick Laharrague, Bernard
Klein, Thierry Rème, et al.
To cite this version:
Jill Corre, Karène Mahtouk, Michel Attal, Mélanie Gadelorge, Anne Huynh, et al.. Bone marrow mesenchymal stem cells are abnormal in multiple myeloma.. Leukemia, Nature Publishing Group: Open Access Hybrid Model Option B, 2007, 21 (5), pp.1079-88. �10.1038/sj.leu.2404621�. �inserm-00270565�
BONE MARROW MESENCHYMAL STEM CELLS ARE ABNORMAL IN MULTIPLE MYELOMA
Corre Jill 1,2, Mahtouk Karène3, Attal Michel4, Gadelorge Mélanie1,5, Huynh Anne4, Fleury Sandrine1,5,
Danho Clotaire4, Laharrague Patrick2, Klein Bernard3, Rème Thierry3 and Bourin Philippe1,5
1.Etablissement Français du Sang Pyrénées-Méditerranée Toulouse ; 2.Laboratoire d'hématologie CHU Rangueil Toulouse ; 3. INSERM U475, Montpellier and CHU Montpellier, Institute of Research in Biotherapy; 4.Service d'hématologie CHU Purpan Toulouse ; 5.Groupe d’Etude des Cellules Souches Mésenchymateuses (GECSOM )
Running title: MULTIPLE MYELOMA MSC ARE ABNORMAL
Author contributions:
CJ and MK performed the experiments and participated in the writing of the paper AM participated in the design of the research and the writing of the paper
GM contributed to new analytical tools and gave technical assistance with the experiments HA collected bone marrow samples and clinical data
FS gave technical assistance with the experiments
DC and LP collected bone marrow samples and clinical data
KB participated in the design of the research and the writing of the paper
RT performed the bio-informatic studies and participated in the writing of the paper BP participated to the design of the research and wrote the paper
Financial support : This study was supported by a grant from the region Midi-Pyrénées
(Programme Multidisciplinaire De Thérapie Génique Et Cellulaire En Midi-Pyrénées), by EFS-PM and by the Ligue Nationale Contre Le Cancer (B. Klein, équipe Labellisée).
Corresponding author : Philippe Bourin, Service de Thérapie Cellulaire, EFS-PM, 75 rue de Lisieux 31300 Toulouse France. Telephone 33 – 534 502 478 Fax 33 – 534 502 470 email
Abstract word count: 199 Text word count: 4503 Scientific heading : Neoplasia
HAL author manuscript inserm-00270565, version 1
HAL author manuscript
Leukemia : official journal of the Leukemia Society of America, Leukemia Research Fund, U.K. 2007;21(5):1079-88
HAL author manuscript inserm-00270565, version 1
HAL author manuscript
Abstract
Recent literature suggested that cell of the microenvironment of solid tumors could be abnormal as well. To address this hypothesis in multiple myeloma (MM), we studied bone marrow mesenchymal stem cells (BMMSCs), the only long-lived cells of the bone marrow microenvironment, by gene expression with Affymetrix arrays and phenotypic and functional study in 3 groups of individuals: patients with MM and those with monoclonal gamopathy of undefined significance (MGUS), and healthy aged-matched subjects. Gene expression profile independently classified the BMMSCs of these individuals in a normal and in a MM group. MGUS BMMSCs were interspersed between those 2 groups. Among the 145 distinct genes differentially expressed in MM and normal BMMSCs 46% were involved in tumor-microenvironment cross-talk. Known soluble factors involved in MM pathophysiologic features, (interleukin (IL)-6, IL-1ß, DKK1 and amphiregulin, were revealed and new ones found. In particular, GDF-15 was found to induce dose-dependant growth of MOLP-6, a stromal cell-dependent myeloma cell line. Functionally, MM BMMSCs induced an over-growth of MOLP-6, and their capacity to differentiate into an osteoblastic lineage was impaired. Thus, BMMSCs from MM patients could create a very efficient niche to support the survival and proliferation of the myeloma stem cells.
Introduction
The tumor-associated microenvironment constitutes a permissive milieu for the induction, selection and expansion of cancer cells1-3. Conversely, neoplastic cells may modify the microenvironment through cell communication proteins, in particular growth factors. Genetic profiling of solid tumors has shown abnormal gene expression in both cancer cells and cells from the microenvironment4. The result is a vicious circle, whereby each cell type contributes to the
growth of the tumor. Elucidating the role of the microenvironment is a major concern in finding ways to disrupt this vicious circle and induce cancer cell apoptosis.
Multiple myeloma (MM) is a B-cell neoplasia that affects 2000 new patients per year in France, 15 000 in Europe and 15 000 in the United States. This disease is still fatal, with a median survival of 4.6 years5,6. MM is characterized by the proliferation of a malignant plasma cell clone, initially located in the bone marrow microenvironment (BMMe). This illness is unique among hematological malignancies in its capacity to cause great bone destruction, leading to pathologic bone fractures and intractable bone pain. This result is the consequence of an imbalance between osteoblastic and osteoclastic activity induced by MM cells7. Impaired osteoblastic function may be
the consequence of a direct action on the osteoblasts, since MM cells enhance their apoptosis8,9. MM cells may also block the differentiation of bone marrow mesenchymal stem cells (BMMSCs) into osteoblasts, by producing the Wnt inhibitors DKK1 or sFRP210,11 or the EGF family member amphiregulin12.
The BMMe is a complex network of extracellular matrix and at least 4 cell partners, namely osteoclasts, mesenchymal cells (BMMSCs and their progeny, osteoblasts, adipocytes), lymphoid cells and endothelial cells. Osteoclasts and endothelial cells were shown to provide efficient support for MM cell survival and proliferation. Indeed, BMMSCs strongly support MM cell growth13, producing a high level of interleukin (IL)-6, a major MM cell growth factor14. BMMSCs also support osteoclastogenesis and angiogenesis15-18. Previous study suggested that the BMMSCs
in MM differ from those of healthy donors19,20. In particular, MM BMMSCs expressed less CD106
and fibronectin and 2.8 times more IL-1ß as compared with normal BMMSCs21 and showed abnormal synthesis of hyaluronan22,23.
Taken together, these data suggest that MM BMMSCs differ from their normal counterparts. To address this question we conducted studies in 3 complementary directions: gene expression profile (GEP) with microarray analysis, and phenotypic and functional studies. We compared 3 groups of individuals: MM patients, patients with monoclonal gamopathy of unknown significance (MGUS) and healthy age-matched subjects. GEP was able to discriminate BMMSCs in MM and healthy subjects, with MGUS BMMSC genes equally distributed between those 2 groups. We found 145 genes and 18 ESTs differentially expressed between normal and MM BMMSCs. Among the 127 genes annotated with Gene Ontology, 46% corresponded to molecules potentially involved in the tumor microenvironment. Functionally, MM BMMSCs were as potent as their normal counterparts in supporting the growth of hematopoietic stem/progenitor cells. They induced an over-growth of a stromal cell-dependent myeloma cell line. Finally, their capacity to differentiate into an osteoblastic lineage was impaired.
Patients, materials and methods Subjects
Bone marrow samples of 22 patients with newly-diagnosed MM and 7 with MGUS were obtained after patients gave written informed consent. We selected 10 patients with stage-I and 12 with stage-III MM. Patients’ characteristics are shown in Table 1. Eleven healthy people who were allogeneic bone marrow donors or were undergoing total hip replacement surgery and gave their informed consent, were also included. These healthy donors had the same age range as the patients with MM.
Cells
Bone marrow from patients was obtained by sternal puncture. Marrow from healthy individuals was obtained from filters used during the preparation of the allogeneic hematopoietic grafts or
from tiny bony fragments obtained during the hip surgery. For the primo-culture (P0), bone marrow cells were cultured (at 5x10⁴ cells/cm²) in αMEM + 10% fetal calf serum + 10 µg/ml of ciprofloxacin used as an antibiotic. After 3 days in culture, nonadherent cells were harvested, and medium was replaced by fresh medium. Then the cultures were fed 2 times a week until confluence or until 21 days. BMMSCs were detached by use of trypsin (InVitrogen, Cergy-Pontoise, France) and counted by use of trypan blue exclusion. They were cultured once, at 103 cells/cm², under the same conditions (first passage, P1). BMMSCs at P0 or P1 were used immediately or frozen until use.
To evaluate the frequency of colony-forming unit-fibroblast (CFU-F), fresh bone marrow cells were seeded at 2x10⁴ cells/cm², P0 cells at 8 cells/cm² and P1 cells at 16 cells/cm² for 11 days as indicated above. Culture vessels were then washed with phosphate-buffered saline, fixed with methanol and stained with Giemsa (Oxoid, Dardilly, France), and colonies with more than 50 cells were counted. The CFU-F expansion at each passage was calculated as the total CFU-F at the end of the culture divided by that at culture start.
CD34+ cells from 2 granulocyte colony stimulating factor (G-CSF)-mobilized patients were purified (90% ± 2% purity) with use of a MACS system (Miltenyi Biotec, Paris, France) according to the manufacturer’s recommendations and frozen until use.
The XG-1 myeloma cell line24 was cultured in RPMI-1640 medium with 10% FCS, ciprofloxacin and IL-6 (2 ng/ml, R&D Systems, Lille, France). The MOLP-6 cell line, a generous gift of Dr. Harashima25, was grown on bone marrow stromal cells in RPMI-1640 with 10% FCS and ciprofloxacin.
Differentiation of BMMSCs into osteoblasts
BMMSCs (after P0 or P1) were seeded at 104 cells/cm² in 96-, 24- or 12-well culture plates in the culture medium plus 0.1 µM dexamethasone and 50 µg/ml ascorbic acid (Sigma, Lyon, France). For mineralization study, 3 mM of inorganic phosphate (Sigma, France) was also added. Medium was changed twice a week. Cultures were stopped after 21 days. Then, alkaline phosphatase
activity was assessed qualitatively and quantitatively by fast violet staining and use of Attophos (Promega, Charbonniéres, France), respectively, and mineralization by von Kossa staining26 and alizarine red staining, as described by Gregory27, respectively.
Co-culture of BMMSCs and CD34+ cells:
P1 frozen BMMSCs were thawed and put in 12-well plates in duplicate at 5000 cells/cm² in 1 ml of culture medium. After 24 h, the wells were emptied, and 4 x 10⁴ CD34+ cells were seeded in each well in 2 mL Myelocult medium containing 10 µM hydrocortisone (Stem Cell Technologies, Grenoble, France). At 7, 14, 21 and 28 days, half of the medium with nonadherent cells was replaced by fresh Myelocult medium with hydrocortisone. The cells in the supernatant were counted and assayed for hematopoietic progenitors in methyl-cellulose (Miltenyi Biotec, France). At the end of the co-culture (day 35), the cells in suspension and adhering to the BMMSCs were assayed for hematopoietic progenitors. The total number of clonogenic progenitors was calculated (number of colonies x total number of cells in the co-culture/number of seeded cells in methyl-cellulose).
Co-Culture of BMMSCs and myeloma cell lines
XG-1: BMMSCs were seeded in 12-well plates in quadruplicate at 11250 cells/cm² in 1 mL of culture medium. After 24 h of culture, the medium was eliminated, and 31250 XG-1 cells were added to each well in 1 ml of RPMI 1640 + 10% FCS. For each sample, 2 of the 4 wells received 10 µg/mL of a neutralizing anti-IL-6 antibody28. For each condition, the number of XG-1 cells was evaluated at days 4 and 7.
MOLP-6: BMMSCs were seeded in 12-well plates in quadruplicate at 11250 cells/cm² in 1 mL of culture medium. After 24 h of culture, the medium was eliminated and 20000 MOLP-6 cells were added in each well in 1 ml of RPMI 1640 + 10% FCS. The number of MOLP-6 cells was evaluated at days 4 and 7.
Flow cytometry
BMMSCs were phenotyped by flow cytometry with FITC- or phycoerythrin-conjugated anti-CD90, anti-CD45, anti-CD13 (Beckman-Coulter, Villepinte, France) and anti-CD73 (Becton-Dickinson, Le Pont de Claix, France) monoclonal antibodies (MoAb). Fluorescence was analyzed with use of a FACScan flow cytometer (Becton-Dickinson).
ELISA
The concentration of the following molecules was evaluated in the culture supernatant of BMMSCs by use of a commercial ELISA kit (R&D systems): IGF-1, IL-1ß, IL-6, GDF-15, SDF-1 and amphiregulin. DKK1 concentration was assessed with use of in-house ELISA with anti-mouse IgG-coated microplates. The capture DKK1 antibody (mouse MoAb to human DKK1, R&D Systems) was incubated for 1 h. After 3 washings, culture supernatants or standards (DKK1 concentrations ranging from 0 to 20 ng/ml) were incubated for 2 h. After 3 washings, the detection antibody (biotinylated goat anti-human DKK1) was incubated for 2 h. After 3 washings, the HRP-labeled streptavidin was added to each well and incubated for 20 min. After 3 additional washings, the substrate was added and incubated for 20 min in the dark, then 50 µl of the stop solution was added and the plate was gently agitated. Optical density was read at 450 nm by use of a microplate reader.
Affymetrix microarrays
At the end of P1, the mRNA of BMMSCs from 7 healthy donors, 5 patients with MGUS and 6 with MM was extracted by use of the RNeasy Kit (Quiagen, Hilden, Germany). Biotinylated cRNA synthesis, hybridization to human U133 plus 2.0 GeneChip microarrays (54,675 probe sets for approximately 39,000 genes) and analysis were performed as previously described12.
Real-time RT-PCR analysis
Complementary DNA was obtained from 2 µg of total RNA with use of Superscript II reverse transcriptase (Life Technologies) and oligo d(T)12-18 (Amersham Pharmacia Biotech, Orsay, France) used as a primer. We used the assay-on-demand primers and probes and the TaqMan Universal Master Mix from Applied Biosystems (Courtaboeuf, France) according to the
manufacturer’s instructions. Gene expression was measured by use of the ABI Prism 7000 Sequence Detection System. For comparative analysis of gene expression, data were obtained by the ΔΔCt method derived from a mathematical approach. For each sample, the CT value for the
gene of interest was determined, normalized to its respective CT value for GAPDH (ΔCT = CT –
CT GAPDH) and compared to one BMMSC sample used as a positive control. The formula used
was: ½ΔCT sample - ΔCT control cell line. Ct values were collected during the log phase of the cycle. The results were expressed as the relative mRNA level to control cell mRNA.
Statistical analysis
Scanned data were uploaded in our bioinformatics facility. Probesets that were not expressed in at least one sample, using the Absent/Present “Call detection” algorithm (MAS5 software from Affymetrix29), were discarded. To compare normal and MM BMMSCs, we performed an unsupervised classification with both principal component analysis (PCA) and hierarchical clustering 30. The principal component analysis involved original scripts based on the R statistics
software through the RAGE bioinformatics facility (http://rage.montp.inserm.fr). In a two-scale representation, the separation between groups was indicated by the angle between sample vectors, which must be the smallest among classes for homogeneity but the highest between classes to ensure the best separation. Hierarchical clustering involved use of the Cluster and TreeView softwares (http://rana.lbl.gov/EisenSoftware.htm). GEP were analyzed with use of RAGE and confirmed with the Significance Analysis of Microarrays (SAM) software (http://www-stat.stanford.edu/~tibs/SAM/). Statistical comparisons involved the Mann-Whitney test, Kruskall-Wallis ANOVA, Spearman correlation and Student’s t-test (CSS Statistica, Statsoft, Maisons-Alfort, France).
Results
BMMSC phenotype, growth characteristics and hematopoietic support
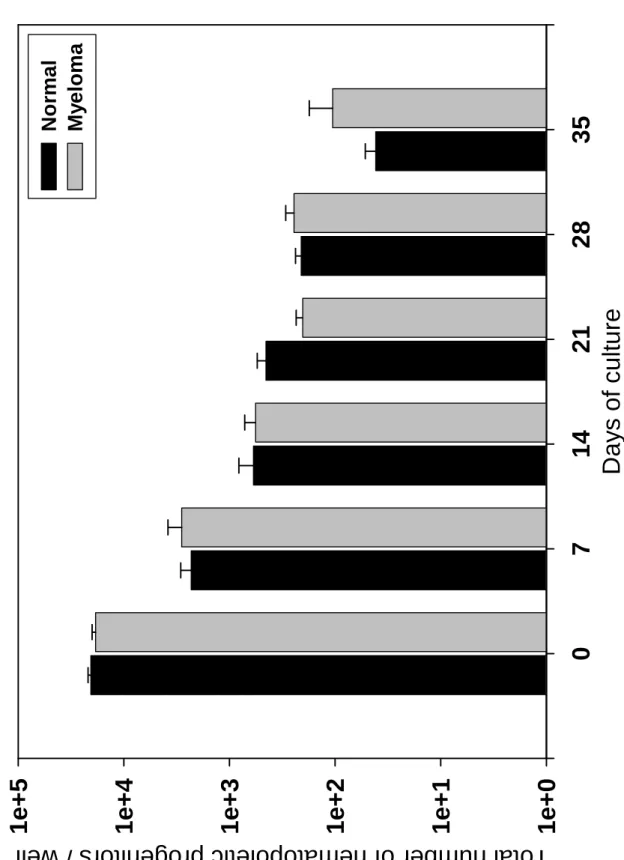
BMMSCs from 11 healthy donors were compared to those from 22 MM patients (10 stage I and 12 stage III). Normal and MM BMMSCs expressed the same density of CD13, CD73, and CD90 but lacked CD45 (results not shown). Because the BMMSC proliferation is correlated with age of donors, we chose normal donors who were age matched with the MM patients (Table 1). The CFU-F concentration in bone marrow did not differ between healthy donors and patients with MM, between patients with stage I or stage III MM, or between patients with or without bone lesions (Table 2). Cell density in the cultures at P0 and P1 did not differ among groups. However, CFU-F expansion was significantly reduced at the end of P0 for MM BMMSCs as compared to normal BMMSCs (1934-fold ± 512 vs. 5588-fold ± 2175, respectively, P = 0.048). No difference in CFU-F expansion at P0 was found between patients with stage I or stage III MM or patients with or without bone lesions (Table 2). BMMSCs from MGUS patients showed growth characteristics similar to those of MM patients. MM and normal BMMSCs did not differ significantly in their long-term ability to support hematopoietic stem/progenitor cell growth. As shown in Figure 1, the total number of GM-CFU generated in the cultures did not significantly differ when either normal or MM BMMSCs were used as hematopoietic stem cell support. Finally, MM BMMSCs did not carry the chromosome abnormalities found in MM cells by FISH (results not shown).
Genetic expression profiles distinguish normal BMMSCs from MM BMMSCs.
The genetic profile of 7 BMMSCs from normal donors, 6 BMMSCs from patients with stage III MM and 5 BMMSCs from MGUS patients was determined with Affymetrix U133 2 plus microarray (55000 probesets). We chose stage III MM patients to maximize the potential differences with use of normal subjects. Unsupervised analysis by PCA and hierarchical clustering first involved only normal and MM BMMSCs, with 2008 probesets expressed at least once (Present call) in all the samples and a high variation coefficient (≥ 60%) between samples. Both unsupervised analyses delineated 2 homogeneous clusters of genes: an MM BMMSC and a normal
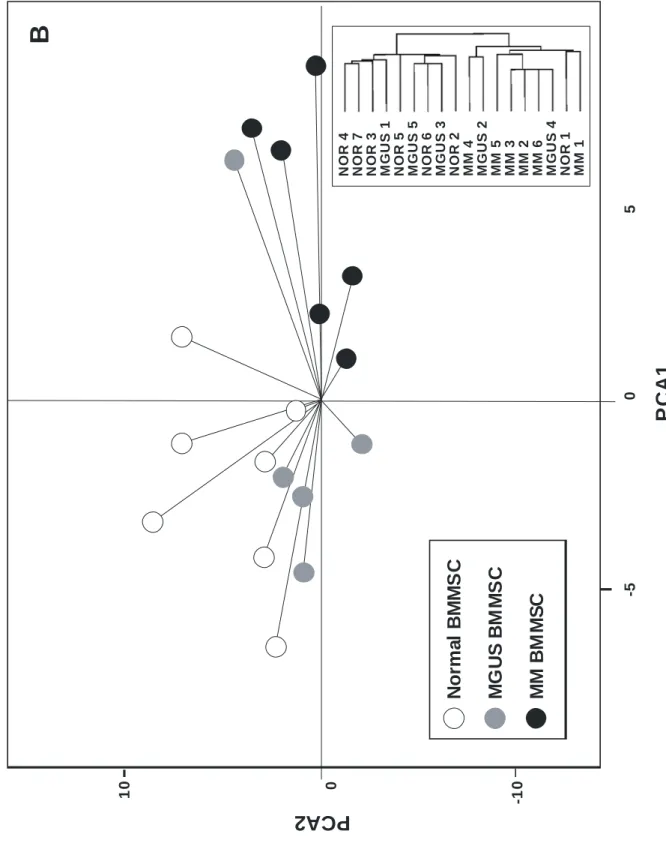
BMMSC cluster (Fig. 2A). When MGUS BMMSCs were considered, MGUS BMMSCs interspersed between the “MM cluster” and the “normal cluster” (Fig. 2B). These results suggest that microarrays could pinpoint differences between MM and normal BMMSCs.
Comparison of gene expression between malignant and normal BMMSCs
We then used supervised analysis to investigate genes differentially expressed between the MM and normal BMMSCs. Signal data from the 2 classes were filtered according to the ratio of the means of expression values in each sample group and a Mann-Whitney non-parametric rank test as previously described31. A total of 183 probesets was differentially expressed between normal and MM BMMSCs (at least one presence, ratio of means of expression ≥ 2 or ≤ 0.5, P ≤ 0.01). Among them, 103 showed high expression in the MM BMMSCs. We also performed a supervised analysis using SAM software on the same samples with one-presence and 2-ratio filters and 100 permutations, which resulted in a list of 255 probesets, with a false discovery rate of 7.6%. This list encompassed all of the 183 (100%) probesets selected through the first supervised comparison. This 183 probeset list is available as supplementary Table I and represents 145 distinct genes and 18 ESTs (163 genes/ESTs). 20 noteworthy genes are shown in Table 3. A total of 79 genes/ESTs were overexpressed in MM BMMSCs. Use of Gene Ontology annotation with the Fatigo platform
(http://fatigo.bioinfo.cnio.es/) allowed annotating 127 of these 163 genes/ESTs. Of note, 46% (59
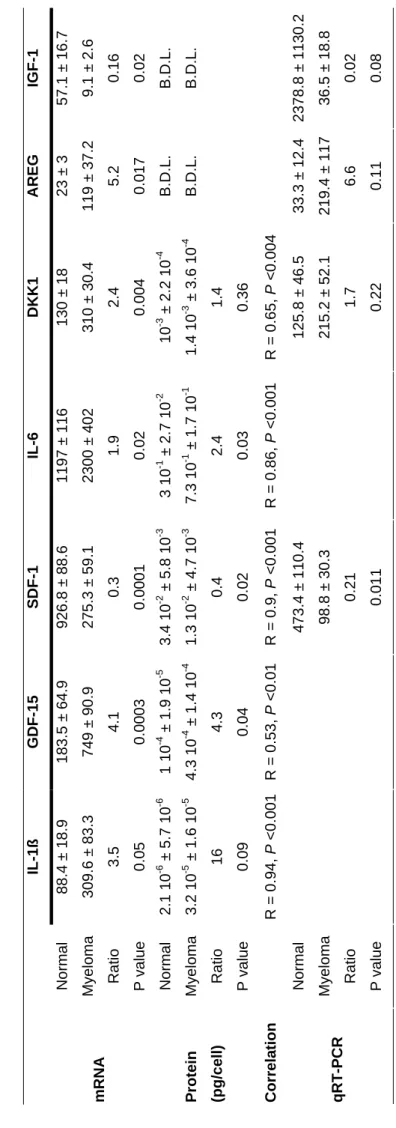
out of 127) were classified in a “tumor environment” category (Figure 3). These 46% tumor-environment genes encode for cell communication proteins (27%), receptor signalization molecules (11%) and extracellular matrix or secreted molecules (9%). The other functions were metabolism, nuclear function, cytoskeleton, protein synthesis, cell cycle, and apoptosis (Figure 3). Some of these genes encode for growth factors reported to be involved in MM. Three examples are amphiregulin (AREG), a member of the EGF family, and IL-1ß, which were overexpressed in MM BMMSCs as compared to normal BMMSCs, in a ratio of 2.8 and 3.5, respectively. These data were validated at the mRNA level by real-time RT-PCR (Table 4). We performed validation at the protein level by ELISA. Although IL-1ß secretion was 16 times higher for MM BMMSCs, the
difference was not significant, probably because of the low number of samples studied and the low level of secretion. AREG concentration was under the sensibility threshold for our ELISA test. The
DKK1 mRNA level was increased by 2.4 times in MM BMMSCs and the protein was increased by
1.4 times in the culture supernatant. Two other examples are IGF-1 and SDF-1, which were underexpressed in MM BMMSCs as compared to normal BMMSCs, in a ratio of 5.5 and 3, respectively. Data were validated with real-time RT-PCR. In addition, the concentration of SDF-1 in the supernatant of MM BMMSCs represented 40% of the level found in normal BMMSC supernatant. The level of secreted IGF-1 was under the sensitivity threshold of our ELISA test. We also discovered some genes never described in MM, such as growth and differentiation factor-15 (GDF-factor-15), increased in MM BMMSCs. Both GDF-factor-15 mRNA and secreted protein levels were 4-fold higher in MM BMMSCs as compared to normal BMMSCs (Table 4). The effect of GDF15 was tested on the growth of the stromal cell-dependent MOLP-6 myeloma cells. Without the addition of stromal cells, MOLP-6 cells progressively underwent apoptosis. GDF-15 could replace stromal cells, supporting long term MOLP-6 growth in a dose-dependent manner (P = 0.04) (Fig. 4). A concentration of 100 ng/ml of GDF15 increased 3 fold the MOLP-6 cell number in 5 day cultures. GDF15 had no effect on XG-1 cell line even associated with a suboptimal dose of IL-6. We also tested the concentration of IL-6 in culture supernatant, because this molecule is important in MM pathophysiologic features and its mRNA level is increased in BMMSCs, although the level (1.9) did not reach our limit of two-fold increase. MM BMMSCs produced larger amounts of IL-6 than normal BMMSCs, with good correlation between the IL-6 mRNA level measured by microarray and the IL-6 concentration produced by BMMSCs in vitro (Table 4).
Increased proliferation of the MOLP-6 myeloma cell line cocultured with MM BMMSCs as compared to normal BMMSCs
Because normal BMMSCs have a distinct genetic profile as compared with MM BMMSCs, we investigated their ability to support MM cell growth using the MOLP-6 stromal cell-dependent myeloma cell line and the XG-1 stromal cell-independent but IL-6-dependent cell line. Of interest,
MM BMMSCs supported MOLP-6 better than normal BMMSCs after 7 days of culture (3.3 ± 0.4-fold vs. 2.2 ± 0.3-0.4-fold amplification, P = 0.04). This effect could be due to GDF15 that is highly produced by MM BMMSCs compared to normal ones. But we could not investigate it directly because no commercially available anti-GDF15 antibodies are available presently. The proliferation of the stromal cell-independent but IL-6-dependent XG-1 myeloma cells was supported equally efficiently by normal and MM BMMSCs (Table 5) and was abrogated by adding an anti-IL-6 monoclonal antibody. Although MM BMMSCs produced higher amounts of IL-6 than normal BMMSCs, this lack of difference in supporting XG-1 growth is understandable because normal BMMSCs produced enough IL-6 (Table 4) to induce maximal proliferation of XG-1 cells that are highly sensitive to IL-6 .
BMMSC osteoblastic differentiation
Because osteoblastic function is impaired in advanced myeloma, we checked the differentiation of BMMSCs into the osteoblastic lineage. Because qualitative assessment of phosphatase activity did not differ between normal and MM BMMSCs (data not shown), we used a quantitative technique to measure phosphatase activity. After 21 days of differentiation culture, the activity ratio for normal BMMSCs did not differ significantly from that of MM BMMSCs (2.5 ± 0.3 vs. 3 ± 0.5). However, matrix mineralization of MM BMMSCs, as assessed by von Kossa staining, was qualitatively less abundant than that obtained with normal BMMSCs (Fig. 5). To assess this difference, we quantified matrix mineralization for 2 normal and 3 MM BMMSCs, with a striking reduction in matrix mineralization revealed for MM BMMSCs (Fig. 5).
Discussion
The aim of this study was to investigate the differences in BMMSCs from normal donors and from patients with newly-diagnosed myeloma. The bone marrow of MM patients showed a normal frequency of CFU-F, whose expansion ability was reduced in 6-week cultures. The ability to support the growth of hematopoietic stem cells did not differ between normal and MM BMMSCs.
A remarkable finding is that MM BMMSCs had a distinctive GEP on microarray analysis. Indeed 2 unsupervised methods could classify genes in BMMSCs from MM patients into an MM cluster and those from normal age-related donors into a normal cluster. Even more remarkable is that these BMMSCs had been allowed to expand for 6 weeks in culture, with about 16 to 20 doublings, still retaining this specific gene signature. Although study of solid tumors has shown cells from a microenvironment to keep their specific features even after culture32, such findings have not yet been reported for hematopoietic cancers.
Our data suggest that mesenchymal stem cells in the bone marrow of MM patients differed from normal cells and that these differences were retained throughout the expansion culture. This difference may be due to a selection by the malignant clone of a mesenchymal stem cell subpopulation in vivo that may favor the malignant plasma cell growth. We cannot exclude genetic abnormalities occurring in the patients’ mesenchymal stem cells themselves, but no gross abnormalities could be found by conventional genetic analysis. Finally, this specific MM BMMSC genetic profile could be characteristic of a population at increased risk for monoclonal gamopathy. Of note, genes for MGUS BMMSCs could be classified into normal or MM clusters. Of major interest is investigating whether patients with MGUS with a MM-specific BMMSC genetic profile are at increased risk for MM.
145 genes were differentially expressed between normal and MM BMMSCs. Study of their ontology revealed that almost half may participate in the support of malignant plasma cells; thus, we called them “tumor microenvironment” genes. The cell communication molecules represented 27% of the genes and are likely involved in the association with myeloma cells. The factors IL-1ß, IGF-1, SDF-1, AREG, IL-6, and DKK1 had already been described to play a role in the biology of myeloma33. Bone marrow myeloma cells produce the pro-inflammatory cytokine IL-1ß, which contributes to the high IL-6 production in the MM tumor environment. However, controversy has surrounded the IL-1 producer cells in MM34-36. Here we show that the expression of IL-1ß in
BMMSCs is, on average, 3.5-fold higher in MM BMMSCs as compared to normal BMMSCs21.
AREG, a member of the EGF family, is overexpressed in MM BMMSCs. We have previously shown that AREG is expressed by myeloma cells and can be both an autocrine factor for the myeloma cells themselves and a paracrine factor, stimulating the production of IL-6 by the BMMSCs12. Thus, the expression of AREG, at the same time by the cells of microenvironment and the malignant plasma cells, could ensure the survival of the tumor cells. Of note, IGF-1, a major myeloma growth factor37, was underexpressed in MM BMMSCs as compared to normal BMMSCs and was weakly expressed in MM and normal samples, which suggests that IGF-1 may be secreted by other cells in MM. We also observed an underexpression of SDF-1 at the mRNA and protein level in MM BMMSCs, which demonstrates that BMMSCs are not responsible for increased SDF-1 concentration observed in MM. In agreement with this finding, Zanettino showed that SDF-1 was secreted by MM cells themselves and it supports the mobility and activation of osteoclasts38. The gene coding for IL-6, a major MM cell growth factor (ref 14), was also significantly overexpressed in MM BMMSCs as compared to normal BMMSCs, but at a ratio below 2 (Table 4). Regarding IL-6 protein, MM BMMSCs produced twice more IL-6 than normal BMMSCs, with good correlation between RNA and protein data. MM BMMSCs secreted high levels of IL-6, about 0.5 pg/cell, approximately 20-fold higher than that reported by Wallace21.
DKK1, coding for another remarkable inhibitor of the Wnt pathway in MM, was also significantly
overexpressed in MM BMMSCs. Gregory et al. demonstrated that DKK1 is secreted by BMMSCs and enhances their proliferation39. As well, Tian et al. found that DKK1 could be secreted by MM cells and the increased secretion was associated with the early stage of osteolytic lesions10. The
authors demonstrated that DKK1 inhibits osteoblastic differentiation of C2C12 cell lines. Recently, Gunn et al. showed that DKK1 could enhance IL-6 secretion by osteoblasts40. We have confirmed DKK1 secretion by MM and normal BMMSCs.
Of interest, we also identified genes coding for proteins that have never been directly implied in MM. One group could be, in part, responsible for the development of angiogenesis by increasing the imbalance between the pro- and anti-angiogenic factors41. Angiopoietin-like 4 (ANGPTL4),
plasminogen activator inhibitor 1 (PAI-1) and secretrogranin II (SCG2) were overexpressed 4.5, 2.6 and 2.6 times, respectively, by the MM BMMSCs. ANGPTL4 is an angiogenic factor, independent of VEGF, whose production is mediated by PPAR-gamma42. PAI-1 has been reported to control key aspects of angiogenesis and, in turn, tumor progression through its anti-proteolytic activity43. Stromal cell production of PAI-1 has been reported to be more important for its action than cancer cell production44. SCG2 belongs to a family of the chromogranins and is the precursor of secretoneurin, which is both a pro-angiogenic and a chemotactic factor for monocytes and endothelial cells45. In vivo, secretoneurin mobilizes the endothelial progenitors and supports their integration in the newly formed vessels. IL-17D, recently discovered, belongs to a family of inflammatory cytokines, which includes 6 members (IL-17A to IL-17F). We found that the MM BMMSCs overexpressed IL-17D. IL-17D induces the secretion of IL-6 by endothelial cells and inhibits, in vitro, the proliferation of the myeloid progenitors46. Another group of molecules, underexpressed by MM BMMPCs as compared to normal BMMSCs, are involved in bone physiology and may explain in part the osteoblast anomalies. We observed a 3.6-, 3- and 2-fold decrease in mRNA expression of the C receptor of natriuric peptide (NPR3), Wnt-1-induced secreted protein 1 (WISP-1) and endothelial differentiation gene 2 (EDG2), respectively. NPR3 is considered responsible for the clearance of the ANPs and thus, the modulation of their effects. NPR3-knockout mice show abnormalities of the skeleton, in particular a defect of endochondral ossification47. WISP-1 belongs to the CCN family and has been shown to support BMP-2-induced osteoblastic differentiation48. In vivo, in a model of fracture, WISP-1 is expressed in mesenchymal
cells that surround the site of the injury. EDG2 is one receptor for lysophosphatidic acid (LPA), which is involved in osteoblast proliferation and prevents their apoptosis.49,50 EDG2 mutant mice displayed skeletal anomalies51.
Finally, we have shown for the first time, both at the mRNA and protein level, that GDF15 expression was higher in MM BMMSCs than in normal BMMSCs and that GDF15 is a novel MM cell growth factor, supporting the growth of the MOLP-6 stromal cell-dependant myeloma cell
line. GDF-15 is a divergent member of the TGFß superfamily52. In normal human subjects, it is highly expressed in the placenta and its serum concentration increases during pregnancy53. GDF15 concentration is increased in the serum of patients with prostate, colorectal or pancreatic cancers
54-56 and was recently described as one of the 20 best biomarkers of numerous tumours57. In vitro,
GDF15 prevents the apoptosis of cerebellar granule neurons via the PI3K/Akt pathway58 or induces apoptosis and inhibits the proliferation of several tumor cell lines55. Interestingly, the 2 MGUS BMMSCs located in the “myeloma cluster” on genetic profiling secreted twice more GDF-15 than the 3 MGUS BMMSCs located in the “normal cluster”.
In agreement with the GEP of normal and MM BMMSCs, the 2 cell populations also showed functional differences. (i) MM BMMSCs showed a reduced matrix mineralization capability, which might be linked to the DKK1 upregulation in those cells as compared to normal BMMSCs and the downregulation of WISP-1, NPR3 and EDG-2. (ii) MM BMMSCs can support the growth of the stromal cell-dependant myeloma cell line MOLP-6 better than the normal and MGUS BMMSCs. We could not investigate whether GDF15 was involved in part in this effect because no neutralizing anti-GDF15 antibody is commercially available.
In conclusion, our study reveals that BMMSCs from patients with MM show a specific gene expression profile, with an overexpression of genes coding for proteins involved in MM cell growth, angiogenesis, and osteoblast differentiation. Thus, these BMMSCs could create a very efficient niche to support the survival and proliferation of the myeloma stem cells and protect them from chemotherapy-induced apoptosis.
References :
1 Liotta LA, Kohn EC. The microenvironment of the tumour-host interface. Nature. 2001;411:375-379
2 Bhowmick NA, Neilson EG, Moses HL. Stromal fibroblasts in cancer initiation and progression. Nature. 2004;432:332-337
3 Maffini MV, Soto AM, Calabro JM, Ucci AA, Sonnenschein C. The stroma as a crucial target in rat mammary gland carcinogenesis. J Cell Sci. 2004;117:1495-1502
4 Allinen M, Beroukhim R, Cai L, et al. Molecular characterization of the tumor microenvironment in breast cancer. Cancer Cell. 2004;6:17-32
5 Attal M, Harousseau JL, Stoppa AM, et al. A prospective, randomized trial of autologous bone marrow transplantation and chemotherapy in multiple myeloma. Intergroupe Francais du Myelome. N Engl J Med. 1996;335:91-97
6 Attal M, Harousseau JL, Facon T, et al. Single versus double autologous stem-cell transplantation for multiple myeloma. N Engl J Med. 2003;349:2495-2502
7 Berenson JR. Myeloma bone disease. Best Pract Res Clin Haematol. 2005;18:653-672
8 Silvestris F, Cafforio P, Tucci M, Grinello D, Dammacco F. Upregulation of osteoblast apoptosis by malignant plasma cells: a role in myeloma bone disease. Br J Haematol. 2003;122:39-52 9 Silvestris F, Cafforio P, Calvani N, Dammacco F. Impaired osteoblastogenesis in myeloma bone
disease: role of upregulated apoptosis by cytokines and malignant plasma cells. Br J Haematol. 2004;126:475-486
10 Tian E, Zhan F, Walker R, et al. The role of the Wnt-signaling antagonist DKK1 in the development of osteolytic lesions in multiple myeloma. N Engl J Med. 2003;349:2483-2494 11 Oshima T, Abe M, Asano J, et al. Myeloma cells suppress bone formation by secreting a soluble
Wnt inhibitor, sFRP-2. Blood. 2005;106:3160-3165
12 Mahtouk K, Hose D, Reme T, et al. Expression of EGF-family receptors and amphiregulin in multiple myeloma Amphiregulin is a growth factor for myeloma cells. Oncogene. 2005;24:3512-3524
13 Uchiyama H, Barut BA, Mohrbacher AF, Chauhan D, Anderson KC. Adhesion of human myeloma-derived cell lines to bone marrow stromal cells stimulates interleukin-6 secretion. Blood. 1993;82:3712-3720
14 Klein B, Zhang XG, Lu ZY, Bataille R. Interleukin-6 in human multiple myeloma. Blood. 1995;85:863-872
15 Gupta D, Treon SP, Shima Y, et al. Adherence of multiple myeloma cells to bone marrow stromal cells upregulates vascular endothelial growth factor secretion: therapeutic applications. Leukemia. 2001;15:1950-1961
16 Michigami T, Shimizu N, Williams PJ, et al. Cell-cell contact between marrow stromal cells and myeloma cells via VCAM-1 and alpha(4)beta(1)-integrin enhances production of osteoclast-stimulating activity. Blood. 2000;96:1953-1960
17 Barille-Nion S, Barlogie B, Bataille R, et al. Advances in biology and therapy of multiple myeloma. Hematology. 2003;:248-278
18 Hayashi T, Hideshima T, Anderson KC. Novel therapies for multiple myeloma. Br J Haematol. 2003;120:10-17
19 Gregoretti MG, Gottardi D, Ghia P, et al. Characterization of bone marrow stromal cells from multiple myeloma. Leuk Res. 1994;18:675-682
20 Caligaris-Cappio F, Bergui L, Gregoretti MG, et al. Role of bone marrow stromal cells in the growth of human multiple myeloma. Blood. 1991;77:2688-2693
21 Wallace SR, Oken MM, Lunetta KL, Panoskaltsis-Mortari A, Masellis AM. Abnormalities of bone marrow Mesenchymal stem cells in multiple myeloma patients. Cancer. 2001;91:1219-1230
22 Calabro A, Oken MM, Hascall VC, Masellis AM. Characterization of hyaluronan synthetase expression and hyaluronan synthesis in bone marrow mesenchymal progenitor cells: predominant expression of HAS1 mRNA and up-regulated hyaluronan synthesis in bone marrow cells derived from multiple myeloma patients. Blood. 2002;100:2578-2585
23 Vincent T, Jourdan M, Sy MS, Klein B, Mechti N. Hyaluronic acid induces survival and proliferation of human myeloma cells through an interleukin-6-mediated pathway involving the phosphorylation of retinoblastoma protein. J Biol Chem. 2001;276:14728-14736
24 Zhang XG, Gaillard JP, Robillard N, et al. Reproducible obtaining of human myeloma cell lines as a model for tumor stem cell study in human multiple myeloma. Blood. 1994;83:3654-3663 25 Harashima A, Matsuo Y, Nishizaki C, et al. Human bone marrow stroma-dependent myeloma
sister cell lines MOLP-6 and MOLP-7 derived from a patient with multiple myeloma. Human Cell. 2000;13:43-54
26 Schecroun N, Delloye Ch. In vitro growth and osteoblastic differentiation of human bone marrow stromal cells supported by autologous plasma. Bone. 2004;35:517-524
27 Gregory CA, Gunn WG, Peister A, Prockop DJ. An Alizarin red-based assay of mineralization by adherent cells in culture: comparison with cetylpyridinium chloride extraction. Anal Biochem. 2004;329:77-84
28 Wijdenes J, Clement C, Klein B, et al. Human recombinant dimeric IL-6 binds to its receptor as detected by anti-IL-6 monoclonal antibodies. Mol Immunol. 1991;28:1183-1192
29 Liu WM, Mei R, Di X, et al. Analysis of high density expression microarrays with signed-rank call algorithms. Bioinformatics. 2002;18:1593-1599
30 Eisen MB, Spellman PT, Brown PO, Botstein D. Cluster analysis and display of genome-wide expression patterns. Proc Natl Acad Sci U S A. 1998;95:14863-14868
31 Tarte K, Zhan F, De Vos J, Klein B, Shaughnessy J Jr. Gene expression profiling of plasma cells and plasmablasts: toward a better understanding of the late stages of B-cell differentiation. Blood. 2003;102:592-600
32 Hu M, Yao J, Cai L, et al. Distinct epigenetic changes in the stromal cells of breast cancers. Nat Genet. 2005;37:899-905
33 De Vos J, Hose D, Reme T, et al. Microarray-based understanding of normal and malignant plasma cells. Immunol Rev. 2006;210:86-104
34 Lacy MQ, Donovan KA, Heimbach JK, Ahmann GJ, Lust JA. Comparison of interleukin-1 beta expression by in situ hybridization in monoclonal gammopathy of undetermined significance and multiple myeloma. Blood. 1999;93:300-305
35 Borset M, Helseth E, Naume B, Waage A. Lack of IL-1 secretion from human myeloma cells highly purified by immunomagnetic separation. Br J Haematol. 1993;85:446-451
36 Costes V, Portier M, Lu ZY, Rossi JF, Bataille R, Klein B. Interleukin-1 in multiple myeloma: producer cells and their role in the control of IL-6 production. Br J Haematol. 1998;103:1152-1160
37 Ferlin M, Noraz N, Hertogh C, Brochier J, Taylor N, Klein B. Insulin-like growth factor induces the survival and proliferation of myeloma cells through an interleukin-6-independent transduction pathway. Br J Haematol. 2000;111:626-634
38 Zannettino AC, Farrugia AN, Kortesidis A, et al. Elevated serum levels of stromal-derived factor-1alpha are associated with increased osteoclast activity and osteolytic bone disease in multiple myeloma patients. Cancer Res. 2005;65:1700-1709
39 Gregory CA, Singh H, Perry AS, Prockop DJ. The Wnt signaling inhibitor dickkopf-1 is required for reentry into the cell cycle of human adult stem cells from bone marrow. J Biol Chem. 2003;278:28067-28078
40 Gunn WG, Conley A, Deininger L, Olson SD, Prockop DJ, Gregory CA. A Crosstalk between Myeloma Cells and Marrow Stromal Cells Stimulates Production of DKK1 and IL-6: A Potential Role in the Development of Lytic Bone Disease and Tumor Progression in Multiple Myeloma. Stem Cells. 2005;24:986-991
41 Giuliani N, Colla S, Rizzoli V. Angiogenic switch in multiple myeloma. Hematology. 2004;9:377-381
42 Le Jan S, Amy C, Cazes A, et al. Angiopoietin-like 4 is a proangiogenic factor produced during ischemia and in conventional renal cell carcinoma. Am J Pathol. 2003;162:1521-1528
43 Bajou K, Maillard C, Jost M, et al. Host-derived plasminogen activator inhibitor-1 (PAI-1) concentration is critical for in vivo tumoral angiogenesis and growth. Oncogene. 2004;23:6986-6990
44 Maillard C, Jost M, Romer MU, et al. Host plasminogen activator inhibitor-1 promotes human skin carcinoma progression in a stage-dependent manner. Neoplasia. 2005;7:57-66
45 Reinisch N, Kirchmair R, Kahler CM, et al. Attraction of human monocytes by the neuropeptide secretoneurin. FEBS Lett. 1993;334:41-44
46 Starnes T, Broxmeyer HE, Robertson MJ, Hromas R. Cutting edge: IL-17D, a novel member of the IL-17 family, stimulates cytokine production and inhibits hemopoiesis. J Immunol. 2002;169:642-646
47 Jaubert J, Jaubert F, Martin N, et al. Three new allelic mouse mutations that cause skeletal overgrowth involve the natriuretic peptide receptor C gene (Npr3). Proc Natl Acad Sci U S A. 1999;96:10278-10283
48 French DM, Kaul RJ, D'Souza AL, et al. WISP-1 is an osteoblastic regulator expressed during skeletal development and fracture repair. Am J Pathol. 2004;165:855-867
49 Grey A, Banovic T, Naot D, et al. Lysophosphatidic acid is an osteoblast mitogen whose proliferative actions involve G(i) proteins and protein kinase C, but not P42/44 mitogen-activated protein kinases. Endocrinology. 2001;142:1098-1106
50 Grey A, Chen Q, Callon K, Xu X, Reid IR, Cornish J. The phospholipids sphingosine-1-phosphate and lysophosphatidic acid prevent apoptosis in osteoblastic cells via a signaling pathway involving G(i) proteins and phosphatidylinositol-3 kinase. Endocrinology. 2002;143:4755-4763
51 Contos JJ, Fukushima N, Weiner JA, Kaushal D, Chun J. Requirement for the lpA1 lysophosphatidic acid receptor gene in normal suckling behavior. Proc Natl Acad Sci U S A. 2000;97:13384-13389
52 Böttner M, Suter-Crazzolara C, Schober A, Unsicker K. Expression of a novel member of the TGF-beta superfamily, growth/differentiation factor-15/macrophage-inhibiting cytokine-1 (GDF-15/MIC-1) in adult rat tissues. Cell Tissue Res. 1999;297:103-110
53 Moore AG, Brown DA, Fairlie WD, et al. The transforming growth factor-ss superfamily cytokine macrophage inhibitory cytokine-1 is present in high concentrations in the serum of pregnant women. J Clin Endocrinol Metab. 2000;85:4781-4788
54 Koopmann J, Buckhaults P, Brown DA, et al. Serum macrophage inhibitory cytokine 1 as a marker of pancreatic and other periampullary cancers. Clin Cancer Res. 2004;10:2386-2392 55 Bauskin AR, Brown DA, Junankar S, et al. The propeptide mediates formation of stromal stores
of PROMIC-1: role in determining prostate cancer outcome. Cancer Res. 2005;65:2330-2336 56 Brown DA, Ward RL, Buckhaults P, et al. MIC-1 serum level and genotype: associations with
progress and prognosis of colorectal carcinoma. Clin Cancer Res. 2003;9:2642-2650
57 Basil CF, Zhao Y, Zavaglia K, et al. Common cancer biomarkers. Cancer Res. 2006;66:2953-2961
58 Subramaniam S, Strelau J, Unsicker K. Growth differentiation factor-15 prevents low potassium-induced cell death of cerebellar granule neurons by differential regulation of Akt and ERK pathways. J Biol Chem. 2003;278:8904-8912
Table 1 : Subjects’ characteristics Multiple myeloma n=22 MGUS n=7 Healthy persons n=11 Age, yr + SEM 61±11 62±13 58±11 Sex (% Male) 58% 30% 60% Disease stage I = 10 III = 12
Bone lesions Absence = 11
Presence = 11
Table 2 : BMMSC grow th culture characteris tics Normal don ors M GUS pa tie nts MM patien ts All Stage I Stage III w ithou t bon e lesions w
ith bone lesions
Number of subjects 11 7 22 10 12 11 11 CFU-F Fr equ e nc y Bone marrow 69.8 ± 15.8 59.4 ± 7.9 57.7 ± 9.6 55.8 ± 13.3 59.3 ± 14. 1 64.6 ± 14.9 50.9 ± 12.5 Primo-culture 0.22 ± 0.04 0.21 ± 0.06 0.18 ± 0.03 0.22 ± 0.05 0.14 ± 0. 03 0.2 ± 0.05 0.15 ± 0.04 1st passa ge 0.11 ± 0.03 0.04 ± 0.01 0.05 ± 0.01 0.05 ± 0.01 0.06 ± 0. 03 0.04 ± 0.01 0.07 ± 0.03 Cell densities Primo-culture 3 10 4 ± 4.5 10 3 2.2 10 4 ± 4.7 10 3 2.4 10 4 ± 4.2 10 3 2 10 4 ± 4.7 10 3 2.8 10 4 ± 6.8 10 3 2.4 10 4 ± 5.6 10 3 2.5 10 4 ± 6.6 10 3 1st passa ge 2.6 10 4 ± 3.3 10 3 28.9 10 4 ± 6.4 10 3 2.3 10 4 ± 3.4 10 3 2.5 10 4 ± 5.6 10 3 2.2 10 4 ± 4.3 10 3 2.5 10 4 ± 5.1 10 3 2.2 10 4 ± 4.8 10 3 CFU-F e x pa nsions Primo-culture 5.6 10 3 ± 2.2 10 3 1.7 10 3 ± 0.6 10 3 1.9 10 3 ± 0.5 10 3 § 1.8 10 3 ± 0.5 10 3 2 10 3 ± 0.8 10 3 1.7 10 3 ± 0.5 10 3 2.2 10 3 ± 0.9 10 3 1st passa ge 15.5 ± 6.7 3.9 ± 2.3 6.9 ± 1.8 7.5 ± 2.1 6.4 ± 3 6.6 ± 2 7.3 ± 3.3
All data are expressed as
m
ean
± stan
dard error of the m
ean
CFU-F frequencies in b
one m
arrow are exp
ressed as colon ies/10 6 cells § different from the m ea
n value with norm
al donors ( P = .048 with a Student’s t-t est 24
Table 3 : Differentially notew orthy expressed genes
Ge
nB
an
k
G
en
e
R
atio
Loc
aliz
ation
D
es
cr
iption
G
en
e o
ver
exp
re
ss
ed
in
MM B
M
MS
C
NM _001657 AR EG 5. 2 4q13-q21 am phi re gul in (s chw ann om a-de riv ed gro w th f ac to r) NM _016109 AN G P T L4 4. 5 19p13 .3 angi opo ie tin-l ik e 4 AF 003934 GD F15 4. 1 19p13 .1-13. 2 gro w th d iff er en tia tio n fa ct or 15 NM _002575 SE R P IN B 2 4 18q21 .3 se rpi n pe pt id as e i nhi bi to r; c la de B (o va lbum in ); m em be r 2 AF 063591 CD20 0 3. 2 3q12-q13 CD20 0 a nt ige n NM _000576 IL1B 2. 9 2q14 in te rle uk in 1 ; be ta NM _003469 SC G 2 2. 6 2q35-q36 se cr et ogra ni n I I (c hr om og ra ni n C ) AL574210 SE R P IN E 1 2. 6 7q21. 3-q 22 pl as m in og en a ct iv at or i nhi bi to r ty pe 1 AI 093492 DK K 1 2. 4 10q21 .1 Di ck op f 1 H om ol og AI 669535 IL17 D 2. 1 13q12 .11 Int er le uk in 17DGe
ne
unde
re
xp
re
ssed
in
MM B
MMS
C
NM _001401 ED G 2 0. 5 9q31. 3 endo the lia l d iff er ent ia tio n ge ne 2 NM _003882 W ISP1 0. 32 8q24. 1-q 24. 3 W NT 1 i ndu ci bl e s ig na ling pa thw ay pro te in 1 A K 0 26829 LA M A 2 0. 3 6q22-q23 la m ini n; a lpha 2 (m er os in; c ong eni ta l m us cul ar dy st ro phy ) NM _000609 CX CL 12 0. 29 10q11 .1 che m ok ine (C-X -C m ot if) li ga nd 12 (s tr om al c el l-de riv ed fa ct or 1) NM _000908 NP R3 0. 29 5p14-p13 na tr iu re tic pe pt id e re ce pt or C BF 432648 TN FR S F 19 0. 26 13q12 .11 -q12 .3 tum or ne cr os is fa ct or re ce pt or s upe rf am ily ; m em be r 19 X 1 7406 AG C 1 0. 25 15q26 .1 aggre ca n 1 Z 9 5331 FB LN 1 0. 21 22q13 .31 fibu lin 1 A U 1 44912 IG F 1 0. 16 12q22 -q23 in su lin -li ke g ro w th fa ct or 1 (s om at om ed in C) J 04177 CO L11A 1 0. 1 1p 21 co lla ge n; ty pe X I; a lp ha 1 2526
Table 4 : Expression of mRNA and protei
n secretion by normal or MM BMMSCs IL-1ß GDF -15 SDF-1 IL-6 DK K1 AREG IGF-1 Normal 88.4 ± 18.9 183.5 ± 64.9 926.8 ± 88.6 1197 ± 1 16 130 ± 18 23 ± 3 57.1 ± 16.7 Myeloma 309.6 ± 83.3 749 ± 90.9 275.3 ± 59. 1 2300 ± 4 02 310 ± 30.4 119 ± 37.2 9.1 ± 2.6 mR NA Ratio P value 3.5 0.05 4.1 0.0003 0.3 0.0001 1.9 0.02 2.4 0.004 5.2 0.017 0.16 0.02 Normal 2.1 10 -6 ± 5.7 10 -6 1 10 -4 ± 1.9 10 -5 3.4 10 -2 ± 5.8 10 -3 3 10 -1 ± 2.7 10 -2 10 -3 ± 2.2 10 -4 B.D.L. B.D.L. Myeloma 3.2 10 -5 ± 1.6 10 -5 4.3 10 -4 ± 1.4 10 -4 1.3 10 -2 ± 4.7 10 -3 7.3 10 -1 ± 1.7 10 -1 1.4 10 -3 ± 3.6 10 -4 B.D.L. B.D.L. Protein (pg/cell) Ratio P value 16 0.09 4.3 0.04 0.4 0.02 2.4 0.03 1.4 0.36 Correla tion R = 0.94, P <0.001 R = 0.53, P <0.01 R = 0.9, P <0 .001 R = 0.86, P <0.001 R = 0.65, P < 0.004 Normal 473.4 ± 11 0.4 125.8 ± 46.5 33.3 ± 12.4 2378.8 ± 1 13 0.2 Myeloma 98.8 ± 30.3 215.2 ± 52.1 219.4 ± 11 7 36.5 ± 18.8 qRT -PCR Ratio P value 0.21 0.011 1.7 0.22 6.6 0.11 0.02 0.08
All data are expressed as
m
ean ± S.E.M. (n
=7 for norm
al subjects and n=6 for MM patients)
Ratio = Myelom
a/Nor
m
al
BMMSCs
B.D.L. = Below the dete
ction level o
f ELISA
Table 5 : Myeloma cell lines and BMMSC Co-culture XG1 MOLP-6 Normal BMMSCs (7) Myeloma BMMSCs (6) Normal BMMSCs (7) Myeloma BMMSCs (8) Day 4 -anti-IL6 3.2 ± 0.4 3.2 ± 0.3 1.6 ± 0.2 1.8 ± 0.1 +anti-IL6 1.9 ± 0.2 1.8 ± 0.2 N.D. N.D. Day 7 -anti-IL6 11.5 ± 2.2 13.5 ± 2.8 2.1 ± 0.3 3.3 ± 0.4 § +anti-IL6 5.1 ± 0.9 5.6 ± 1.5 N.D. N.D.
All data are expressed as mean ± S.E.M. of cell expansions.
Numbers in parenthesis = number of BMMScs from different individuals. N.D. = Not Done
- anti-IL-6 = culture without anti-IL-6 monoclonal antibody +anti-IL-6 = culture with anti-IL-6 monoclonal antibody
§ The mean value is significantly different from that with normal BMMSCs (P = .047) using a Student’s t-test
Figure 1: Co-culture of CD34+ cells with BMMSCs. CD34+ cells (4.104) were cultured on normal or MM BMMSCs (5.103/cm²) in 12-well plates. The co-culture was performed in Myelocult medium with 10 µM of hydrocortisone as described in Materials and Methods. At days 7, 14, 21 and 28, nonadherent cells were counted and a clonogenic test was performed. At day 35, nonadherent and adherent cells were harvested, counted and assayed in the clonogenic test.
Figure 2: Unsupervised data analysis of BMMSCs of the 3 groups of subjects. A: Principal component analysis (PCA) of BMMSCs from 6 myeloma patients (Q) and from 7 normal
individuals (}). Data were obtained from U133 2plus microarrays (Affymetrix) as described in Materials and Methods. Analysis was performed on 28746 probe sets declared as present by the call detection algorithm. The variation coefficient (VC), defined as the ratio of the SD to the mean of signal values for the considered probe set, was used to select genes incorporated in the PCA. By varying VC from 0% to 100%, the normal and MM BMMSC clusters can be more or less separated. At a VC of 60% the separation was the best and includes ~ 2,000 genes. The boxed scheme corresponds to the cluster analysis performed on the same set of data with Cluster and TreeView softwares (http://rana.lbl.gov/EisenSoftware.htm) B: MGUS BMMSC ( ) were added to the analysis.
Figure 3: Differentially expressed genes classification. The genes found to be differentially expressed between normal (n=7) and MM BMMSCs (n=6) were classified by use of gene ontology through the Fatigo platform (http://fatigo.bioinfo.cnio.es/) into 7 classes. The tumor microenvironment class comprised genes that belong to the intercellular communications (27%), to receptor signalization (9%) and to extracellular matrix and other secreted molecules (9%).
Figure 4: Myeloma cell line and BMMSC co-culture. MOLP-6 cells were cultured in RPMI-1640 medium with 10% FCS at 2 x 10⁴ cells/well in 24-well plates with or without an increasing concentration of GDF-15 (10, 50 and 100 ng/ml). After 7 days, the cells were counted by trypan blue exclusion, and the expansion coefficient was calculated (d7 cell number/d0 cell number).
MOLP-6 expansion with 100 ng/ml of GDF-15 was 2 times greater than that without GDF-15 (n=7, R=0.38 and p=0.048)
Figure 5: Osteoblastic differentiation of BMMPCs. The cells were cultured in osteoblastic medium as described in Materials and Methods during 21 days. (A) Matrix mineralization was then revealed by von Kossa staining, and cells were counter colored by use of giemsa. Pictures were taken on an Olympus IX71 inverted microscope (magnification 100X) and underwent analysis with Analysis B software. (B) Plates were stained with alizarin red and extensively washed in distilled water. The intensity of the staining was quantified according to Gregory27.
30
Figure 1
D
a
y
s
of cult
ure
0
7
14
21
28
35
Total num
ber of hemat
opoiet
ic progenito
rs / w
ell
1e+4
1e+3
1e+2
1e+1
1e+0
1e+5
Nor
m
al
My
eloma
31
Figure 2a
P C A2 10 0 -1 0 -5 5 A N O R5 N O R6 N O R1 N O R 3 N O R4 N O R 2 MM 1 MM 4 MM 5 MM 2 MM 6 MM 3 NR 7 O 0 PC A 1No
rm
a
l BM
M
S
C
MM
B
MM
S
C
P C A2 10 0 -1 0 -5 5 A N O R5 N O R6 N O R1 N O R 3 N O R4 N O R 2 MM 1 MM 4 MM 5 MM 2 MM 6 MM 3 NR 7 O 0 PC A 1No
rm
a
l BM
M
S
C
MM
B
MM
S
C
32
Figure 2b
No rm a l BM M S C M G US BM M S C MM B M MS CP
CA1
PCA
2
10 0 -10 N O R 4 N O R 7 N O R 3 M G U S 1 N O R 5 M G U S 5 N O R 6 M G U S 3 N O R 2 M M 4 M G U S 2 M M 5 M M 3 M M 2 M M 6 M G U S 4 N O R 1 M M 1 -5 0 5B
33
Figure 3
M e ta b o lis m 21% A popt os is 1% Nu cl e a r f u n c ti o n 16% Cy to skel et o n 6% P ro te in s y nt he s is 6% Cel l cy cl e 5% Tu m o r m ic roe nv ir onm e nt 46%34
Figure 4
GDF-15 (ng/ml)
0
2
04
06
08
0
1
0
0
1
2
0
Cell Amplification
0,5
0,0
1,0
1,5
2,0
2,5
3,0
35