Publisher’s version / Version de l'éditeur:
Canadian Geotechnical Journal, 20, pp. 673-680, 1983
READ THESE TERMS AND CONDITIONS CAREFULLY BEFORE USING THIS WEBSITE. https://nrc-publications.canada.ca/eng/copyright
Vous avez des questions? Nous pouvons vous aider. Pour communiquer directement avec un auteur, consultez la première page de la revue dans laquelle son article a été publié afin de trouver ses coordonnées. Si vous n’arrivez pas à les repérer, communiquez avec nous à PublicationsArchive-ArchivesPublications@nrc-cnrc.gc.ca.
Questions? Contact the NRC Publications Archive team at
PublicationsArchive-ArchivesPublications@nrc-cnrc.gc.ca. If you wish to email the authors directly, please see the first page of the publication for their contact information.
NRC Publications Archive
Archives des publications du CNRC
This publication could be one of several versions: author’s original, accepted manuscript or the publisher’s version. / La version de cette publication peut être l’une des suivantes : la version prépublication de l’auteur, la version acceptée du manuscrit ou la version de l’éditeur.
Access and use of this website and the material on it are subject to the Terms and Conditions set forth at
Effects of pile material and loading state on adhesive strength of piles
in ice
Frederking, R. M. W.; Karri, J.
https://publications-cnrc.canada.ca/fra/droits
L’accès à ce site Web et l’utilisation de son contenu sont assujettis aux conditions présentées dans le site LISEZ CES CONDITIONS ATTENTIVEMENT AVANT D’UTILISER CE SITE WEB.
NRC Publications Record / Notice d'Archives des publications de CNRC:
https://nrc-publications.canada.ca/eng/view/object/?id=61e73b1f-8ae0-446c-a74c-613f1e0d1554 https://publications-cnrc.canada.ca/fra/voir/objet/?id=61e73b1f-8ae0-446c-a74c-613f1e0d1554
N R C
-
I
BLOC.
R&:'
I
7
Ser
TH1
,
l o 1 3 3
N21d National Research Conseil nati0nal
no.
1127I
$
Council Canada de recherche CanadaB I B L I ~ T H ~ Q U E
I
Rcch.
BBtirn.'
c.BLDG
21
2
EFFECTS OF PILE MATERIAL AND LOADING STATE ON
ADHESIVE STRENGTH OF PILES IN ICE
by'^.
Frederking and J.
Karri
Reprinted from
Canadian Geotechnical Journal
Vol. 20,1983
p. 673
DBR Paper No. 1 127
Division of Building Research
This publication is being distributed by the Division of Building Research of the National Research Council of Canada. It should not be qroduced in whole or in part without permission of the original publisher. The Division would be glad to be of assistance in obtaining such permission. Publications of the Division may be obtained by mailing the m a t e
remittance (a Bank, Express, or Post Office Money Order, or a cheque, made payable to the Receiver General of Canada, credit NRC) to the National Research Council of Canada, Ottawa. KIA 0R6. Stamps are not acceptable.
A list of all publications of the Division is available and may be
obtained from the Publications Section, Division of Building Research, National Research Council of Canada, Ottawa. KIA 0R6.
Effects of pile material and loading state on adhesive strength of piles in ice
R. FREDERKING
Division of Building Research, National Research Council of Canada, Ottawa, Ont., Canada KIA OR6 AND
J . KARRI
Technical Research Centre of Finland, 02150 Espoo 15, Finland
Received January 10, 1983 Accepted July 11, 1983
Laboratory tests on piles made of different materials (polyethylene, polyvinylchloride, steel, wood, concrete, and Inerta 160-coated steel) were used to investigate their adhesion to an ice cover at high rates of loading. Steel, wood, and concrete piles had adhesive strengths from 0.4 to 0.5 MPa; failure at these stresses occurred in the ice. Polyethylene and polyvinylchloride piles had an adhesive strength in the range 0.05-0.07 MPa; failure was characterized by separation between the pile and the ice. Inerta 160-coated steel had an intermediate strength of 0.25 MPa. Measured strengths were related both to the adhesion of ice to the pile and compliance of the pile. A special test series investigated the effect on adhesion of a tensile or compressive stress state in a polyethylene pile. An adhesive strength of 0.06 MPa was recorded in tension, and 0.13 MPa in compression, because of the relative stiffness of the pile and the ice.
Keywords: ice loading, piles, ice adhesion, pile material, stress states.
Des essais de laboratoire sur des pieux faits de diffkrents matkriaux (polyCthylkne, chlorure de polyvinyle, acier, bois, bCton et acier enduit d'Inerta 160) ont Ctk rCalisks pour Ctudier l'adherence i un couvert de glace sous vitesse de chargement ClevCe. L'acier, le bois et le bCton ont une rksistance en adhCrence de 0,4 i 0,s MPa, la rupture se produisant dans la glace. Les pieux en polykthylkne et en chlorure de polyvinyle ont une rksistance en adhkrence de l'ordre de 0,05 B 0,07 MPa, et la rupture se caractk- rise par une skparation i l'interface glace-pieu. L'acier enduit dlInerta 160 a une rksistance intermkdiaire de 0,25 MPa. Les rksistances mesurkes sont relikes i I'adhCrence de la glace au pieu ainsi qu'8 la dCformation du pieu. Une sCrie d'assais sp6ciaux a permis 1'Ctude de l'effet d'Ctat de compression ou de tension sur l'adhkrence sur un pieu en polyCthylkne. Une rksistance en adhkrence de 0,06 MPa a kt6 mesurke en tension, par rapport B 0,13 MPa en compression, par suite de la rigidit6 relative du pieu et de la glace.
Mots-clis: charge de glace, pieux, adherence de la glace, matCriaux de pieux, Ctats de contrainte.
[Traduit par la revue]
Can. Geotech. J. 20,673-680 (1983)
Introduction
Changes in the water level beneath an ice cover may cause substantial vertical loads on structures to which ice is frozen. This problem has received intermittent attention. Lofquist (1951) analysed vertical ice loads on piles, assuming viscoplastic behaviour of ice. Doud (1978) measured vertical loads on two instrumented marina piles. Short- and long-term holding strengths of wooden piles in ice were reported by Stehle (1970). Parameswaran (1981) studied the adfreeze strength of ice to model piles of wood, concrete, and unpainted steel. Frederking (1974, 1979) carried out both field and laboratory tests applying vertical loads on wooden piles in ice sheets.
To study the variation of adhesive strength of piles made from different materials, a laboratory test series was conducted. The laboratory was used since better control over the environment is possible there than in nature.
Under natural conditions, an ice cover loads a structure when movements of the ice cover are resisted by the structure. This loading condition was simulated in
the laboratory by pulling the pile upwards with respect to the ice cover. Natural loading rates are quite low, taking place over several hours. Previous investigations (Fred- erking 1979) showed that adhesion loads increase with increasing loading rates. Therefore high loading rates were selected for these tests to determine maximum adhesion loads. Because of the relatively small tank used, the ice sheet was less flexible than it is in nature. With ice thicknesses used in the tests failure was by shear within the ice sheet. The resisting forces observed in the tests therefore represent the upper limit of the resistance in nature, where the ice sheet could fail in bending as well as shear. As the main aim of the test series was to study the effect of pile material on adhesive strength, ice thicknesses were deliberately chosen to cause shear failure.
In the case of friction piles in soil, the adhesion of the pile differed according to whether the pile was in tension or in compression (Fellenius and Samson 1976). This difference was explained in terms of induced transverse strains in the pile. Bozozuk et al. (1979) related this behaviour to Poisson's ratio effects and quantitatively
674 CAN. GEOTECH. J .
related the ratio of pile load under compression to tension as (1
+
v) to (1 - v), where v is Poisson's ratio of the pile. Analytical calculations by Frederking andKarri (1981) showed that the modulus of the pile
material has a significant influence on contact stresses between the ice and the pile. To investigate this effect, a series of tests was carried out with polyethylene piles arranged so that the pile was either in tension or in compression.
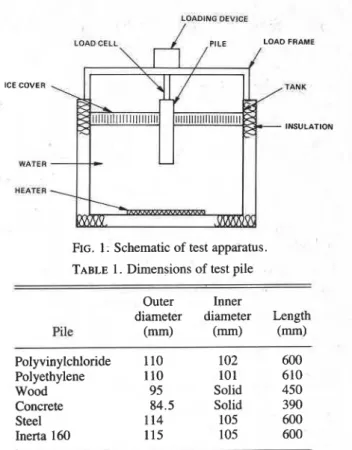
Description of test apparatus
Most of the experiments were performed in a cold room in the Laboratory of Structural Engineering at the Technical Research Centre of Finland (VTT). Some additional tests were carried out in the Ice Mechanics Cold Room at the Division of Building Research, National Research Council of Canada (NRCC). The basic test setup was the same at both locations; a vertical pile frozen into an ice cover of desired thickness was loaded by raising the pile with respect to the ice cover. The test arrangements are shown schematically in Fig.
1. VTT tests
Tests in the VTT cold room were conducted in a tank 1000 mm in diameter and 600 mrn deep. It was insulated on the bottom and sides and had a heater on the bottom so that both ice growth rate and water temperature could be controlled. A thermocouple probe was used to measure ice and water temperatures.
A load frame transferred the load from the pile to the tank. Load was applied with a manually operated hydraulic cylinder having a capacity of 300 kN. Contin- uous records were made of load and pile displacement with respect to the ice cover. A more complete descrip- tion of the test facilities can be found in Frederking and
Karri (1981).
Six different materials were used in the VTT tests: polyvinylchloride (PVC) , polyethylene (PE) , wood (spruce), steel (sandblasted and allowed to rust), con- crete, and Inerta 160 marine coating (0.5 mm thick) on steel pile. The wooden piles had a surface roughness variation of about 0.5 mm and the steel piles about 0.05 mm. Dimensions of the test piles are given in Table
1.
The hollow piles were all filled with foamed-in-place urethane. Piles were normally loaded by pulling up- wards on the top of the pile, i.e., the pile was in tension. In the case of the concrete piles and some of the PVC piles, however, an upwards-acting load was applied to the lower end of the pile, i.e., the pile was in compression.
Since loading was done by a manually operated hydraulic cylinder, constant loading or deflection rates could not be achieved. A steady and moderate stepwise increase of load was maintained, with one stroke every
VOL. 20, 1983
jOMtNG
DEV'CE ICE COVER WATER L O A D C E L L LOAD FRAME T A W INSULATION H E A E RFIG. 1. Schematic of test apparatus.
TABLE 1. Dimensions of test pile Outer Inner
diameter diameter Length
Pile (mm) (mm) (mm) Polyvinylchloride 1 10 102 600 Polyethylene 110 101 610 Wood 95 Solid 450 Concrete 84.5 Solid 390 Steel 114 105 600 Inerta 160 115 105 600
5 s. The loading rates usually varied between 0.10 and 0.80 kN/s prior to first cracks or pile-ice separation.
NRCC tests
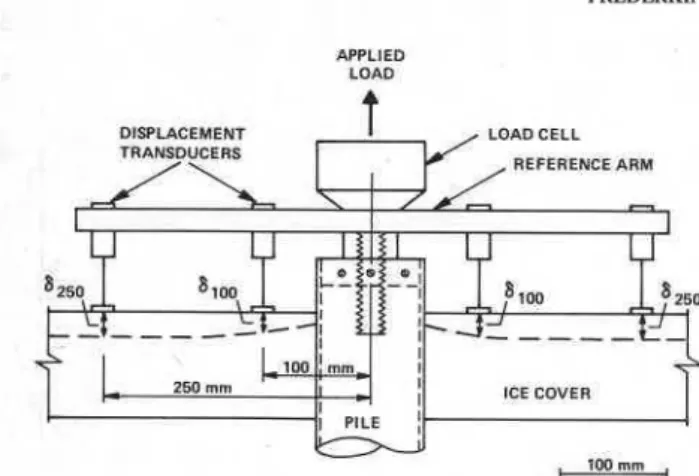
The tank used in these tests was 600 mm in diameter and 600 mm deep. Load was generated with a screw jack driven by a variable speed motor and was applied in a continuous monotonic fashion. A 400 mm long poly- ethylene pile identical to that used at V?T was loaded. Load was applied either to the top or the bottom of the pile. Before each test the pile was carefully cleaned with ,
alcohol to remove any grease. A detailed schematic of the arrangement for measuring load and deflection of the ice cover is shown in Fig. 2. Subscripts on the deflections, SIOO and 6250, refer to the radial distances of the displacement transducers from the central axis of the pile. The measured deflections, 6, include the effects of both the deflection of the ice cover and deformation of the pile. A more complete description of the test apparatus can be found in Frederking (1979). I
I
Test procedure
Ice growth and subsequent testing were carried out in a cold room. To simulate natural conditions, the pile was placed in a water-filled tank and an ice cover grown around it. Before ice growth was initiated, the pile was attached to the loading system and carefully aligned vertically.
FREDERKING AND KARRl 675 AWLIED LOAD
t
DrSPLACEMEHT I tRANSDUCERS REFERENCE ARM I-
I IFIG. 2. Details of load and deflection measurements at
1
NRCC facility. Polyethylene pile. --, deflected shape of ice cover; 8100 and 8250, measured deflections.A reproducible ice cover was grown for each test to minimize ice property variations. Type S-2 (Michel and Ramseier 1971) columnar grained ice was grown for all tests. This type of ice is representative of the natural ice cover which forms on a lake. To achieve a reproducible ice cover, careful attention was paid to growth condi- tions. The procedure used was as follows.
Water in the tank was mixed while cooling to a uniform temperature of 4"C, its temperature of maxi- mum density. Water cooled below 4°C becomes less dense so that a stable temperature gradient develops, provided the water is not mixed. The tank was seeded when the water temperature lOmm below the surface reached 1°C. At VTT an atomizer filled with water at 0°C sprayed a fine mist just above the water surface. The resulting ice crystals fell to the surface of the tank and initiated the formation of a fine-grained, randomly oriented surface layer of ice which (within several millimetres of vertical growth) was transformed into a columnar grain structure. At NRCC seeding was done by sieving fine-grained snow (less than 0.8mm dia- meter) at
-
10°C onto the water surface. To maintain a regular columnar structure, a heater kept the water temperature at the bottom of the tank between 3.5 and 4°C. In this manner ice with reproducible grain structure could be grown.Ice growth rate varied from 30-45 mm/day in the VTT facility, which operated at an air temperature of about - 14°C. It was about 25 mm/day at the NRCC facility, operated at
-
10°C. The grain size and structure of each sheet was checked by preparing thin sections and examining them between crossed polaroids. At VTT, average grain diameter at the bottom of the ice sheet was 2-3 rnm, the larger size corresponding to greater ice thicknesses. At NRCC the grain diameter at the bottom of the ice sheet was about 4 mm. Grain structure and size was similar at both test facilities.Test results
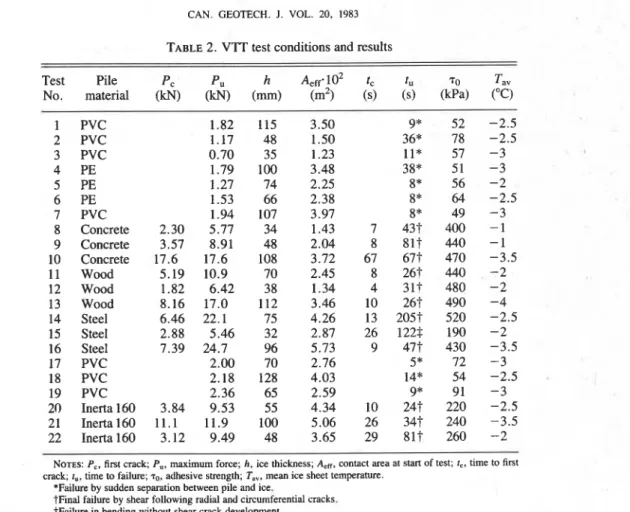
Over 20 experiments were carried out at VTT to investigate the effect of pile material on adhesive strength. Continuous records of load and deflection versus time were made. Temperature profiles of the ice cover were made before and after each test to evaluate the mean ice temperature. Results and test conditions are summarized in Table 2.
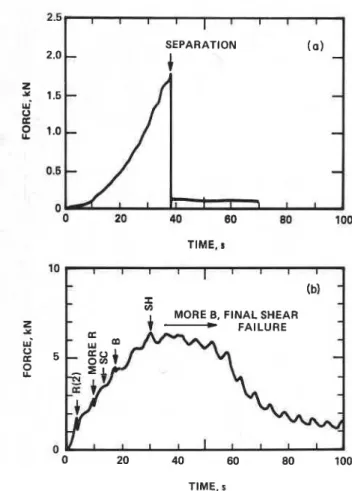
Two different types of failure were noted. In the case of the PVC and polyethylene (PE) piles, failure was characterized by a sudden separation between the ice and the pile, and an abrupt drop of load. A typical load-time curve for a PE pile is presented in Fig. 3a. Frequently some separation was observed before load- ing began, most likely due to the high thermal expansion coefficient of the plastics. As freezing proceeds down- wards, the upper part of the ice sheet and the pile adjacent to it become colder. The resulting differences in thermal contraction produce stresses leading to separation between the pile and the ice.
In the case of wood, concrete, steel, and even Inerta-coated steel piles, failure occurred within the ice. A typical load-time curve for a wooden pile is illus- trated in Fig. 3b. The failure process in this case was more elaborate. There was an initial formation of radial and circumferential cracks (time tc in Table 2), usually followed by a continued increase in load. Only in test 10 was the maximum load associated with the first crack. As load increased after the first crack, shear cracks formed and gradually coalesced into a conical shear failure surface. In some cases this surface developed gradually, resulting in yield behaviour; in other cases it ran rapidly to the surface with a corresponding sudden drop in load.
Load values for first cracks, PC, and maximum forces, Pu, are presented in Table 2 together with contact area between the pile and ice, and adhesive strengths. Note that t, and tu are the loading times corresponding to PC and P,. The adhesive strength is defined as
where P , is the ultimate load and Aeff is the effective contact area at the start of the test, taking into account initial separation. The amount of initial separation was estimated from visual observations. Adhesive strength is plotted versus ice thickness in Fig. 4. Strengths can be divided into three categories by pile material. Wood, steel, and concrete piles showed the highest adhesive strength, Inerta 160-coated steel the next highest, and PVC and PE the lowest strengths. Over the range of thicknesses investigated, there was no clear dependence of adhesive strength on ice thickness, except for test 15 where the ice sheedt essentially failed in bending at a much lower adhesive stress.
676 CAN. GEOTECH. 1. VOL. 20, 1983
TABLE 2. VIT test conditions and results
Test Pile PC PU h I, t, 70 Tav
No. material (kN) (kN) (mm) (m2) (s) (s) (kpa) ("C)
1 PVC 1.82 115 3.50 9* 52 -2.5 2 PVC 1.17 48 1.50 36* 78 -2.5 3 PVC 0.70 35 1.23 l l * 57 -3 4 PE 1.79 100 3.48 38* 51 -3 5 PE 1.27 74 2.25 8* 56 -2 6 PE 1.53 66 2.38 8* 64 -2.5 7 PVC 1.94 107 3.97 8* 49 -3 8 Concrete 2.30 5.77 34 1.43 7 437 400 -1 9 Concrete 3.57 8.91 48 2.04 8 81t 440 -1 10 Concrete 17.6 17.6 108 3.72 67 67t 470 -3.5 11 Wood 5.19 10.9 70 2.45 8 26t 440 -2 12 Wood 1.82 6.42 38 1.34 4 317 480 -2 13 Wood 8.16 17.0 112 3.46 10 267 490 -4 14 Steel 6.46 22.1 75 4.26 13 205t 520 -2.5 15 Steel 2.88 5.46 32 2.87 26 122f 190 -2 16 Steel 7.39 24.7 96 5.73 9 47t 430 -3.5 17 PVC 2.00 70 2.76 5* 72 -3 18 PVC 2.18 128 4.03 14* 54 -2.5 19 PVC 2.36 65 2.59 9* 91 -3 20 Inerta160 3.84 9.53 55 4.34 10 24t 220 -2.5 21 Inerta160 11.1 11.9 100 5.06 26 34t 240 -3.5 22 Inerta160 3.12 9.49 48 3.65 29 81t 260 -2
NOTES: PC, first crack; P., maximum force; h, ice thickness; AeW, contact area at start of test; t., time to first crack; I,, time to failure; TO, adhesive strength; T,,, mean ice sheet temperature.
*Failure by sudden separation between pile and ice.
tFinal failure by shear following radial and circumferential cracks. $Failure in bending without shear crack development.
divided by failure time ( t , ) , was compared to adhesive strength, but no correlation was found over the range of this series. There was, however, a general trend of greater adhesive strength with longer loading times.
A series of 13 tests was carried out at the NRCC facility specifically to investigate the effect of the loading state (tension or compression) applied to a polyethylene pile. If the pile was pulled from the top it was considered to be in tension, and when pushed from the bottom, in compression. Continuous records of load and deflections versus time were made for all tests. Temperature profiles in the ice cover were measured before and after each test and a mean ice sheet temperature calculated. Results and coresponding test conditions are summarized in Table 3. Adhesive strength was calculated using [I]. Since there was little separa- tion between the pile and ice at the start of the tests, Aeff was determined from pile diameter, 110 mrn, and ice thickness, h.
The results of this test series are presented graphically in Fig. 5. There is a distinct difference in the adhesive strength depending upon whether the pile is in tension or compression. For compressive loading, adhesive strength is about twice that for tensile loading. In all cases with the polyethylene pile, failure was abrupt, i.e., there was no evidence of yielding prior to failure
and at failure the load dropped to zero. Usually a shallow shear cone developed at failure and in about half the cases radial cracks also occurred. The deflection at failure, 6, (see Table 3), also showed a distinct difference depending on the state of pile loading. The deflection at failure is almost an order of magnitude higher for compressive pile loading. This is greater than the difference which could be attributed to differing adhesive strengths.
Discussion of results
The variation in the adhesive strengths with pile materials measured in the V l T tests can be attributed to two factors. One is the interface (molecular) bond between ice and material at the pile surface and the other is the relative deformation of the ice and pile (mechan- ics) resulting from the load applied to the pile. These two factors, plus several other secondary ones, have recently been identified by Oksanen (1982). If the interface bond were the controlling factor, then only the surface coating would affect adhesive strength. On the other hand if the effect of pile material dominates, results should be independent of surface coatings. Both factors were present in all test cases and the measured adhesive strength reflects their combined action.
FREDERKING AND KARRl 677
I l l I I I I I
-
(b)-
-
5
-
MORE B, FINAL SHEAR
-
+
-
-
FAILURE-
-
TIME. a 10 TIME, sFIG. 3. Typical load-time curves for V l T tests. (a) Test 4,
polyethylene pile. (b) Test 1 1 , wood pile; appearance of cracks: R = radial, SC = small circumferential, SH = shear.
0 50 100 150 200 ICE THICKNESS. m m l ' ' l ' l ' " ' l r " '
--- ---
-
-
0 . WOOD -0---
l---
- 0 - - - 0 10 INERTAlEO -n---
-
BENDING FAILURE-
-
----
FIG. 4. Adhesive strength vs. ice thickness. PE = poly- ethylene, PVC = polyvinylchloride.
of wood, concrete, and steel piles. For all these materials it is possible for the surface to be wet by water and in fact water may penetrate into the pile, particularly in the case of wood and concrete. This results in an excellent bond between the ice and the pile. Coating the steel pile with Inerta 160, a polymer, puts a smooth
hydrophobic material at the ice interface and reduces adhesive strength by a factor of 2.
These tests have been conducted at quite high loading rates. Earlier work (Frederking 1979) showed that adhesive strength increased with decreasing loading time, down to about 200s, below which adhesive strength apparently remains constant or decreases. Therefore the loading rates used were those at which maximum adhesive strength would be expected.
The adhesive strength values found for wood and concrete in this study (0.4-0.5 MPa) are significantly less than those found by Pararneswaran (1981) (0.5- 1.8 MPa for wood and 0.8 for concrete). This can be explained by the lower test temperature in that study (-6°C) and the absence of any flexural stresses under those conditions.
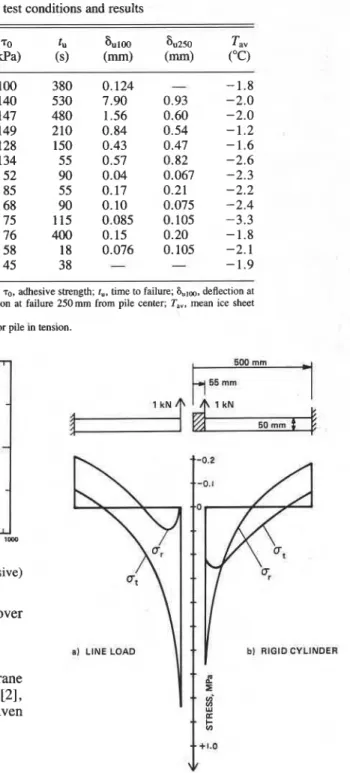
Polymer piles (PVC and PE) showed adhesive strengths substantially less than the Inerta 160-coated pile. The actual surface condition of these piles should be little different from that of the Inerta 160-coated steel. The difference can be attributed to the mechanical response of these piles to the applied loads. The stiffness of a pile centrally embedded in a circular plate greatly influences the bending stresses in the plate. Two limiting cases would be loading with a rigid cylinder, or with a line load distributed around the hole. The radial and tangen- tial stresses at the upper surface of the plate, calculated from thin plate bending theory, are presented in Fig. 6 for these two extreme cases. The actual situations for stiff and flexible piles would tend to fall between these extremes.
The shear stress distribution along a compressible pile in soil has been solved analytically by Mattes and Poulos (1969). Their analysis showed that in the case of a relatively rigid pile, the shear stress was uniformly distributed along the length of the pile. In the case of a more compliant pile, the shear stress was non-uniformly distributed, having a maximum near the point of load application and then decaying rapidly along the length of the pile. Therefore it is expected that the maximum shear stress on a polyethylene pile in ice would be substan- tially higher than that on a steel pile, for an equivalent applied load. This illustrates the importance of pile material on the mechanics of the interaction between the pile and ice.
In the VTT tests, in which the pile was loaded in tension, the average adhesive strength was 52 kPa for the polyethylene pile. The adhesive strength for similar loading strength tests at NRCC was 65 kPa. Agreement between the sets of results is remarkably good.
The effect of loading state (tension or compression) on adhesive strength is presented in Fig. 7. The visualization of pile response depending on whether it is under tension or compression is simplified by assuming that the ice generates a uniform shear stress on the pile (Fig. 7a). The axial stress a, generated in a tubular pile
678 CAN. GEOTECH. J. VOL. 20, 1983
TABLE 3. NRCC test conditions and results
h p u 70 tu 81~100 8u250 Tav
TestNo.* (mm) (kN) (kPa) (s) (mm) (mm) ("C)
NOTES: h , ice thickness; P,, maximum force; 70, adhesive strength; t.. time to failure; 6.,00, deflection at
failure lOOmm from pile center; buZM, deflection at failure 250 mm from pile center; T,,, mean ice sheet temperature.
*C stands for pile in compression; T stands for pile in tension.
1 1 , 1111 I I 1 1 1 111
0- LOADING FROM BOTTOM ICOMPRESSIONI
0-
-
LOADING FROM TOP ITENSION10 0 0 . t ~
*
,mr MR 0 0-
0 - - 0 . 0 B s ~ E 4 M R R - ~ ~ - R - - R R ~ R - 0 I 1 1 1 1 1 1 I 1 1 , 1 1 1 , 0 10 1W TIME TO FAILURE.$FIG. 5. Influence of loading state (tensile and compressive) on adhesive strength of polyethylene pile.
of wall thickness t varies with depth z in the ice cover according to the following simple relation:
Assuming the tubular cylinder to be in a membrane stress state, and acted upon by the axial stress a, of [2], the maximum radial deformation u at r = d/2 is given by
FIG. 6. Maximum bending stresses on upper surface of 1
where v is Poisson's ratio and E is the elastic modulus of centrally loaded circular plate (tension positive). the pile. The final deformed shape of the pile is tapered
as shown in Fig. 7b and c for tensile and compr~ssive This analysis does not take into account the restrain-
,
loading, respectively. Equation [3] shows that not only ing effect of the ice; thus it is only a qualitative pile modulus but also the wall thickness ( t ) has a representation of the interaction between a pile and an significant effect on radial deformation ( u ) . A solid pile, ice cover. Nevertheless it provides a basis for explaining such as wood or concrete, would have a smaller radial the difference in adhesive strengths for the two loading deformation than a tubular one, for a given load P. states. Figure 7b shows that a under tension tends toFREDERKING AND KARRl I PLASTlC SLEEVE
--
--
L-
-
T b-
-
--
W b +-
--
ICE COVER CLOSEDCELL FOAM INSULATION CONNECTION BETWEENla1 STRESS DISTRIBUTIONS
u - Maxomum Radlal
Deformation
FIG. 8. Proposed uplift-resistant pile design.
I
p lb) TENSILE LOADING (d CWPRESSIVE LOADINGFIG. 7. Schematic of applied stress and deformation response of piles to tensile and compressive loading states. shrink away from the surrounding ice, whereas Fig. 7 c indicates that a pile under compression tends to expand into the ice. Where the pile is in tension and shrinking away from the ice, any separation initiated would propagate immediately to failure. In the case of com- pression, the pile is expanding into the ice and negates the effect of any initial localized adhesion failures, with a resulting higher adhesive strength. Because polyethyl- ene is a low modulus material, these deformations and the resulting difference in tensile and compressive loading would be quite large. For example, assuming for thepilev = 0.5, E = 1 GPa, t = 4.5mm, andP = 1 kN, the deformation ( u ) is about 0.02 mm. On the other hand a steel pile under similar conditions would deform about a hundredth of this amount. The preceding analysis does not provide a quantitative prediction for the difference between the measured adhesive strengths, but does provide a basis for a qualitative explanation.
Attempts were made to relate the measured deflec- tions of the ice cover, in the case of the NRCC tests, under the conditions shown in Fig. 2, to shear and flexure in the ice. The calculated deflections of the ice cover, using reasonable values of elastic properties of
the ice, were at least an order of magnitude smaller than the measured values. Further analysis showed that the measured deflections could be explained by axial defor- mation of the pile itself. As shown in Fig. 2, the section of pile between the top of the ice cover and the point of attachment to the loading system would elongate under the action of the applied load. If the pile were loaded from the bottom (compression mode of Fig. 7c) then the section of pile between the bottom of the ice cover and the load application point would contract under the action of the applied load. The lengths of the piles subjected to load for the tensile or compression state were about 60 and 250 mm, respectively. The combined effect of the pile length (about a factor of 4) and failure load (about a factor of 2) explains the approximately 10-fold difference in deflection at failure between the two loading states.
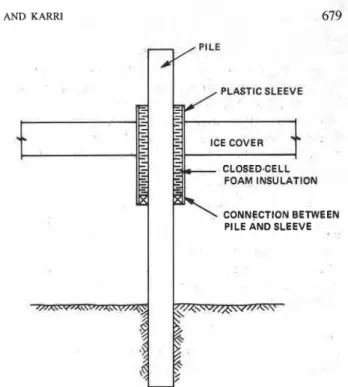
This suggests that it is not enough to use a low adhesion material to reduce adhesion strengths; atten- tion must also be paid to the mechanics of the pile-ice interaction to gain maximum benefits in adhesive strength reduction. If a plastic sleeve is used around a pile to reduce ice adhesion and uplift force, the bottom of the sleeve should be attached to the pile, to put the sleeve in tension and gain maximum benefit. The pile shown in Fig. 8 is designed to minimize the effects of uplift forces generated by an ice cover lifted by a rise in water level. The foam annulus between the pile and the sleeve permits freedom of radial movement between the two. Such a design could also be used for pile founda- tions in seasonally frozen soil susceptible to frost heaving.
680 CAN. GEOTECH.
Conclusions
The adhesive strength of the polyethylene and PVC piles was about one-fifth that for wood, steel, and concrete piles. The adhesive strength of a polymer- coated steel pile was intermediate between the two. These differences were due to the lower adhesion between ice and polymers, and the mechanical interac- tion between the ice and the pile, i.e., large deforma- tions in the polymer piles due to their low elastic modulus. The failure process in the case of the polymer piles was by separation between the pile and the ice, whereas in the case of wood, steel, concrete, and polymer-coated steel piles, failure occurred in the ice. The adhesive strength of the polyethylene pile loaded in tension was half of the strength when loaded in compression.
The adhesive strengths presented in this paper are for very high loading rates compared with those normally encountered in nature. Therefore they represent maxi- mum potential values under extreme conditions.
Acknowledgements
Part of the work reported here was carried out while R. Frederking was a guest of the Technical Research Centre of Finland (VTT), in May 1980.
The assistance of P. Ahlgren and R. Ahopelto, Technical Officers of VTT, Eila Lehmus, research engineer at VTT, and Joe Neil, Technical Officer at NRCC, is gratefully acknowledged.
This paper is a contribution of the Division of Building Research, National Research Council Canada, and is published with the approval of the Director of the Division.
J. VOL. 20, 1983
Bozozu~, M., KEENAN, G. H., and PHEENEY, P. E. 1979. Analysis of load tests on instrumented steel test piles in compressible silty soils. American Society for Testing and Materials, Special Technical Publication 670, pp. 153-160.
DOUD, J. 0. 1978. Ice sheet loads on marine piles. Canadian Geotechnical Journal, 15, pp. 599-604.
FELLENIUS, B. H., and SAMSON, L. 1976. Testing of drivability of concrete piles and disturbance to sensitive clay. Canadian Geotechnical Journal, 13, pp. 139- 160.
FREDERKING, R. 1974. Downdrag loads developed by a floating ice cover: field experiments. Canadian Geotech- nical Journal, 11, pp. 339-347.
1979. Laboratory tests on downdrag loads developed by floating ice covers on vertical piles. Fifth International Conference on Port and Ocean Engineering under Arctic Conditions, POAC 79 Proceedings, Trondheim, Vol. 2, pp.
1097-1 110.
FREDERKING, R., and KARRI, J. 1981. Laboratory tests on ice sheet adhesion on piles of different materials. Laboratory of Structural Engineering, Technical Research Centre of Fin- land, Espoo, Technical Report No. 14.
MFQUIST, B. 1951. Lifting force and bearing capacity of an ice sheet. National Research Council Canada, Ottawa, Technical Translation l"r- 164.
MATTES, N. S., and Pou~os, H. G. 1969. Settlement of a single compressible pile. ASCE Journal of the Soil Mechan- ics and Foundations Division, 95(SM1), pp. 189-207. MICHEL, B., and RAMSEIER, R. 0 . 1971. Classification of
river and lake ice. Canadian Geotechnical Journal, 8, pp. 36-45.
OKSANEN, P. 1982. Adhesion strength of ice. Technical Research Center of Finland, Espoo, Research Report 123.
PARAMESWARAN, V. R. 1981. Adfreeze strength of model piles in ice. Canadian Geotechnical Journal, 18, pp. 8-16.
STEHLE, N. S. 1970. Holding strength of piles in ice. U.S. Naval Civil Engineering Laboratory, Port Hueneme, CA, Technical Report R-700.