HAL Id: hal-03209501
https://hal.laas.fr/hal-03209501
Submitted on 27 Apr 2021
HAL is a multi-disciplinary open access
archive for the deposit and dissemination of
sci-entific research documents, whether they are
pub-lished or not. The documents may come from
teaching and research institutions in France or
abroad, or from public or private research centers.
L’archive ouverte pluridisciplinaire HAL, est
destinée au dépôt et à la diffusion de documents
scientifiques de niveau recherche, publiés ou non,
émanant des établissements d’enseignement et de
recherche français ou étrangers, des laboratoires
publics ou privés.
Non-Uniform Sampling Theory applied to Optical
Feedback Interferometry for Displacement Sensors
Olivier Bernal, U. Zabit, T. Niakan, A. Raghubanshi, Francis Jayat, Thierry
Bosch
To cite this version:
Olivier Bernal, U. Zabit, T. Niakan, A. Raghubanshi, Francis Jayat, et al.. Non-Uniform Sampling
Theory applied to Optical Feedback Interferometry for Displacement Sensors. 2020 IEEE International
Instrumentation and Measurement Technology Conference (I2MTC), May 2020, Dubrovnik, Croatia.
pp.1-5, �10.1109/I2MTC43012.2020.9129027�. �hal-03209501�
Non-Uniform Sampling Theory applied to Optical
Feedback Interferometry for Displacement Sensors
O. D. Bernal
LAAS-CNRS, OASIS University of Toulouse Toulouse, France [email protected]U. Zabit
School of EECS NUST Islamabad, Pakistan [email protected]T. Niakan
Department of EEEA INP ENSEEIHT Toulouse, France [email protected]A. Raghubanshi
Department of EEEA INP ENSEEIHT Toulouse, France [email protected]F. Jayat
LAAS-CNRS, OASIS University of Toulouse Toulouse, France [email protected]T. Bosch
LAAS-CNRS, OASIS University of Toulouse Toulouse, France [email protected]Abstract—In this paper, a method based on the non-uniform
sampling theory is proposed to recover remote target’s displace-ment from laser optical feedback interferometry (OFI) signals. The laser diode is operated in moderate optical feedback regime and is modulated with a sinusoidal dithering signal via laser diode current drive modulation. This dithering signal allows the recovery of sub-λ/2 displacements. The proposed method relies only on OFI’s fringe detection to recover the target’s displace-ment. The results are compared with mechanical dithering of the target. Using a laser diode emitting at 1550 nm, the measured white noise power spectral density is approximately 3.4 nm/√Hz.
Index Terms—Optical feedback interferometry, self-mixing
interferometry,non-uniform sampling, dithering, laser diode cur-rent modulation, displacement sensor
I. INTRODUCTION
Optical feedback interferometry (OFI), also referred as self-mixing (SM), effect in laser diodes (LD) [1], [2] has been widely investigated for the last decades as it results in a self-aligned and cost effective sensing system. The resolution of a stationary OFI based displacement sensor depends on the employed signal processing techniques.
Displacement measurement with a basic resolution of half-wavelength (λ0/2) can be easily achieved with an OFI sensor under moderate optical feedback regime by fringe counting [1]. The basic resolution can be improved by locking the laser phase to half-wavelength [3] or by fringe duplication [4], [5] or by utilizing phase unwrapping techniques. Dif-ferent phase unwrapping techniques (based on time-domain OFI signal processing) have been proposed in literature [6]– [12] providing accuracy from λ0/8 to λ0/60. For accuracy exceedingλ0/40, these methods [7], [8] require elaborate time-domain SM signal segmentations as well as estimations of key OFI parameters, such as optical feedback coupling parameter C. Except for the fringe-locking method [3], [13], [14], to the best of our knowledge, none of the previously mentioned methods exploiting the modulation of optical output power
(OOP) by OFI have achieved precision down to the nanometer yet.
Using the OOP SM signal obtained with a LD operating in the moderate feedback regime (1 < C < 4.6), we do propose here a new open-loop approach that allows to recover sub-λ0/2 displacement with nanometric precision for an LD of
wavelength λ0. This approach retains the inherent simplicity of OFI as the required hardware consists only in amplifying and acquiring the SM signal contrary to [15].
SM interferometer is here perceived as an inherent non-uniform sampling system with its own embedded phase level-crossing detector. Based on the non-uniform sampling (NUS) theory, we show that it is possible to reconstruct the target displacement based on fringe detection only, thereby without requiring phase unwrapping techniques. In addition, a phase dither Φd obtained by modulating the LD driving current,
is added. This allows to recover the displacements without estimating C as well as sub-λ/2 displacements. Note that in [16], [17], the dithering technique was also employed to retrieve the displacement. However, the LDs were operated in very weak feedback regime and dithering was employed so that lock-in techniques can be used.
In the following section II, we present the non-uniform sampling theory applied on SM signals as well as the purpose of the dithering signal. Finally, in section III, different exper-imental test benches are described and results are analyzed to assess the system performances.
II. PROPOSEDMETHOD
A. OFI overview
In OFI, a portion of the laser beam can be back-scattered from a target placed at a distanceD0 from the laser (moving with displacementD(t)) and can thus re-enter the active laser cavity (Fig. 1). This causes a mixing of generated and phase-© 2020 IEEE. Personal use of this material is permitted. Permission from IEEE must be obtained for all other users, including reprinting/ republishing this material for advertising or promotional purposes, creating new collective works for resale or redistribution to servers or lists, or reuse of any copyrighted components of this work in other works
I0+Id(t) D(t) PZT D0 Lens Laser Diode Photodiode P(t)
Fig. 1. Self-Mixing displacement sensor set-up with a piezoelectric transducer (PZT) used as a target. A dithering signal can be added either via the laser
drive currentI0+ Id(t).
shifted back-scattered beams. This “self-mixing” (SM) causes fluctuation in the laser OOP, denoted as P (t), given by [1]:
P (t) = P0(1 + m cos (ΦF(t))) (1)
where P0 is the emitted optical power under free-running conditions, m is the modulation index and ΦF(t) is the laser
output phase in the presence of feedback.ΦF(t) is related to
the laser output phase without feedbackΦ0(t) = 4πD (t) /λ0 by:
Φ0(t) = ΦF(t) + C sin (ΦF(t) + arctan α) (2)
where α is referred to as the linewidth enhancement fac-tor [1], [2]. Depending on C , the laser can operate into different regimes. SM sensing is generally performed under weak feedback regime (C < 1), moderate feedback regime (1 < C < 4.6), or strong feeback regime ( C > 4.6). However, moderate feedback regime (1 < C < 4.6) is usually preferred as the apparently simple saw-tooth shaped SM fringes belonging to such a regime [18] intrinsically provide motion direction indication and require simplified SM fringe detection processing [19].
B. OFI as a non-uniform sampling system
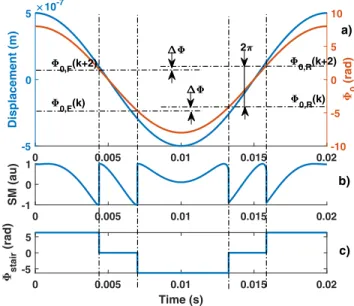
Here, in this moderate feedback regime, based on (1) and (2), we propose to perceive SM interferometers as an inherent non-uniform sampling system with its own embedded phase level-crossing detector. By monitoring the OOP discontinu-ities, a phase domain level crossing every 2π can thus be obtained (Fig.2). However, as shown in Fig.2, these phase quantization levels (PQL) Φ0(k) are slightly different (by an amount denoted ΔΦ) for an increasing and decreasing Φ0
phase. These PQLs can thus be referred to as Φ0R andΦ0F when Φ0 is increasing or decreasing respectively. They are completely defined by (2) with ΦF as given in [20] whenever
ΦF has infinite slopes. It will be later shown that this ΔΦ
does not cause any issue for the proposed approach.
Similarly to level-crossing analog-to-digital converters [21], [22], the SM phase level-crossing detector outputs time-phase pairs[tn, Φn]. For each pair, tncorresponds to the time instant
0 0.005 0.01 0.015 0.02 -5 0 5 Displacement (m) 10-7 -10 -5 0 5 10 0 (rad) 0 0.005 0.01 0.015 0.02 -1 0 1 SM (au) 0 0.005 0.01 0.015 0.02 Time (s) -5 0 5 stair (rad) 0,F(k) 0,R (k) 0,R(k+2) 0,F(k+2) 2 a) c) b)
Fig. 2. Simulated typical Self-Mixing signal (b) obtained for (a) a 0.5μm
sinusoidal displacement, a laser wavelengthλ0=785 nm andC=1.5 (in blue
line) with its corresponding phaseΦ0(in red) and (c) staircase phaseΦstair.
when Φ0(t) crosses one PQL which can be either Φ0R(k) or Φ0F (k). Further, due to the data acquisition system used, thesetn are quantized Q (tn) with a time resolution of 1/fs
(where fsis the sampling frequency) to finally generate
non-uniform samples (NUS) [Q (tn) , Φ (tn)]. As shown in [23],
D(t) can be reconstructed from these samples if the quanti-zation sampling rate of D(t) exceeds twice D(t) bandwidth (Nyquist criterion). In addition, to be further processed, these [Q (tn) , Φ (tn)] sets are usually fed to an interpolator to
generate a uniformly sampled rate output signal. However, for sub-λ0/2 displacements, none or only one level crossing
(depending on the initial phase value ofΦF ) can be detected thereby leading to a poor displacement reconstruction. C. Advantages of Dithering
Here, phase ditherΦd (resulting in an equivalent
Displace-ment ditheringDd(t)) is used for two main reasons: • retrieve sub-λ/2 displacements.
• remove theΔΦ effect on the reconstructed displacement. In a manner similar to approaches used in NUS ADCs, a phase ditherΦdcan be added to the phaseΦ0so that both the number
of crossed levels as well as the rate of level crossings can be increased. The resulting equivalent displacementDΣ(t) is obtained by summing the target displacementD (t) to Dd(t).
Φd can be implemented either by directly vibrating the laser
itself withDd(t) or indirectly by modulating the laser driving
current, thereby modulating λ0. Here, a sinusoidal equivalent vibration dithering obtained via current modulation has been chosen with an amplitudeAd and a frequencyfd. To achieve an accurate displacement reconstruction and fulfill the Nyquist criterion,fdandAdare chosen to be respectively greater than
0 0.005 0.01 0.015 -0.5 0 0.5 Rough SM Signal (V) 0 0.005 0.01 0.015 Time (s) -0.02 0 0.02 Recovered SM Signal (V) a) b)
Fig. 3. Measured rough SM signal (a) obtained for a target vibrating at
fv= 10 Hz with a 150 nm amplitude. A dithering current signal modulates
the LD drive current at 100 Hz. Note that the optical ouput power is directly modulated by the LD current dithering signal. In (b), recovered SM signal from a) after filtering out the dithering signal.
the bandwidth of interest and than λ0/2 (to induce at least two level crossings).
From the NUS samples, as previously mentioned, to achieve the reconstruction of D (t), interpolators are required to con-vert these NUSs into uniform samples. Different interpolators can be employed such as: splines, polynomials [23], sinc-based polynomials [24]... Here, both the Consecutive Samples based Unwrapping (CSU) approach [11] that consists in adding the normalized SM signal to the staircase approximation Φstair
of Φ0 based on [Q (tn) , Φ (tn)], and the Spline method are
used as interpolators and their achieved performances will be compared in the Results section.
Finally, regarding the impact of ΔΦ on the reconstructed displacement, it is interesting to look at this issue from a different perspective. Instead of considering the PQLs Φ0R andΦ0F to be different, they can be supposed to be equal if a virtual square displacement of amplitude λ0ΔΦ/8π is added on top of D(t). In presence of a dithering signal, the change of direction of this virtual square will occur atfd, which is out
of the signal bandwidth of interest. Consequently, ΔΦ has a direct impact on the retrieved amplitude of the dithering signal Dd but none on the desired displacementD (t).
III. RESULTS
A SM test bench was developed to assess the performances of the proposed approach through two main test procedures. The aim of the first one is to verify the principle of dithering. In this case, the target generates both the dithering displace-ment at 100 Hz and the sub-λ0/2 displacement while no
current modulation (ILD = I0) is performed. In the second
case, as a proof of concept, the target only generates the sub-λ0/2 displacement to be recovered while the LD driving current is modulated at 100 Hz (ILD(t) = I0 + Id(t)) to generate the dithering signal. The LD, driven by I0=20 mA,
101 102 101 102 Measured Displacement (nm) Current Dithering PZT Dithering 101 102 PZT Displacement (nm) -20 0 20 40 | | (nm) Current Dithering PZT Dithering
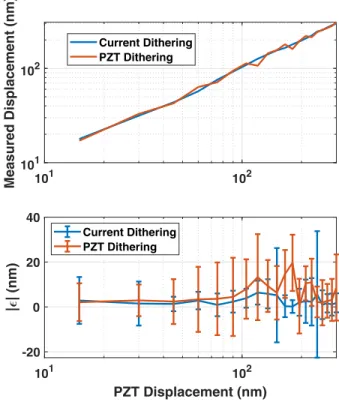
Fig. 4. Measured sub-λ/2 displacement amplitude at the target vibrating
frequency with LD at 50 cm from the PZT using the Spline interpolator via FFT analysis : (1) in red line, PZT is used both as the target vibrating at 10 Hz and as the dithering reference vibration at 100 Hz and (2) in blue line, the LD driving current is modulated to generate the dithering vibration at 100 Hz. The lower plot presents the absolute error results between the reconstructed displacement amplitude and the reference motion provided by PZT’s integrated capacitive sensor. The vertical error bars represent the standard deviation obtained for 20 measurements
is emitting at λ0=1550 nm. A piezoelectric transducer (PZT) from Physik Instrumente (P753.1CD) is used as a target positioned at 50 cm from the LD. It is equipped with an internal capacitive feedback position sensor with a 0.1 nm resolution and±1 nm repeatability. The laser beam is focused on the PZT via a lens. The data is acquired by a NI USB 6251 data acquisition system operating at106sample/s with a 16 bit resolution.
Here, the data is firstly processed to remove the LD power modulation induced by Id(t) [3] (Fig. 3 a)). This is simply
obtained by filtering out this unwanted signal at the frequency fd from the SM signal FFT spectrum (Fig. 3 b)). Note also
that the applied dithering signal induces 5 NEQLs (Fig. 3 b)). Then, a simple fringe detection algorithm (using the derivative of SM signal [6]) is applied on the recovered SM signal to generate the non-uniform sample set[Q (tn) , Φ (tn)].
From this set, using the NUS method (and using either the spline or the CSU as interpolator), a first estimate of DΣ is achieved. Then, an FFT analysis is performed to filter out from this reconstructed displacement DΣ all the signals out of the bandwidth of interest (f > fd). Fig. 4 shows the measured amplitude of the displacement extracted from the SM signal acquired during 1 s in order to retrieve the
sub-101 102 101 102 Measured Displacement (nm) Spline interpolator CSU interpolator 101 102 PZT Displacement (nm) -20 0 20 40 | | (nm) Spline interpolator CSU interpolator
Fig. 5. Impact of type of interpolation: measured sub-λ/2 displacement
amplitude at the target vibrating frequency with LD at 50 cm from the PZT using the Spline (blue line) and CSU (red line) interpolator via FFT analysis. PZT is used as the target vibrating at 10 Hz and the LD driving current is modulated to generate the dithering vibration at 100 Hz. The lower plot presents the absolute error results between the reconstructed displacement amplitude and the reference motion provided by PZT’s integrated capacitive sensor. The vertical error bars represent the standard deviation obtained for 20 measurements
λ0/2 displacement of a target vibrating at fv=10 Hz while the
dithering vibration is set atfd=100 Hz. For each displacement amplitude, 20 sets of measurement are performed.
Fig. 4 shows that the proposed method can correctly recover sub-λ0/2 displacement while the LD operates in the moderate
feedback regime. Further, the results obtained with the current and mechanical dithering are similar. The average RMS error is approximately 8 nm and 11.5 nm for the current- and mechanical-dithering respectively.
Fig. 5 compares the performances obtained between the spline and CSU interpolators. The performances obtained with spline appear to be better with an absolute maximum error of 7 nm compared to 36 nm with the CSU interpolator while both achieved a similar average rms error of 8 nm. This can be explained by the fact that the measured SM signal is quite noisy as shown in Fig. 3 b). As opposed to the case of spline interpolator in which only the detected SM signal discontinuities are used, for the CSU interpolator, scaled SM signal is directly added to reconstructed staircase phase. Thus, CSU based interpolation performance is affected by this added noise.
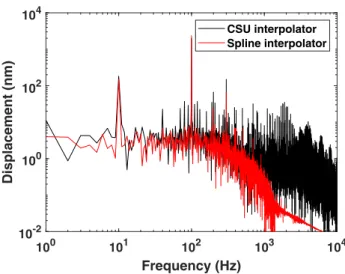
Fig. 6 shows a typical spectrum of the reconstructed dis-placement signal together with the dithering signal when using
100 101 102 103 104 Frequency (Hz) 10-2 100 102 104 Displacement (nm) CSU interpolator Spline interpolator
Fig. 6. FFT of the reconstructed displacement obtained with the spline (red line) and CSU (black) interpolation for a 10 Hz target vibration with a 150 nm amplitude and a 100 Hz dithering signal obtained by current modulation.
the CSU and spline interpolation. With the present set-up, the measured white noise power spectral density is approximately 3.4 nm/√Hz.
IV. CONCLUSION
We propose to interpret OFI as a non-uniform event based sampling system where the quantization levels are clearly defined by the signal discontinuities in the moderate optical feedback regime. A major result obtained by applying this NUS theory on SM signals consists in demonstrating that displacements can be successfully reconstructed from SM fringe detection only. In addition, based on the NUS theory, it was shown that by adding a laser diode current modulation based dithering signal, it was possible to successfully recover sub-λ0/2 displacements without knowing C. It was also demonstrated that both Spline and CSU can be used as efficient interpolators.
As a result, the proposed sensor can measure sub-λ0/2 displacement and achieve a high precision with a noise power spectral density ≈ 3.4 nm/√Hz while based on both a relatively simple set-up and processing method compared to [15].
By directly removing most of the optical power modulation induced by the current modulation of the LD via hardware circuits, we expect to further improve the noise performances that can be achieved by the system. In addition, based on the NUS theory, the instants when quantization levels are crossed contain all the information. It is thus possible to envision the development of a system based only on fringe detection using an analog front-end similar to [25] and then process the acquired data. As a result, the amount of acquired data to be processed can be much less than that of a classical approach based on an ADC front-end, resulting in simpler and cheaper embedded monitoring systems.
ACKNOWLEDGMENT
The authors would like to thank Agence Nationale de la Recherche (ANR) : LabCom CapIRO in cooperation with ACOEM, Thierry MAZOYER
REFERENCES
[1] S. Donati, “Developing self-mixing interferometry for instrumentation and measurements,” Laser & Photonics Reviews, vol. 6, no. 3, pp. 393– 417, 2012.
[2] T. Taimre, M. Nikoli´c, K. Bertling, Y. L. Lim, T. Bosch, and A. D. Raki´c, “Laser feedback interferometry: a tutorial on the self-mixing effect for coherent sensing,” Adv. Opt. Photon., vol. 7, no. 3, pp. 570–631, Sep 2015.
[3] G. Giuliani, S. Bozzi-Pietra, and S. Donati, “Self-mixing laser diode vibrometer,” Measurement Science and Technology, vol. 14, no. 1, pp. 24–32, nov 2002.
[4] Z. Wei, W. Huang, J. Zhang, X. Wang, H. Zhu, T. An, and X. Yu, “Obtaining scalable fringe precision in self-mixing interference using an even-power fast algorithm,” IEEE Photonics Journal, vol. 9, no. 4, pp. 1–11, Aug 2017.
[5] C. Jiang, C. Li, S. Yin, and Z. Huang, “Multiple self-mixing interferom-etry algorithm based on phase modulation for vibration measurement,” Optical and Quantum Electronics, vol. 49, no. 3, p. 111, Feb 2017. [6] C. Bes, G. Plantier, and T. Bosch, “Displacement measurements using
a self-mixing laser diode under moderate feedback,” IEEE Transactions on Instrumentation and Measurement, vol. 55, no. 4, pp. 1101–1105, Aug 2006.
[7] O. D. Bernal, U. Zabit, and T. Bosch, “Study of laser feedback phase under self-mixing leading to improved phase unwrapping for vibration sensing,” IEEE Sensors Journal, vol. 13, no. 12, pp. 4962–4971, Dec 2013.
[8] Y. Fan, Y. Yu, J. Xi, and J. F. Chicharo, “Improving the measurement performance for a self-mixing interferometry-based displacement sens-ing system,” Appl. Opt., vol. 50, no. 26, pp. 5064–5072, Sep 2011. [9] A. L. Arriaga, F. Bony, and T. Bosch, “Real-time algorithm for
ver-satile displacement sensors based on self-mixing interferometry,” IEEE Sensors Journal, vol. 16, no. 1, pp. 195–202, Jan 2016.
[10] S. Merlo and S. Donati, “Reconstruction of displacement waveforms with a single-channel laser-diode feedback interferometer,” IEEE Jour-nal of Quantum Electronics, vol. 33, no. 4, pp. 527–531, April 1997. [11] A. Ehtesham, U. Zabit, O. D. Bernal, G. Raja, and T. Bosch, “Analysis
and implementation of a direct phase unwrapping method for dis-placement measurement using self-mixing interferometry,” IEEE Sensors Journal, vol. 17, no. 22, pp. 7425–7432, Nov 2017.
[12] U. Zabit, O. D. Bernal, S. Amin, M. F. Qureshi, A. H. Khawaja, and T. Bosch, “Spectral processing of self-mixing interferometric sig-nal phase for improved vibration sensing under weak-and moderate-feedback regime,” IEEE Sensors Journal, vol. 19, no. 23, pp. 11 151– 11 158, December 2019.
[13] D. Melchionni, A. Magnani, A. Pesatori, and M. Norgia, “Development of a design tool for closed-loop digital vibrometer,” Appl. Opt., vol. 54, no. 32, pp. 9637–9643, Nov 2015.
[14] A. Magnani, D. Melchionni, A. Pesatori, and M.
Nor-gia, “Self-mixing digital closed-loop vibrometer for high
accuracy vibration measurements,” Optics Communications,
vol. 365, pp. 133 – 139, 2016. [Online]. Available:
http://www.sciencedirect.com/science/article/pii/S0030401815303394 [15] F. J. Azcona, R. Atashkhooei, S. Royo, J. M. Astudillo, and A. Jha, “A
nanometric displacement measurement system using differential optical feedback interferometry,” IEEE Photonics Technology Letters, vol. 25, no. 21, pp. 2074–2077, Nov 2013.
[16] M. C. Giordano, S. Mastel, C. Liewald, L. L. Columbo, M. Brambilla, L. Viti, A. Politano, K. Zhang, L. Li, A. G. Davies, E. H. Linfield, R. Hillenbrand, F. Keilmann, G. Scamarcio, and M. S. Vitiello, “Phase-resolved terahertz self-detection near-field microscopy,” Opt. Express, vol. 26, no. 14, pp. 18 423–18 435, Jul 2018. [Online]. Available: http://www.opticsexpress.org/abstract.cfm?URI=oe-26-14-18423
[17] W. Xia, Q. Liu, H. Hao, D. Guo, M. Wang, and
X. Chen, “Sinusoidal phase-modulating self-mixing interferometer with nanometer resolution and improved measurement velocity range,” Appl. Opt., vol. 54, no. 26, pp. 7820–7827, Sep 2015. [Online]. Available: http://ao.osa.org/abstract.cfm?URI=ao-54-26-7820
[18] O. D. Bernal, U. Zabit, and T. Bosch, “Classification of laser self-mixing interferometric signal under moderate feedback,” Appl. Opt., vol. 53, no. 4, pp. 702–708, Feb 2014.
[19] A. Magnani, A. Pesatori, and M. Norgia, “Self-mixing
vibrometer with real-time digital signal elaboration,” Appl. Opt., vol. 51, no. 21, pp. 5318–5325, Jul 2012. [Online]. Available: http://ao.osa.org/abstract.cfm?URI=ao-51-21-5318
[20] G. Plantier, C. Bes, and T. Bosch, “Behavioral model of a self-mixing laser diode sensor,” IEEE Journal of Quantum Electronics, vol. 41, no. 9, pp. 1157–1167, Sep. 2005.
[21] N. Sayiner, H. V. Sorensen, and T. R. Viswanathan, “A level-crossing sampling scheme for a/d conversion,” IEEE Transactions on Circuits and Systems II: Analog and Digital Signal Processing, vol. 43, no. 4, pp. 335–339, April 1996.
[22] T. Wang, D. Wang, P. J. Hurst, B. C. Levy, and S. H. Lewis, “A level-crossing analog-to-digital converter with triangular dither,” IEEE Transactions on Circuits and Systems I: Regular Papers, vol. 56, no. 9, pp. 2089–2099, Sep. 2009.
[23] F. Marvasti, Nonuniform sampling: theory and practice. Springer US,
2001.
[24] C. Vezyrtzis and Y. Tsividis, “Processing of signals using level-crossing sampling,” in 2009 IEEE International Symposium on Circuits and Systems, May 2009, pp. 2293–2296.
[25] A. A. Siddiqui, U. Zabit, O. D. Bernal, G. Raja, and T. Bosch, “All analog processing of speckle affected self-mixing interferometric signals,” IEEE Sensors Journal, vol. 17, no. 18, pp. 5892–5899, Sep. 2017.