HAL Id: hal-02627265
https://hal.inrae.fr/hal-02627265
Submitted on 26 May 2020
HAL is a multi-disciplinary open access
archive for the deposit and dissemination of
sci-entific research documents, whether they are
pub-lished or not. The documents may come from
teaching and research institutions in France or
abroad, or from public or private research centers.
L’archive ouverte pluridisciplinaire HAL, est
destinée au dépôt et à la diffusion de documents
scientifiques de niveau recherche, publiés ou non,
émanant des établissements d’enseignement et de
recherche français ou étrangers, des laboratoires
publics ou privés.
Distributed under a Creative Commons Attribution| 4.0 International License
using parameters derived from measurements of leaf gas
exchange and of chlorophyll a fluorescence
Laurent Urban, Jawad Aarrouf, Luc Bidel
To cite this version:
Laurent Urban, Jawad Aarrouf, Luc Bidel. Assessing the effects of water deficit on photosynthesis
using parameters derived from measurements of leaf gas exchange and of chlorophyll a fluorescence.
Frontiers in Plant Science, Frontiers, 2017, 8, 18 p. �10.3389/fpls.2017.02068�. �hal-02627265�
doi: 10.3389/fpls.2017.02068
Edited by: Edmundo Acevedo, Universidad de Chile, Chile Reviewed by: Thomas D. Sharkey, Michigan State University, United States Carmen Arena, University of Naples Federico II, Italy *Correspondence: Laurent Urban laurent.urban@univ-avignon.fr
Specialty section: This article was submitted to Plant Breeding, a section of the journal Frontiers in Plant Science Received: 30 August 2017 Accepted: 20 November 2017 Published: 14 December 2017 Citation: Urban L, Aarrouf J and Bidel LPR (2017) Assessing the Effects of Water Deficit on Photosynthesis Using Parameters Derived from Measurements of Leaf Gas Exchange and of Chlorophyll a Fluorescence. Front. Plant Sci. 8:2068. doi: 10.3389/fpls.2017.02068
Assessing the Effects of Water
Deficit on Photosynthesis Using
Parameters Derived from
Measurements of Leaf Gas Exchange
and of Chlorophyll a Fluorescence
Laurent Urban
1*, Jawad Aarrouf
1and Luc P. R. Bidel
21UMR 95 Qualisud/Laboratoire de Physiologie des Fruits et Légumes, Université d’Avignon, Avignon, France,2INRA, UMR
1334 AGAP, Montpellier, France
Water deficit (WD) is expected to increase in intensity, frequency and duration in many
parts of the world as a consequence of global change, with potential negative effects on
plant gas exchange and growth. We review here the parameters that can be derived from
measurements made on leaves, in the field, and that can be used to assess the effects
of WD on the components of plant photosynthetic rate, including stomatal conductance,
mesophyll conductance, photosynthetic capacity, light absorbance, and efficiency of
absorbed light conversion into photosynthetic electron transport. We also review some
of the parameters related to dissipation of excess energy and to rerouting of electron
fluxes. Our focus is mainly on the techniques of gas exchange measurements and of
measurements of chlorophyll a fluorescence (ChlF), either alone or combined. But we
put also emphasis on some of the parameters derived from analysis of the induction
phase of maximal ChlF, notably because they could be used to assess damage to
photosystem II. Eventually we briefly present the non-destructive methods based on
the ChlF excitation ratio method which can be used to evaluate non-destructively leaf
contents in anthocyanins and flavonols.
Keywords: water deficit, photosynthesis, chlorophyll a fluorescence, leaf gas exchange, stomatal conductance, tolerance mechanisms, induction curves of maximal chlorophyll fluorescence
INTRODUCTION
Water deficit (WD) is expected to increase in intensity, frequency and duration in many parts of the
world, notably in Africa, Asia and Central and South America, as a consequence of climate change
(
IPCC, 2014
). WD is generally perceived as negative for plants basically because it can lead to stress
which may in turn threaten plant survival. More commonly, WD impairs plants’ photosynthetic
rate and growth, thus potentially disturbing balances existing between species competing in natural
habitats (
Smith and Huston, 1990; Nambiar and Sands, 1993
) while reducing plant productivity in
cropping systems (
Boyer, 1982
). The latter issue has received much attention because decreases in
crop productivity challenge food security (
Hanjra and Qureshi, 2010
). Besides, reduced production
of photosynthetic products may also impair osmotic adjustment and the capacity of plants to cope
with drought (
Blum, 2017
). Dealing with the negative effects of WD on growth and productivity
will require, among others, being able to assess the way WD impacts photosynthesis, and to
interpret plants’ responses correctly within integrated views of
their strategies. Of course, the issue of the impact of WD
on growth and productivity is a complex one that cannot be
reduced to a simple negative effect on photosynthesis, since
WD may impact also developmental processes. The latter, not
only the former, are involved in productivity (e.g., flowering and
fruiting). Despite these limitations, leaf photosynthesis analysis
remains pivotal in all WD studies. Moreover, it is quite clear
that plants experience multiple stress situations in natural or
field conditions, and that their responses to a combination of
stresses cannot be extrapolated simply from separate studies
of individual stresses (
Mittler, 2006
). In the case of WD there
is at least the need to take into account the light conditions.
Eventually, it is important not to forget that in addition to
net photosynthetic CO
2assimilation per unit area and time
(A
net), leaf area and distribution, as well as mitochondrial
respiration are also important for growth and production.
Mitochondrial respiration may not only contribute to significant
carbon losses, especially under stress conditions, reducing the
net carbon gain (
Van Oijen et al., 2010; Sperlich et al., 2015
),
it is also a key regulator of the energy status of plants under
stress.
A
netis determined by stomatal conductance (g
s) and
mesophyll conductance (g
m), which determine CO
2supply
to carboxylation sites, and also by the photosynthetic
metabolic potential (A
pot), which determines the capacity
of the photosynthetic machinery to process CO
2. A
potdepends
on the amount and activities of the components of the
light-harvesting, the electron transport and the energy-transduction
processes, as well as by the carbon metabolism components,
including such enzymes as the Rubisco and processes like RUBP
synthesis by the Calvin cycle (
Lawlor and Cornic, 2002; Flexas
et al., 2004; Chaves et al., 2009; Lawlor and Tezara, 2009
). Mild
WD decreases A
netvia a reduction in g
s. In low light conditions,
photosynthetic activity, notably electron transport and NADP
+reduction are maintained. But in high light conditions, since
A
netdoes not increase, an imbalance between energy capture
and energy use by photochemistry occurs, leading to a decrease
in the rate of linear electron transport, downregulation of ATP
synthase activity, which allows to keep a high level of 1pH and
of energy dissipation (
Kanazawa and Kramer, 2002
), and the
triggering of alternative electron routes. These mechanisms may
not be efficient enough to prevent the formation of reactive
oxygen species (ROS) whereas scavenging mechanisms may be
overflown to the point of allowing accumulation of ROS.
Lawlor
and Tezara (2009)
hypothesized that the latter damage ATP
synthase, leading to a decrease in ATP and consequently in RuBP
synthesis by the Calvin cycle, and eventually Rubisco activity. In
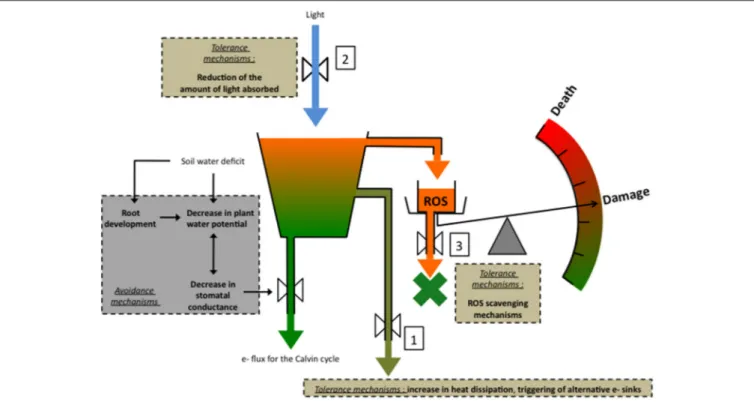
case of severe stress, damage can even lead to death (Figure 1).
This paper has not the ambition to provide a full and
detailed review of the consequences of drought on photosynthesis
(see
Lawlor and Tezara, 2009; Pinheiro and Chaves, 2011
for instance) and on growth (
Farooq et al., 2009
), but to
provide a review of those parameters related to photosynthesis
that can be derived from measurements of gas exchange and
chlorophyll a fluorescence (ChlF) that are performed on leaves,
in the field. Recently, a new generation of fluorimeters was
made available that provide the high time resolution needed
for performing measurements of fast ChlF induction kinetics.
Parameters derived from analysis of the so-called OJIP transients
are used to analyze the response of PSII to stress, but some of
them may also be used as indicators of energy use efficiency,
photoinhibition and even damage (
Ripoll et al., 2016b
). We shall
put some emphasis on them in this review. Marginally we shall
invoke also a few parameters of remote sensing which could be
used in complement or as substitutes.
For readers not familiar with ChlF measurements, there are
three major classes of instruments. The first class encompasses
devices based on the concept of a single turnover flash (STF), the
second class of instruments exploits a saturating pulse for analysis
of the induction curve of maximal ChlF (i.e., the analysis of
so-called OJIP transients) and the last one is designed to study steady
state fluorescence for quenching analysis and for coupled ChlF
and gas exchange measurements (
Kalaji et al., 2014
). In the first
class, STF devices provide among other things information on
the electron transfer reactions within PSII. Although potentially
useful to characterize responses to stress, they are not commonly
used in field studies and will therefore not be included in this
review. For the same reason we excluded thermoluminescence
(a delayed fluorescence that gives information on the occurrence
of recombination reactions in PSII as a function of the redox
state of the electron transport chain), as well as 77 K fluorescence
and fast and ultra-fast fluorescence. For the reader interested in
these techniques we suggest the following articles and reviews:
Shinkarev (2005)
for STF,
Misra et al. (2001)
and
Ducruet
and Vass (2009)
for thermoluminescence,
Goltsev et al. (2009)
for delayed fluorescence,
Srivastava and Strasser (1999)
and
Papageorgiou (2011)
for 77 K fluorescence, and
Holzwarth (2008)
and
Berera et al. (2009)
for fast fluorescence techniques. The
second class of instruments makes use of strong light pulses of
few 100 ms, to obtain information on the photosynthetic electron
transport chain (ETC), its reduction kinetics, Photosystem II
(PSII) antenna size and relative content of ETC components.
The instruments of the last class are designed to measure ChlF
intensity in the steady state, as affected by the redox state of
the ETC and by changes in the ChlF yield. The analysis of the
causes for yield changes is called quenching analysis. Modulated
light is used as a trick to separate the effect of actinic light that
drives photosynthesis and the low-intensity measuring light that
is used to probe the state of the photosynthetic system on the
measured ChlF intensity (
Kalaji et al., 2014
). Besides quenching
analysis, pulsed amplitude modulated fluorimeters can be used in
combination with gas exchange measurement systems to study
the interactions between the ETC, the Calvin-Benson cycle,
CO
2conductance and photorespiration. It is not our objective
here to provide the reader with the theoretical background, the
assumptions behind the models, and practical considerations of
all the techniques evoked in this review. Below is a very small
selection of papers and books among many readers who intend to
familiarize themselves with these techniques may find useful:
(i) for gas exchange measurements (
von Caemmerer and
Farquhar, 1981; Nobel, 2009
);
(ii) for
OJIP
transient
measurements,
performed
on
dark-adapted leaves (
Stirbet, 2011; Kalaji et al., 2014;
Goltsev et al., 2016
).
FIGURE 1 | A simplified representation of the major tolerance mechanisms against drought-associated photooxidative stress in conditions of high light. Avoidance mechanisms are also represented: (1) decreasing plant water potential (9) improves plant capacity to remove water from the drying soil, whereas (2) decreasing stomatal conductance (gs), exerts a positive effect on the plant water content by saving water. (3) root development increases plant capacity to take up water and therefore to maintain a high water content. In high light conditions, the decrease in gsentails a decrease in the quantity of CO2entering the leaf, therefore creating an
imbalance between the energy capture and energy use by photochemistry. The risk for excess energy to form potentially damaging reactive oxygen species (ROS) increases and must be mitigated by energy dissipation processes and the triggering of alternative e- sinks 1, and by processes aiming at decreasing the quantity of light entering the leaf 2. If these mechanisms fail to prevent ROS formation, the latter can be eliminated by ROS scavenging processes 3. In the case these mechanisms are insufficient, ROS can damage notably ATP synthase, leading to a decrease in RuBP synthesis and Rubisco activity. Eventually damage may lead to death.
(iii) for
steady
state
fluorescence
measurements
under
modulated light (
Maxwell and Johnson, 2000; Logan
et al., 2007; Murchie and Lawson, 2013; Kalaji et al., 2014
).
We shall now put in perspective the parameters derived notably
from measurements of leaf gas exchange and ChlF, by considering
successively g
s, g
m, the components of photosynthetic capacity,
light absorbance, efficiency of absorbed light conversion into
photosynthetic electron transport, rerouting of electron fluxes
and dissipation of excess energy. We shall then present the
ChlF techniques that can be used to assess leaf concentrations
in anthocyanins and flavonols, which may play a role as
antioxidants, and eventually review the parameters that could be
used to analyze photodamage. The symbols used in this review
are listed in Tables 1, 2. Specific portable field measurement
systems are mentioned but we have not the ambition here to
provide an exhaustive list.
STOMATAL CONDUCTANCE (g
S
)
Whereas decreasing plant water potential and stimulating root
development both result in increased water uptake, stomatal
closure results in improved plant water balance and water status
by acting on the other end of the water flux chain, namely
by limiting transpiration losses. Stomatal functioning has been
extensively studied (
Damour et al., 2010
) and it emerges that
g
sis arguably the most relevant among all indicators of WD
and even plant stress in general. It is certainly one of the first
parameters to be affected by WD. Plants can close stomata within
minutes upon exposure to WD, thus very efficiently preventing
excessive water loss that could endanger them. Stomata represent
the major point of control of water fluxes in the so-called
soil-plant-atmosphere continuum. Stomatal resistance to water vapor
diffusion is indeed the major resistance along the pathway of
water from the soil to the atmosphere. Unfortunately stomatal
closure may come at a price, which is a limitation to CO
2uptake
into chloroplasts, a decrease therefore in photosynthesis and
growth, and consequently also an increase in the risk of
photo-oxidative stress, i.e., the production of potentially damaging and
sometimes lethal ROS. It is true that a small decrease in g
simpacts transpiration more than photosynthesis (
Nobel, 1999
)
but, in case of more severe drought or in conditions of high light,
photosynthesis is inevitably reduced while the risk of
photo-oxidative stress increases. To complete the complex picture of
stomatal functioning and roles, one must be reminded that
stomatal closure, by helping to maintain plant water status,
TABLE 1 | List of symbols.
Agross, Anet Gross and net photosynthetic rate
Amax Maximal rate of net photosynthesi
Apot Photosynthetic metabolic potential
ATP Adenosine triphosphate CET Cyclic electron transport ChlF Chlorophyll fluorescence
Cc CO2concentration at the carboxylation site
Ci Intercellular CO2concentration CWSI Crop water stress index ETC Electron transport chain F′
o, F′m Minimal and maximal values of ChlF of light-adapted leaves
gm Mesophyll conductance gs Stomatal conductance J, JT, ETR Electron transport rate
JA Electron transport rate for alternative sinks JC Electron transport rate for carboxylation JO Electron transport rate for oxygenation Jmax Light-saturated electron transport rate
LUE Light use efficiency
Na Leaf nitrogen content per unit leaf area
Nm Leaf nitrogen content expressed on leaf mass basis
NADPH Nicotinamide adenosine diphosphate (reduced) NDH NADH dehydrogenase-like
NPQ Non photochemical quenching OEC Oxygen evolving complex PC, PQ Plastocyanins, Plastoquinones PRI Photochemical Reflectance Index PSII Photosystem II
Q Photosynthetically active flux density
Rd Rate of mitochondrial respiration in the presence of light Rn Rate of mitochondrial respiration in the absence of light
ROS Reactive oxygen species
Rubisco Ribulose 1,5-diphosphate carboxylase, oxygenase RuBP Ribulose 1,5-diphosphate
SPS Sucrose phosphate synthase STF Single turnover flash Ta Air temperature
Tc Canopy temperature
TPU Triose-phosphate utilization
YNO Quantum yield of non-light induced NPQ of ChlF YNPQ Quantum yield of light induced NPQ of ChlF
Vcmax Maximal carboxylation rate of Rubisco
WD Water deficit
α Initial quantum efficiency of PSII 8PSII Efficiency of absorbed light conversion θ Leaf absorbance
Ŵ Light compensation point Ŵ* CO2compensation point
τ Specificity factor of Rubisco
The symbols for the so-called OJIP parameters are presented in Table 2.
mitigates the drought-associated decrease in plant water potential
and therefore the capacity of plants to extract water from a
dehydrating soil. It is easy to understand that the ambivalent and
pivotal roles of stomata explain why stomatal functioning is such
TABLE 2 | Definition of some common OJIP/OKJIP parameters (after Strasser et co-workers), including F0, Fm, Fv,and Fv/Fm.
Parameter Definition
F0 Initial value of ChlF, generally taken at 20 or 50 µs (O-level)
Fk ChlF value at 300 µs (K-level) Fj ChlF value at 2 ms (J-level)
Fi ChlF value at 30 ms (I-level)
Fm Maximum value of ChlF under saturating light (P-level)
Fv=Fm- F0 Maximum variable ChlF
Fv/Fm Maximum quantum yield of primary PSII
chemistry
Vk=(Fk- F0)/Fv Relative variable ChlF at 300 µs
Vj=(Fj- F0)/Fv Relative variable ChlF at 2 ms
Vi=(Fi- F0)/Fv Relative variable ChlF at 30 ms
M0=4 ms−1.Vk Initial slope of relative variable ChlF for F0 taken at 50 µs
Area Area between the OJIP/OKJIP curve and the Fmline
Sm=Area/Fv Normalized area
N = Sm/(M0/Vj) Turnover number
JABS=JTR+JDI Rate of photon absorption by PSII antenna (absorbed photon flux)
JTR0 Maximum, initial rate of exciton trapping by all PSII reaction centers (maximum trapped exciton flux)
JDI Rate of energy dissipation in PSIIs by
processes other than trapping (dissipated energy flux)
JET2
0 Electron transport flux from protein protein
QAto protein QB
JRE1
0 Electron transport flux until PSI acceptors
(at 30 ms)
JABS/RC = (M0/Vj)/(Fv/Fm) Average absorbed photon flux per PSII reaction centers/apparent antenna size of an active PSII
JTR0 /RC = M0/Vj Maximum trapped exciton flux per PSII
JDI/RC = JABS/RC − JTR0 /RC Dissipated energy flux per PSII PIABS=
(RC/JABS).(Fv/F0).(1 − Vj)/Vj
Performance index for energy conservation from photons absorbed by PSII antenna to the reduction of protein QB
RC/JABS Contribution to the PI of the density of active reaction (in the sense of QA reducing) centers on a chlorophyll basis Fv/F0 Contribution to the PI of the light reactions
for primary photochemistry, i.e. the performance due to the trapping probability (1 - Vj)/Vj Contribution to the PI of the dark reactions, or, in other words, the performance due to the conversion of excitation energy to photosynthetic electron transport PITOTABS=PIABS.(1 – Vi)/(Vi- Vi) Performance index for energy conservation
from photons absorbed by PSII antenna until the reduction of PSI acceptors
a highly integrated and regulated process in plants (
Damour et al.,
2010
).
Leaf g
sis commonly measured in the field using portable gas
TABLE 3 | Brief overview of the major types of portable devices commonly used for field measurements of photosynthesis-related parameters.
Type of instrument Nature of measurements Typical parameters
Portable leaf gas exchange measurement systems
Steady state gas exchanges under controlled conditions
A-Ciresponse curves
A-Q curves
Anet, Amax, transpiration (measured ≪ directly ≫)
gs, Ci(calculated)
Rd(light off + correction)
Vcmax, Jmax, TPU, Ŵ* α, Ŵ
Modulated fluorimeter ChlF Fv/Fm, Fo(on dark-adapted leaves)
F′
v/F′m, 8PSII(on light-adapted leaves)
NPQ, qP (quenching analysis) Jmax, α (8PSII-Q curves)
Coupled leaf gas exchange and modulated ChlF measurement systems
Steady state gas exchanges under controlled conditions + ChlF
In addition to all the above-mentioned parameters: gm, photorespiration and alternative routes for
e-flow
Modulated fluorimeter + dual wavelengths absorbance spectrometer
ChlF + P700 absorption Cyclic electron transport activity in addition to the usual parameters
Non modulated, high time resolution fluorimeter Fast ChlF induction kinetics Fv/Fm, Fo
So-called OJIP parameters (Table 2)
Modulated fluorimeter based on the excitation ratio method
ChlF at different excitation wavelengths [anthocyanins], [flavonols]
Chlorophyll meter Leaf transmittance θ
for concomitant measurements of net exchange of CO
2in a
large range of photosynthetically active flux density (Q), CO
2concentration of the air, temperature and humidity. Portable
gas exchange measurement systems include the CIRAS-3 (PP
systems, Amesbury, USA), the GFS-3000 (Walz Gmbh, Effeltrich,
Germany), the LI-6400 and LI-6800 (LI-COR
R, Lincoln, USA)
and the iFL (Opti-sciences, Hudson, USA).
Leaf (or canopy) temperature can be measured as an
alternative to stomatal conductance as an indicator of WD
(
Jackson et al., 1981
). The idea is that when stomata close, the
cooling effect associated with transpiration is reduced, resulting
in an increase in leaf or canopy temperature. Leaf or canopy
surface temperatures can be measured easily through infrared
thermography. The measured temperatures can then be exploited
to calculate parameters such as the Leaf Temperature Difference
which corresponds to the difference in leaf temperature under
water-deficit and well-watered conditions. The Crop Water Stress
Index of
Idso et al. (1981)
and
Jackson et al. (1981)
is defined
as the difference between air and canopy temperature (T
aand
T
c, respectively), normalized for the evaporative demand as
determined by means of a lower limit LL (the case of a canopy
transpiring at its potential rate) and an upper limit UL (a
non-transpiring canopy):
CWSI = [(T
c−
T
a) − (T
c−
T
a)
LL]/[(T
c−
T
a)
UL−(T
c−
T
a)
LL]
(1)
The CWSI has to be calculated under clear sky conditions.
It proved capable of predicting stress in plants 1–2 days
before visual detection (
Kacira et al., 2002
). There are several
methodological difficulties associated with the CWSI, including
a high sensitivity to windy conditions. Other available indexes
are the Temperature–Vegetation Dryness Index of
Sandholt et al.
(2002)
or the Temperature Vegetation Index of
Prihodko and
Goward (1997)
. Generally, it can be said that, despite the progress
of techniques and concepts, all these real-time, model-based
indexes, for all the advantages they provide, are still lacking
accuracy and require careful parameterization.
MESOPHYLL CONDUCTANCE (g
m
)
Mesophyll conductance determines CO
2supply from
sub-stomatal cavities to carboxylation sites. g
mhas anatomical and
physical characteristics, including CO
2solubility, the distribution
of chloroplasts, the surface of chloroplasts exposed to the
intercellular air space, surface area of intercellular spaces, walls
and cytosol, and dimensions of the intercellular spaces which
change as tissues and cells shrink with WD (
Lawlor and Tezara,
2009; Tomas et al., 2013
). The conductance through the liquid
phase is generally believed to be the most limiting factor for CO
2diffusion in the mesophyll for many species (
Flexas et al., 2012
).
g
mcan change rapidly and independently of leaf anatomy, for
instance it can decrease as a consequence of soil WD (
Warren,
2008
), supporting the view that g
mis also biochemical in nature.
g
mdepends on carbonic anhydrase activity, which facilitates CO
2transfer to Rubisco active sites, and has a metabolic component
associated with aquaporins, which may act as CO
2channels
(
Mori et al., 2014
). Of course, g
mcan also decrease as a long-term
response to WD (
Gu et al., 2012; Han et al., 2016
).
For years the importance of g
mhas been underestimated in
ecological and agronomical studies. Nowadays the quantitative
importance of g
min the control of photosynthesis has been
well established but there are still ongoing controversies
about estimation techniques. g
mcan be estimated from joint
measurements of gas exchange and chlorophyll fluorescence
(Table 3), a common feature of the portable systems available on
the market, using the constant electron transport rate (J) method
(
Bongi and Loreto, 1989; Harley et al., 1992
), or the variable J
method (
Di Marco et al., 1990; Harley et al., 1992
). g
mcan also
be estimated by the carbon isotope method (
Evans et al., 1986;
von Caemmerer and Evans, 1991; von Caemmerer et al., 2014
),
and by the so-called A-C
icurves fitting methods (
Dubois et al.,
2007; Sun et al., 2014; Sharkey, 2016
). Important methodological
difficulties are associated with evaluations of g
m(for a review see
notably
Warren and Dreyer, 2006; Pons et al., 2009; Tholen et al.,
2012
). There are all the more important that some assumptions
associated with g
mestimation in current A-C
icurve-fitting
methods introduce biases in fitting other model parameters.
In spite of these difficulties and of debates (
Warren, 2006;
Warren and Dreyer, 2006; Lawlor and Tezara, 2009; Buckley and
Warren, 2014
), g
mhas been going on fuelling a lot of interest
among researchers during the last decade. Recently,
Moualeu-Ngangue et al. (2017)
presented a new method to fit A-C
iand
8
PSII-C
icurves simultaneously. 8
PSIIrepresents the quantum
efficiency of photosystem II (PSII) in µmol electrons/µmol
photons absorbed by PSII (
Genty et al., 1989; Bilger et al., 1995
).
The newly described method of
Moualeu-Ngangue et al. (2017)
,
using the multiple phase flash approach for 8
PSII(
Loriaux et al.,
2013
), allows the estimation of the g
mdependence on C
i.
METABOLIC vs. DIFFUSIONAL
LIMITATIONS TO A
net
-EVALUATION OF
PHOTOSYNTHETIC CAPACITY
A decrease in A
netmust not systematically be interpreted as
a consequence of a drought-associated decrease in diffusional
limitations of CO
2supply to carboxylation sites, i.e., a decrease in
g
sor in the anatomical and physical components of g
m. Indeed,
A
netmay also decrease as a consequence of metabolic limitations.
An easy method to test the hypothesis of A
netlimitation not
associated to reduction in CO
2diffusion consists in using a high
concentration of CO
2(
Lawlor and Cornic, 2002
). If the
drought-associated decrease in A
netpersists in such conditions, this will be
considered as proof for the existence of non-diffusive limitations
of photosynthesis. One common way of addressing this issue
consists in measuring the maximal rate of net photosynthesis in
conditions of non-limiting light and CO
2(A
max). A non-diffusive
decrease in A
maxcan generally be attributed to a decrease
in one or more of the major components of photosynthetic
capacity, namely V
cmax, J
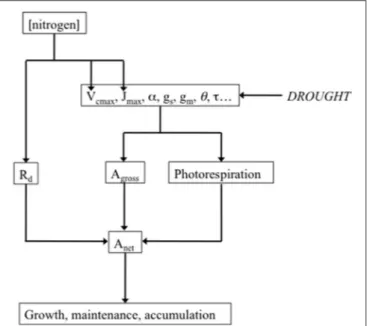
maxand TPU (Figure 2), the maximum
carboxylation rate, the light-saturated rate of electron transport
and triose-phosphate utilization, respectively (
Farquhar et al.,
1980, 2001; Harley P. C. et al., 1992
). V
cmaxis related to
Rubisco amount and activity, J
maxrepresents the limitation to
photosynthesis imposed by RuBP regeneration capacity, and
TPU the limitation to photosynthesis imposed by triose-P
utilization for starch and sucrose synthesis (
Sharkey et al., 1986;
Yang et al., 2016
). The impact of WD on the amount and
FIGURE 2 | Drought potential impact on the major parameters of the biochemical model of leaf photosynthesis, and their link with net photosynthesis (Anet). Drought potentially decreases the maximum
carboxylation rate (Vcmax), the light-saturated rate of electron transport (Jmax), the quantum efficiency of photosystem II (α), stomatal conductance to CO2
(gs), mesophyll conductance (gm), leaf absorbance (θ), the specificity factor of
Rubisco (τ ). All these parameters determine gross photosynthesis (Agross) and
photorespiration, which, in addition to mitochondrial respiration (Rd), in turn determine Anet. Measuring and analyzing all these parameters can help
understanding how drought impacts growth through Anet. The influence of
nitrogen on the determinants of photosynthetic capacity was represented as a reminder. Leaf nitrogen content expressed either on a leaf area (Na) or on a dry
matter (Nm) basis is generally well correlated with photosynthetic capacity
(Field and Mooney, 1983; Evans, 1989; Kellomäki and Wang, 1997; Walcroft et al., 1997; Urban et al., 2003; Urban and Léchaudel, 2005; Kattge et al., 2009).
activity of Rubisco has been studied extensively. For
Parry et al.
(2002)
drought can result can result in Rubisco deactivation.
Lawlor and Tezara (2009)
found that Rubisco activity is not very
well correlated to decreases in A
net. They consider that only
severe WD can impact the content in Rubisco whereas Rubisco
activity relates mainly on ATP status. There are numerous studies
showing the impact of drought on J
max. For instance,
Martin-StPaul et al. (2012)
, studying three population of Quercus ilex
in different sites, observed steeper declines of J
maxas predawn
leaf water potential declined in the wettest site compared with
the drier sites (
Flexas et al., 2004
). discussed the impact of WD
on sucrose phosphate synthase (SPS). SPS activity decreases as g
sdecreases and would translate into a decrease in TPU.
Damour
et al. (2008)
observed that photosynthetic capacity of leaves of
lychee trees submitted to long-term drought decreases reversibly
as a consequence reduced growth, sink activity, translocation and
phloem loading.
V
cmax, J
maxand TPU are commonly calculated using the
A-C
icurves (Table 3;
von Caemmerer and Farquhar, 1981;
Sharkey et al., 2007
). Several assumptions behind the model
underlying the A-C
icurves technique have been questioned and
optimizing fits has been an important objective for the last
years (
Ethier and Livingston, 2004; Dubois et al., 2007; Sharkey
et al., 2007; Gu et al., 2014; Duursma, 2015; Bellasio et al., 2016;
Moualeu-Ngangue et al., 2017
). Recently,
Buckley and
Diaz-Espejo (2015)
stressed that there are methodological difficulties
associated with J-Q submodels of photosynthesis, which result
in underestimating J
maxvalues. Alternative methods consist in
exploiting light response curves or in incorporating the J-Q
submodel directly into the photosynthesis model during the
fitting process. Also, obtaining A-C
icurves is a time-consuming
process because the leaf and gas exchange system is allowed
to reach a steady state at each new applied [CO
2]. Following
ideas of
Davis et al. (1987)
and observations of
McDermitt
et al. (1989)
,
Laisk and Oja (1998)
, and
Stinziano et al. (2017)
developed a novel A-C
iresponse technique, utilizing non-steady
state measurements of gas exchange. Exploiting the capacity of
the latest leaf gas exchange measurements systems to provide
rapid control and measurement of step-wise changes in reference
and sample [CO
2], they showed that it is possible to reduce to less
than 5 min the time necessary to determine A-C
iresponses.
In addition to the A-C
icurve method, J
maxcan be calculated
from measurements of ChlF following
Smith (1937)
and
Harley
P. C. et al. (1992)
.
Urban et al. (2008)
proposed to derive the
initial quantum efficiency of PSII (α) and J
maxfrom 8
PSII-Q curves (Table 3). So far, ChlF parameters derived from the
analysis of OJIP/OKJIP transients have not been exploited to
estimate photosynthetic capacity, and more specifically J
max. In
that prospect, it would certainly be interesting to evaluate the
total number of electrons transferred into the photosynthetic
electron transport chain (N), assuming that there is a strict
proportionality between N and S
m(
Stirbet, 2011
), where S
mrepresents the normalized area of the ChlF induction curve. The
high time resolution fluorimeters that can be purchased are either
associated to portable leaf gas exchange measurement systems,
like in the LI-6800, as stand-alone non modulated devices (like
the Pocket PEA and the Handy PEA of Hansatech), or as
stand-alone modulated devices such as the PAM-2500 of Walz or the
PAR-FluorPEN FP 100-MAX of Photon Systems Instruments.
LIGHT ABSORPTION BY LEAVES
Theoretically the capacity of the photosynthetic machinery to
process CO
2is determined firstly by its capacity to capture light
and to use absorbed energy by PSII (J
ABS).
J
ABS=
Q
∗θ
∗0.5
(2)
where J
ABSrepresents the rate of photon absorption by PSII
antennae, Q the incident photosynthetically active quantum flux
in µmol photons m
−2s
−1and θ the leaf absorbance. It is
generally accepted that 50% of Q is absorbed by PSII and 50%
by PSI.
Massantini et al. (1990)
observed a decrease in θ of
water-stressed Amaranthus leaves. A decrease in θ would indeed help
leaves to better cope with WD by reducing the amount of energy
absorbed by photosystems and therefore the associated risk of
photooxidative stress. There are few references about the effect
of WD on θ and all of them are not confirming that WD results
in a substantial decrease in θ (
Osuna et al., 2015
).
θ
may be estimated from the formula: 1–absorbance of red
light/absorbance of near infra-red light. Alternatively, θ can be
evaluated exploiting correlations with leaf chlorophyll content
(Table 3;
Bauerle et al., 2004; Urban et al., 2008
). One of the
most popular instruments is the Chlorophyll meter SPAD 502
R(Konica/Minolta, Osaka, Japan), which estimates leaf chlorophyll
content based on the ratio of leaf transmittance between
a chlorophyll non-absorbing wavelength and an absorbing
one. Two other chlorophyll meters provide similarly precise
and accurate measurements with different wavelength ratios.
CCM-200
Rfrom Opti-Sciences Inc. (Hudson, USA) uses an
equivalent transmittance ratio (653 and 931 nm) and Dualex
4
Rfrom Force-A (Orsay, France) uses a ChlF ratio (excited
at 375 and 650 nm) (
Cerovic et al., 2012
). At sub-meter scale,
an average chlorophyll content can also be estimated using
the FIELDSCOUT CM-1000
R(Spectrum Technologies Inc.,
Plainfield, USA).
Leaf light avoidance movements probably play an important
role in light absorption reduction, notably in the short term. They
could be monitored using imaging techniques. Clearly there is
ample room for future developments in that direction.
EFFICIENCY OF LIGHT CONVERSION
INTO PHOTOSYNTHETIC ELECTRON
TRANSPORT-PHOTOINHIBITION
The efficiency of absorbed light conversion, 8
PSII, determines,
in addition to the amount of absorbed light, J
ABS, the
photosynthetic electron flux, J
T(alias J or ETR).
J
T= 8
PSII∗J
ABS(3)
8
PSII=
F
′ v/F
′∗ mq
P(4)
where F
′v/F
′m
represents the quantum efficiency of so-called
“open” (oxidized) PSII reaction centers and q
P, photochemical
quenching, the proportion of open PSII centers (
Schreiber et al.,
1986; Maxwell and Johnson, 2000
).
F
v′=
F
m′−
F
0′(5)
where F
′mand F
′
0
represent the maximum value of ChlF under
saturating illumination and the minimal ChlF, respectively, of
light-adapted leaves.
F
′v/F
′
m
is correlated with the maximum quantum yield of
primary PSII photochemistry, F
v/F
m, and with α (
Urban and
Alphonsout, 2007
).
F
v=
F
m−
F
0(6)
where F
mrepresents the maximum value of ChlF under
saturating illumination, and F
0, the initial (minimal) value of
chlorophyll fluorescence, the level of fluorescence emission when
all the primary quinone acceptors (Q
A) are in the oxidized state,
and Demmig, 1987; Maxwell and Johnson, 2000; Roháçek, 2002
).
From a theoretical point of view, it is important to be aware that
one of the major assumptions behind the interpretation of the
fluorescence rise from minimal to maximal ChlF, including OJIP
transients analysis, is that variable fluorescence is determined
by the redox state of Q
A, the first quinone acceptor of PSII, as
originally proposed by
Duysens and Sweers (1963)
. See
Schansker
et al. (2014)
for a discussion about this hypothesis. From a
practical point of view what is important is to ensure that
both minimal and maximal ChlF are correctly measured. This
is also true for OJIP transient analysis since they depend on
normalizations that are very sensitive to the accuracy of the
determination of F
0and F
mvalues (
Kalaji et al., 2014
). For useful
considerations about dark adaptation, particularly in field trials
(see also
Kalaji et al., 2014
).
The F
v/F
mvalues average approximatively 0.83–0.84 in most
C3 plants (
Björkman and Demmig, 1987; Pfündel, 1998
). Even
though F
v/F
mis arguably one of the most commonly used
parameters derived from measurements of ChlF to assess plant
stress, notably photoinhibition, i.e., photosynthesis reduction
by excess of light, it remains generally unaffected by moderate
drought (
Genty et al., 1987; Tezara et al., 1999; Christen et al.,
2007; Oukarroum et al., 2007
). More severe WD may decrease
F
v/F
mvalues but, while substantial decreases in F
v/F
mare indeed
indicators of photo-damage, small decreases can be interpreted
in terms of photo-protection (
Adams et al., 2006
). Similarly,
a relatively moderate F
′v
/F
′m-associated decrease in 8
PSIImay
be interpreted as reduced risk of photo-oxidative stress. Even
damage to D1 protein under WD, which indeed translates into
lower values of q
Pand F
v/F
m(
Giardi et al., 1996
), can be seen
as “positive photo-inhibition” since damaged D1 proteins are
rapidly degraded and replaced.
In addition to the fluorimeters build in most recent
portable gaz exchange measurement systems, the user can use
dedicated modulated fluorimeter such as the FMS2 by Hansatech
instruments (King’s Lynn, UK), the Mini-PAM II by Walz, the
OS5+ by Opti-Sciences, or the FluorPen FP 100-MAX of Photo
Systems Instruments (Drasov, Czech Republic).
REROUTING OF ELECTRON FLUXES
(FIGURE 3)
Light reactions of photosynthesis convert the solar energy flux
into chemical energy in the form of NADPH and ATP, which
are needed for CO
2assimilation. In the case of drought, the
photosynthetic electron transport rate can be reallocated from
photosynthesis to photorespiration (
Noctor et al., 2002; Galmès
et al., 2007
). In cotton it was observed that photorespiration
increases as a consequence of drought (
Cornic and Fresneau,
2002; Ennahli and Earl, 2005; Massacci et al., 2008; Chastain
et al., 2014
) but decreases have also been observed (
Zhang et al.,
2011
). The glycolate oxidase and the Mehler peroxidase reactions
respectively lead to the production of substantial amounts of
H
2O
2(a lesser evil than
1O
2and O
.−2), either in peroxisomes
or chloroplasts (
Smirnoff, 1993; Noctor et al., 2002
). Catalase,
alongside several other enzymes and enzymatic systems, will then
eliminate H
2O
2.
See
Busch (2013)
for a review of the existing methods for
evaluating photorespiration. Both J
Cand J
O, the electron fluxes
for carboxylation and for oxygenation, respectively, can be
calculated using concomitant measurements of A
netand 8
PSII,
using portable gas exchange + ChlF measurement systems,
followed by measurements of R
d(
Valentini et al., 1995
). Prior
calibration of 8
PSIIat 1–2% O
2must however be done (
Genty
et al., 1989
). It is also in theory required to determine R
d, the
rate of mitochondrial respiration in light, and θ. The calibration
procedure is time-consuming but can then be exploited to
effect routine measurements on adequate plant material. The
procedure can also be exploited to evaluate the electron flow
to so-called alternative sinks, J
A(see
Urban et al., 2008
for an
example of field application of these methods). R
dplays a key-role
in the photosynthetic carbon metabolism of leaves experiencing
WD (
Atkin and Macherel, 2009; Lawlor and Tezara, 2009
), and
also because it is an essential component of many models (J
C, J
O,
J
A,g
m, τ . . . ). By suppressing the light source, after equilibration,
it is possible to easily measure R
n, the rate of mitochondrial
respiration in the absence of light. R
nis not equal to R
d. There
are however techniques to derive R
dfrom R
nfollowing the
methods of
Kok (1948)
or
Laisk (1977)
. The latter has been
widely exploited (
Brooks and Farquhar, 1985; von Caemmerer
et al., 1994; Peisker and Apel, 2001; Priault et al., 2006; Flexas
et al., 2007; Urban et al., 2008
). A method based on simultaneous
measurements of ChlF and gas exchange (see below) has been
proposed by
Yin et al. (2009)
and evaluated
Yin et al. (2011)
. This
method is valid for both C
3and C
4plants. More recently, the
new method of
Moualeu-Ngangue et al. (2017)
which replaces g
mby the fraction of incoming photosynthetic photons harvested by
PSII, was found to improve estimation of all major parameters
derived from A-C
icurves analysis, including R
d.
In oxygenic photosynthesis, the production ratio of
ATP/NADPH by linear electron transport is about 1.29
whereas the ratio required by the Calvin cycle is 1.5 (
Allen,
2002
). In C
3plants, photorespiration increases the ratio
up to 1.67 (
Shikanai and Yamamoto, 2017
). To satisfy the
ATP/NADPH production ratio, supplementary mechanisms for
ATP synthesis are needed. In cyclic electron transport (CET),
electrons are transferred from ferredoxin to the plastoquinone
pool, generating a trans-thylakoid H
+gradient via the Q cycle
of Cyt b
6f complex, without net production of NADPH (
Yamori
and Shikanai, 2016
). The trans-thylakoid H
+gradient (1pH) is
a major component of the proton motive force that contributes
to ATP synthesis. The 1pH also down-regulates photosynthetic
electron transport by downregulating Cyt b
6f complex activity
and by evacuating absorbed light energy in excess under the
form of heat from PSII antennae (
Shikanai and Yamamoto,
2017
). Apart from adjusting the ATP/NADPH ratio, the cyclic
electron transfert (CET) participates in the development of
non-photochemical quenching, NPQ (
Niyogi, 2000
), therefore
affording protection against photooxidative stress (
Martin et al.,
2004
). Besides, electrons from PSI which do not follow the linear
electron transport route or the CET route are transferred to
O
2to generate superoxide and other reactive oxygen species
(ROS) that are normally scavenged by the water-water cycle. The
water-water cycle consumes also reducing equivalents generated
by PSI, ferredoxin, and NADPH. Besides the water-water cycle,
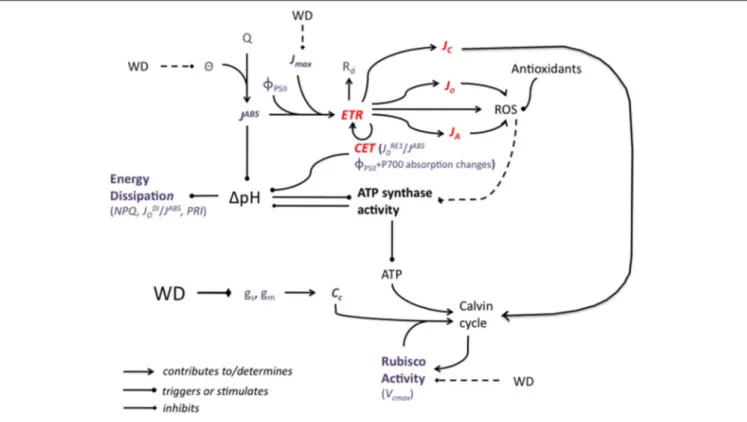
FIGURE 3 | A simplified representation of the potential impact of water deficit (WD) on the major components of the photosynthetic machinery. WD decreases stomatal and mesophyll conductance, gsand gm, leading to a decrease in the CO2concentration at the carboxylation sites, Cc. In conditions of high light, the
slowing down of the Calvin cycle creates an energy imbalance and electron fluxes (ETR: electron transport rate) are rerouted from NADP+reduction to
photorespiration, to alternative electron sinks, to mitochondrial respiration, Rd, and to the cyclic electron transport (CET). JC, JO,and JAare the electron fluxes for
carboxylation, oxygenation and alternative sinks, respectively. CET activity can be evaluated by measuring both 8PSIIand P700- dependent absorption changes at 820 nm relative to 870 nm. JRE1
0 /JABScould also be used as an indicator of CET activity. Reactive oxygen species (ROS) may also be synthetized and they are not
necessarily fully eliminated by ROS-scavenging molecules and processes. ROS have been hypothesized to damage ATP synthase, decreasing ATP production, which contributes again to slowing down the Calvin cycle. WD may impact negatively Rubisco activity (as assessed by the maximal carboxylation rate, Vcmax) but a WD-associated decrease in Vcmaxis more likely a consequence than a cause of the slowing down of the Calvin Cycle. Besides high light (Q) conditions, the cyclic
electron transfert (CET), contributes to the trans-thylakoid H+gradient, 1pH, which drives ATP synthesis. ATP synthesis, by consuming protons, acts in the opposite
direction. High 1pH triggers excess absorbed energy (JABS) dissipation processes, which can be evaluated by measuring non-photochemical quenching (NPQ), the
ratio of dissipated on absorbed energy fluxes, JDI
o/JABS, or the photochemical reflectance index (PRI). The potential effect of WD on leaf absorbance (θ) and therefore
JABSwas represented as well as the effect of WD on the maximum rate of photosynthetic electron transport (Jmax). The effects of sucrose synthesis and phloem loading are not represented. Weak or controversial effects are represented by broken lines. Red characters and lines correspond to electron fluxes. Violet characters correspond to parameters that can be measured or calculated.
nitrate reduction at PS I could also play an important role as an
alternative electron sink (
Bota et al., 2004
). Chlororespiration
is thought to participate in the regulation of CET activity by
reducing plastoquinones (
Rumeau et al., 2007
).
Shikanai and
Yamamoto (2017)
also formulated the hypothesis that CET
activity could be influenced by electron transfer to the NADH
dehydrogenase-like (NDH) complex by chlororespiration. The
NDH complex was found to represent another pathway of PSI
cyclic electron transfer in angiosperms.
It is possible to assess CET activity by measuring both 8
PSIIand P700- dependent absorption changes at 820 nm relative to
870 nm (
Harbinson and Foyer, 1991; Klughammer and Schreiber,
1994; Kotakis et al., 2006; Huang et al., 2010
), which is made
possible by devices like the Dual-PAM of Walz. Alternatively,
the electron transport fluxes from Q
Bto PSI acceptors, J
RE10,
expressed either as quantum yields (/J
ABS) or per reactive centers
(/RC) has been suggested as an indicator of CET activity (
Ripoll
et al., 2016b
). J
RE10/J
ABSand J
RE10/RC can be derived from analysis
of OJIP transients.
DISSIPATION OF EXCESS ENERGY
Leaves of water-stressed plants are commonly facing conditions
characterized by an imbalance between the quantity of light
energy absorbed relative to their capacity to deal with it
through photosynthesis, photorespiration, or even alternative
electron routes. The primary mechanism by which they
transfer the absorbed light energy in excess away from
photosynthetic electron transport toward heat production is
energy-dependent quenching, which depends in part on the
xanthophyll cycle (
Horton and Ruban, 2005; Baker, 2008;
Mozzo et al., 2008; García-Plazaola et al., 2012
). So called
non-photochemical quenching (attenuation) of ChlF, NPQ,
increases as a consequence of WD, whereas photochemical
quenching decreases (
Tezara et al., 1999
). There are two
possible ways to evaluate dissipation of excess energy, either
by using a traditional modulated fluorimeter, or by using a
high time resolution fluorimeter. The first one provides crucial
information about the importance of heat dissipation relative to
photochemistry for given light conditions; the second provides
information that rather has to be put into perspective with
other parameters to assess the global strategy of the plant under
investigation (
Ripoll et al., 2016b
).
NPQ can be calculated as (F
m– F
′
m
)/ F
′
m
from measurements
of maximal fluorescence performed on dark- (F
m) and then
light-adapted (F
′m) leaves (
Schreiber et al., 1986; Bilger and
Björkman, 1990; Bilger et al., 1995; Maxwell and Johnson, 2000;
Müller et al., 2001; Kramer et al., 2004
), using a standard
modulated fluorimeter. Alternatively, q
Ncan be calculated as
(F
m– F
′
m
)/(F
m– F
′
0
) (
Schreiber et al., 1986; Kooten and Snel,
1990
). Note that F
′0may be calculated instead of measured
on light-adapted leaves, according to
Oxborough and Baker
(1997)
. There are however discrepancies. Recently,
Ruban (2016)
proposed a novel approach for analyzing light tolerance in plants,
exploiting the discrepancy between calculated and measured F
′0.
It would certainly be of interest to test this approach for drought
conditions.
Y
NPQand Y
NO, the quantum yield of light-induced
non-photochemical quenching of fluorescence (associated to 1pH
and the xanthophyll cycle), and the yield of non-light induced
non-photochemical quenching of fluorescence, respectively, are
also useful parameters than can be easily calculated (
Kramer et al.,
2004
). Y
NOcorresponds to non-regulated dissipation of excess
energy and may be used as an indicator of the stress-associated
risk of photo-damage.
The new generation of portable fluorimeters, which provide
the high time resolution required for performing measurements
of fast ChlF induction kinetics, can be considered to facilitate
analysis of heat dissipation even more easily than modulated
fluorimeters since no light adaptation is required any more.
But then leaves must be dark-adapted. The dissipated energy
flux expressed on a PSII reaction center basis, J
DI/RC, can
be calculated as J
DI/RC = J
ABS/RC – J
TR0/RC, where J
ABS/RC
represents the average absorbed photon flux per PSII reaction
center (or, alternatively, the apparent antenna size of an active
PSII), and J
TR0/RC the maximum trapped exciton flux per
PSII. J
ABS/RC is calculated as (M
0
/V
J)/(F
v/F
m) with M
0the
initial slope of the relative variable ChlF curve, and V
Jthe
value of relative variable ChlF at 2 ms. J
TR0/RC is calculated as
M
0/V
J(
Stirbet, 2011
). J
DIcan also be expressed per excited
cross section: J
TR0/CS. 1/(J
ABS/RC), often noted as RC/ABS, is
the first of the three ingredients of the popular, composite
Performance Index on an absorption basis (PI
ABS) of Strasser
(
Strasser and Srivastava, 1995; Srivastava and Strasser, 1999;
Strasser et al., 2004; Stirbet, 2011
). In addition to RC/J
ABS,
PI
ABSencompasses F
v/F
0=
(F
v/F
m)/(1 – (F
v/F
m)), an indicator
of trapping probability, and (1 – V
J)/ V
J, an indicator of the
performance of conversion of excitation energy to photosynthetic
electron transport. PI
ABSis considered as a much more sensitive
and discriminating stress indicator than F
v/F
m(see for instance
Le, 2007
), even though contradictory observations in response
to WD have been reported (
Ripoll et al., 2016b
). Differences
in J
DI/RC are generally discussed along with other variations
in energy and electron fluxes, namely variations in the electron
transport fluxes from Q
Ato Q
B, J
ET20, and in J
RE10. When
compared to PI
ABS, PI
TOTABSactually includes an additional
parameter related to electron transport flux to PSI acceptors.
Alongside
parameters
derived
from
chlorophyll
a
fluorescence, the Photochemical Reflectance Index (PRI) of
Gamon et al. (1992)
may be used to evaluate the epoxidation rate
of xanthophylls, which was observed to result in a major shift
in reflectance at 531 nm compared to stable reflectance at either
515, 550, or 570 nm. Because xanthophyll cycle pigments adjust
the energy distribution at the photosynthetic reaction center, the
PRI can be considered as an indicator of photosynthetic light use
efficiency (LUE) and of stress (
Gamon et al., 1992
). Even though
the PRI is highly sensitive to light conditions, it has been found
to be particularly useful for measuring vegetation health status
at the canopy and field scale, prior to senescence. A normalized
version of the PRI has been proposed by
Zarco-Tejada et al.
(2013)
which allows for corrections for both canopy density and
chlorophyll content variations. The PRI has already been used
successfully as an indirect water stress indicator (
Thenot et al.,
2002; Peguero-Pina et al., 2008; Suárez et al., 2008, 2009, 2010
).
As portable commercial sensors measuring PRI and NDVI are
now available, PRI time series becomes easy to acquire. At the
short-term scale, PRI is a promising physiological indicator
of stresses. However, PRI value is affected by tissue structural
changes, chlorophyll content level and carotenoid/chlorophyll
content ratios (
Sims and Gamon, 2002; Wong and Gamon,
2015
). Consequently, the relationships between light use
efficiency (LUE) and PRI, between F
v/F
mand PRI (
Stylinski
et al., 2002
), and between 1F/Fm
′and PRI (
Gamon et al.,
1997
), are specific of plant species and of growing condition.
By using PRI values of dark-adapted leaves (PRI
0), which are
highly correlated to chlorophyll content, saturating Q and soil
moisture, it is possible to define PRI seasonal variations, and
then to analyze short-term variations which are correlated to
light interception and LUE (
Hmimina et al., 2014, 2015
). The
occurrence of clouds affects directly and negatively PRI (
Merlier
et al., 2015
). PRI variations are greater in sunlit upper leaves than
in the shaded leaves found inside the canopy, reflecting a higher
investment of the photoprotective xanthophyll cycle pigments
(
Gamon and Berry, 2012
). Some caution should be observed
when comparing PRI values among younger and mature leaves at
a given time period, and when comparing PRI values at different
seasons. Pigment content analysis in contrasted conditions is
recommended for relevant interpretation of PRI variations.
The correlation between PRI and F
v/F
mis no longer verified
when senescence starts. During extreme drought, PRI can
become decoupled from LUE, leading to overestimates of LUE
(
Gamon et al., 2001; Filella et al., 2004; Nakaji et al., 2006;
Rahimzadeh-Bajgiran et al., 2012
).
ANTIOXIDANT METABOLISM
The antioxidant metabolism in plants encompasses enzymatic
and non-enzymatic processes. It is known since long that
there are both strongly influenced by WD (
Reddy et al., 2004;
Nakabayashi et al., 2014
). To evaluate enzymatic processes, it
is needed to measure the activities of antioxidant enzymes like
superoxide dismutase and of enzymes of the antioxidant systems
(
Poiroux-Gonord et al., 2013
). There are no non-destructive
methods so far that can be used in the field to evaluate enzymatic
activities. By contrast, there are field techniques for evaluating the
content in non-enzymatic antioxidant molecules. [anthocyanins]
and [flavonols] can be measured at least using in vivo,
non-destructive measurements of ChlF based on the fluorescence
excitation ratio method (
Bilger et al., 1997; Agati et al., 2011
).
The method was developed for canopies (
Ounis et al., 2001
) and
tested also on fruits (see for instance
Betemps et al., 2012
). The
Dualex
Rand the Multiplex
Rsystems that are used on leaves
make use of a reference beam of red light (not absorbed by
flavonols and anthocyanins) and one or more additional beams
providing different excitation wavelengths. UV-A is strongly
absorbed by flavonols whereas green light is strongly absorbed
by anthocyanins (
Cerovic et al., 2002, 2012; Goulas et al., 2004;
Cartelat et al., 2005; Bürling et al., 2013
). Diodes for detecting
fluorescence emission at 590, 685, and 735 nm allow corrections
for differences in chlorophyll content in leaves since the red/far
red fluorescence ratio is related to chlorophyll concentration
(
Hák et al., 1990; Lichtenthaler et al., 1990; Buschmann et al.,
2001; Buschmann, 2007; Gameiro et al., 2016
). Apparently, using
either a blue or a red reference light beam to make measurements
on green leaves was not found to influence results (
Cerovic et al.,
2002, 2012; Goulas et al., 2004; Cartelat et al., 2005; Pfündel et al.,
2007; Bürling et al., 2013
). It must be noted that the specific
modulated fluorimeters that are used to measure [anthocyanins]
and [flavonols] in leaves can be easily operated in the field with
the added bonus of little influence of current climatic parameters.
It must however be kept in mind that the no units data provided
must be corrected to be expressed on dry matter basis.
DAMAGE INDICATORS
At some point, stress may not simply trigger acclimation
mechanisms but also result in various damages (Figure 1).
Most damage-related parameters that can be measured in the
field derive from ChlF measurements or are indicators of leaf
chlorophyll content. We propose to consider here five ChlF
parameters: F
o, the relative variable ChlF at 300 µs, NPQ,
the normalized area of the fluorescence induction curve, and,
tentatively, the probability of connectivity.
An increase in F
0may be caused by the release of free
chlorophyll from protein-pigment complexes, which results in
blocked energy transfer to the PSII traps (
Armond et al., 1978,
1980; Sundby et al., 1986
). An increase in F
0may not be reflected
in a decrease in F
v/F
mwhen there is a concomitant decrease in
F
m. A decrease in F
mis a common occurrence in conditions
of stress, since a decrease in F
mreflects sustained engagement
of zeaxanthin in a state primed for energy dissipation, i.e., the
stimulation of the photoprotective mechanism known as the
xanthophyll cycle (
Wingler et al., 2004
).
Drought may cause damage to the oxygen-evolving center
(OEC) coupled with PSII (
Kawakami et al., 2009
), besides of
degradation of D1 protein (
He et al., 1995; Giardi et al., 1996
),
leading to inactivation of the PSII reaction centers (RC) (
Liu et al.,
2006; Zlatev, 2009
), which may eventually lead to ROS generation
as well as photoinhibition and oxidative damage (
Ashraf, 2009;
Gill and Tuteja, 2010
). Limitation/inactivation, possibly damage
of the OEC may be observed and assessed through the increase in
relative variable fluorescence at 300 µs (K-step), V
K(
Srivastava
et al., 1997
), although such an increase may also be interpreted as
a different functional antenna size (
Yusuf et al., 2010
). The V
K/V
Jratio can also be used as a relative measurement of the functional
antenna size (
Yusuf et al., 2010
) or of OEC inactivation/damage
(
Kalachanis and Manetas, 2010
; see also
Kotakis et al., 2014
).
V
Jstand for relative variable fluorescence at 2 ms. A K-step
occurs whenever the electron flow to the acceptor side exceeds
the electron flow from the donor side. This leads to RC oxidation
with a photosystem shift toward the P
+680form which is known to
have a low fluorescence yield (
Srivastava et al., 1997
). Thus, OEC
dissociation triggers the K-step, by inhibiting efficient electron
donation to the RC (
Strasser, 1997; De Ronde et al., 2004
). The
appearance of the K-band is associated with heat and drought
stress.
Christen et al. (2007)
observed indeed an increase in F
Kas a consequence of drought. Similarly,
Oukarroum et al. (2007)
observed that the K-band can be exploited to analyse responses
to drought stress in barley cultivars.
It was hypothesized that the repair cycle for ATP synthase
components is not as active as for D1 protein (
Nishiyama et al.,
2001
).
Mahler et al. (2007)
observed that
1O
2