ALMA Resolves the Nuclear Disks of Arp 220
The MIT Faculty has made this article openly available.
Please share
how this access benefits you. Your story matters.
Citation
Scoville, Nick et al. “ALMA Resolves the Nuclear Disks of Arp 220.”
The Astrophysical Journal 836.1 (2017): 66. © 2017 The American
Astronomical Society
As Published
http://dx.doi.org/10.3847/1538-4357/836/1/66
Publisher
IOP Publishing
Version
Final published version
Citable link
http://hdl.handle.net/1721.1/109530
Terms of Use
Article is made available in accordance with the publisher's
policy and may be subject to US copyright law. Please refer to the
publisher's site for terms of use.
ALMA Resolves the Nuclear Disks of Arp 220
Nick Scoville1, Lena Murchikova1, Fabian Walter2, Catherine Vlahakis3, Jin Koda4, Paul Vanden Bout3, Joshua Barnes5,6, Lars Hernquist7, Kartik Sheth8, Min Yun5, David Sanders6, Lee Armus9, Pierre Cox10,11,
Todd Thompson12,13, Brant Robertson14, Laura Zschaechner2, Linda Tacconi15, Paul Torrey16,17, Christopher C. Hayward16, Reinhard Genzel15, Phil Hopkins1, Paul van der Werf18, and Roberto Decarli2
1
California Institute of Technology, MC 249-17, 1200 East California Boulevard, Pasadena, CA 91125, USA 2
Max-Planck-Institut fur Astronomie, Konigstuhl 17, D-69117 Heidelberg, Germany 3
National Radio Astronomy Observatory, 520 Edgemont Road, Charlottesville, VA 22901, USA 4
Department of Physics & Astronomy, Stony Brook University, Stony Brook, NY 11794, USA 5
Yukawa Institute for Theoretical Physics, Kyoto University, Sakyo-ku, Kyoto 606-8502, Japan 6
Institute for Astronomy, 2680 Woodlawn Dr., University of Hawaii, Honolulu, HI 96822, USA 7
Harvard-Smithsonian Center for Astrophysics, 60 Garden Street, Cambridge, MA 02138, USA 8
NASA Headquarters, 300 E Street SW, Washington, DC 20546, USA 9
Infrared Processing and Analysis Center, California Institute of Technology, 1200 E. California Boulevard, Pasadena, CA 91125, USA 10
Joint ALMA Observatory, Alonso de Córdova 3107, Vitacura, Santiago, Chile 11
European Southern Observatory, Alonso de Córdova 3107, Vitacura, Santiago, Chile 12
Department of Astronomy, The Ohio State University, 140 West 18th Avenue, Columbus, OH 43210, USA 13
Center for Cosmology and AstroParticle Physics, The Ohio State University, 191 West Woodruff Avenue, Columbus, OH 43210, USA 14
Department of Astronomy and Astrophysics, University of California, Santa Cruz, 1156 High Street, Santa Cruz, CA 95064, USA 15
Max-Planck-Institut fur extraterrestrische Physik(MPE), Giessenbachstr., D-85748 Garching, Germany 16
TAPIR 350-17, California Institute of Technology, 1200 E. California Boulevard, Pasadena, CA 91125, USA 17
Department of Physics, Kavli Institute for Astrophysics and Space Research, Massachusetts Institute of Technology, Cambridge, MA 02139, USA 18
Leiden Observatory, Leiden University, P.O. Box 9513, NL-2300 RA Leiden, The Netherlands Received 2016 May 28; revised 2017 January 6; accepted 2017 January 6; published 2017 February 8
Abstract
We present 90 mas (37 pc) resolution ALMA imaging of Arp 220 in the CO (1-0) line and continuum at l = 2.6 mm. The internal gas distribution and kinematics of both galactic nuclei are wellresolved for the first time. In the west nucleus, the major gas and dust emission extends out to 0 2 radius(74 pc); the central resolution element shows a strong peak in the dust emission but a factor of3 dip in the CO line emission. In this nucleus, the dust is apparently optically thick(t2.6 mm~ 1) at l = 2.6 mm with a dust brightness temperature of ∼147 K. The column of interstellar matterat this nucleus isNH2 ´2 1026cm−2, corresponding to∼900 gr cm−2. The east nucleus is more elongated with radial extent 0 3 or∼111 pc. The derived kinematics of the nuclear disks provide a goodfit to the line profiles, yielding the emissivity distributions, the rotation curves, and velocity dispersions. In the west nucleus, there is evidence of a central Keplerian component requiring a central mass of 8×10⁸M. The intrinsic widths of the emission lines are Dv FWHM( )=250(west) and 120 (east) km s−1. Given the very short dissipation timescales for turbulence(105years), we suggest that the line widths may be due to semicoherent motions within the nuclear disks. The symmetry of the nuclear disk structures is impressive,implying the merger timescale is significantly longer than the rotation period of the disks.
Key words: galaxies: active– galaxies: individual (Arp 220) – galaxies: starburst – Galaxy: evolution – ISM: clouds– ISM: molecules
1. Introduction
Galactic merging is a key process in the early growth and evolution of massive galaxies and in determining their structural morphology. In the era of precision cosmology, these processes remain a major uncertainty in understanding the present makeup of the visible universe. Many aspects of the evolution of merging, gas-rich nuclear disks are poorly constrained and only approximately understood in terms of the physical processes and the hierarchy of their importance. The radial mass and star-formation distributions, the physical conditions(density, temperature, and cloud structures), and the evolution associated with feedback from starbursts (SBs) and active galactic nuclei(AGNs) remain poorly understood. And yet, all of these are vital to predicting the ultimate fate or product of the mergers (e.g., the resulting galactic morpholo-gies) and the mode(s) of star formation and AGN fueling.
Ultraluminous infrared galaxies (ULIRGs) are the most extreme SB galaxies. Thefirst complete sampling of the local universe yielded 22 ULIRGs at z< 0.1 from the IRAS all-sky surveywithL1 1000 m– m >1012L(Sanders et al.1988). At high redshift when the rate of collisions of the galaxies was higher (Rodriguez-Gomez et al. 2015) and galaxies were more
gas-rich, they were much more abundant (Caputi et al. 2007; Le Floc’h et al.2009; Magnelli et al.2013).
Resolved studies of the merging processes must rely on the sample of local galaxies. The follow-up ground-based optical imaging reveals virtually all of the local ULIRGs to be merging galaxies or postmerging systems (Armus et al. 1987; Sanders et al.1988; Sanders & Mirabel1996). During the merging of
gas-rich galaxies, the original interstellar matter (ISM;presumably distributed in extended galactic-scale disks) sinks rapidly to the center of the merging system due to dissipation of kinetic energy in the shocked gas and torques generated by the offset stellar and © 2017. The American Astronomical Society. All rights reserved.
gaseous bars (e.g., Barnes & Hernquist 1992,1996). The
star-formation rates in the ULIRGs are typically 10–100 times higher per unit mass of ISM compared to quiescent disk galaxies. The ULIRG-starburst activity is likely driven by theconcentration of gas in nuclear regions and dynamical compression of this gas in supersonic shocks.
Among the ULIRGs, Arp 220 is probably the most freq-uently cited example, having luminosity LIR=1.91´1012
L (Sanders et al. 2003; Armus et al. 2009). Here we adopt a
luminosity distance ofDL=87.9Mpc and angular size distance =
DA 85.0Mpc (Armus et al. 2009).Near-infrared imaging shows two galactic nucleiseparated by 1 0 or 412 pc (Scoville et al. 1998). CO imaging at 0 5 resolution uncovers two
counterrotating disks with radii∼100 pc and dynamical masses ~ ´2 109M for each disk (Scoville et al. 1997, 1998; Sakamoto et al. 1999; Downes & Eckart 2007). Much of the
nuclear ISM is very dense (>104 5– cm−3) and at high temperature (>75 K;Sakamoto et al. 1999; Downes & Eckart
2007; Greve et al.2009; Matsushita et al.2009; Rangwala et al.
2011; Wilson et al.2014; Scoville et al.2015b).
Both nuclei are optically thick at l< 600 m. Wilson et al.m (2014) derive dust optical depths t434 mm =5.3and 1.7 for the west and east nuclei, respectively, implying that for the west nucleus t1 mm~ 1. These high optical depths imply that the nuclear disk structures are best probed at l> 600 m. Shorterm wavelength observations may not penetrate the outer dust photospheres of the nuclei unless the structures are tilted to the line of sight. The fact than any near-infrared radiation can be seen from the nuclei is a clear indication that the dust is in a disk-like distribution tilted to the line of sight.
Here, we present 90 mas(37 pc) resolution ALMA imaging of the inner region of Arp 220 in the CO (1-0) line and the 2.6 mm continuum(108–114 GHz, ALMA Band 3), providing excellent resolution and sensitivity for imaging the molecular gas and the long-wavelength dust continuum. The east and west nuclei are internally resolved for the first time. The dust continuum provides an independent and linear probe of the overall ISM mass(Scoville et al.2015a,2015b).
2. ALMA Observations and Data Reduction These ALMA Cycle 3 long baseline observations in theCO (1-0) line were obtained in 2015 November for project #2015.1.00113.S. (We are also scheduled to obtain CO (2-1) and(3-2) high- and low-resolution imaging, but those data will
probably not be available until the end of 2017.) In view of the major increase in resolution provided by the high-resolution CO(1-0) data, publication of thesedata is important, and we proceed here with those preliminary results.
The observations discussed here were in receiver Band 3; the correlator was configured in the time division mode (TDM) with fourspectral windows. Each window had a full bandwidth of 1875 MHz with 1.95 MHz resolution spectral channels. One window was configured to observe the redshifted CO (1-0) line at a rest frequency of 115.2712 GHz; the remaining three spectral windows were centered at 113.253 GHz, 103.073 GHz, and 101.139 GHz to image the dust continuum emission and
13CO and C18O. The latter will be presented in our later
publication with the other bands.
The observations were done in a very extended configuration with baselines up to 11 km, providing the maximum resolution presently available with ALMA. For this telescope con figura-tion, goodflux recovery is expected out to scales of ∼0 4, but extended emission with spatial size greater than this will be at least partially resolved out. These observations thus probe only the inner nuclei of Arp 220. The data were taken with 40 12 m antennas, and the total integration time was 30 minutes (excluding calibrations).
Following delivery of data products, the data were rereduced and imaged using the Common Astronomy Soft-ware Applications package (CASA). Self-calibration was done to improve the dynamic range. The images were made with the parameters Robust=0, 1,and 2; only the Robust=1 images are used here. We cleaned the images with no continuum subtraction, noted the line and absorption free channels, and then created a continuum image using those channels. The continuum subtraction was then done in the image plane.
Channel averaging over eightof the original channels was done to reduce noise, resulting in data with avelocity resolution of 40 km s−1 without serious compromise relative to the intrinsic line width (DvFWHM=100 200– km s−1;see Section 5). The 1σ (rms) sensitivities are as follows: an rms
noise of 0.6 mJy beam-1 in 40 km s−1 channels in the lower sideband at ∼110 GHz,and 0.8 mJy beam-1 in 40 km s−1 channels in the upper sideband at 114 GHz.
The velocities given here are vradio=cz (1+z)=
n -n n
c( rest ) rest relative to the LSR (not vopt=cz=
n -n n
c( rest ) ). The Arp 220 observations were centered on
Table 1 Fluxes
Source Frequency a2000a d2000a Total Flux Peak Flux Peak TB
Continuum (GHz) (mJy) (mJy/beam) (K)
Arp 220 West 112.26 15:34:57.224 23:30:11.48 32.1 13.1±0.05 147.2
Arp 220 East 112.26 15:34:57.286 23:30:11.32 14.0 3.1±0.04 30.5
Lines (Jy km s−1) (Jy km s−1beam−1) (K)
Arp 220 West CO(1-0) 15:34:57.224 23:30:11.49 47.3 3.33±0.01 187b
Arp 220 East CO(1-0) 15:34:57.290 23:30:11.34 27.8 1.78±0.01 175b
Notes.Peak position andfluxes obtained from 2D Gaussian fits using the IDL routine CURVEFIT. Gaussian component sizes are listed in Table2. Uncertainties in the continuum and linefluxes obtained from the uncertainties in the Gaussian component fitting do not include calibration uncertainties.
a
Peak derived from two-dimensional Gaussianfit (Table2).
b
z=0.018486, implying cz=vopt=5542km s−1 and vradio= 5441 km s−1(Sanders et al.1991). The derived systemic velocities
of the nuclei are vradio=5337 (west) and 5431 km s−1 (east) (Table4).
Table1lists the measured sourcefluxes and peak brightness temperatures for both the continuum and the CO(1-0) line, and Table2contains the results of two-dimensional Gaussianfits to each of the sources. The total recovered CO lineflux from the two nuclei is45.4+27.4=72.8 Jy km s−1. This is 19% of the total single-dish CO(1-0) line flux measured by Sanders et al. (1991) and Solomon et al. (1997).
3. Continuum Emission 3.1. Infrared Dust Emission
A brief background for understanding the far-infrared dust emission is warranted as a preamble to our analysis below. For this discussion we might visualize the massive dust concentra-tions in the nuclei of Arp 220 as spherical, with density decreasing outward. The dust has an opacity thatincreases steeply at shorter wavelengths (i.e., knµn1.8 in the far-infrared/submillimeterregime). The enormous dust column densities in the Arp 220 nuclear sources imply that the dust will be optically thick well into the far-infrared.
As one views these sources from the outside, the depth from which the observed, emergent radiation is emitted will depend strongly on the wavelength of observation, since at each wavelength one sees into the photosphere at tl 1. At longer wavelengths the dust opacity is less, so the emergent radiation will come from deeper within the optically thick cloud.
The dust at each radius is also likely to be in radiative equilibrium with the luminosity (which originates from massive stars in the nuclear starburst or from a central AGN). As long as these luminosity sources are centrally concentrated, the dust temperatures must increase at smaller radii.
Thus it should be anticipated—as long as the dust is optically thick into the far-infrared, the longer wavelength observations will tend to probe high-temperature dust closer to the central energy sources—thatthe long wavelengths see deeper into the enveloping dust. It would appear counterintuitive that longer wavelength observations probe hotter regions in the nuclei at smaller radii, but because of the opacity falloff at longer wavelengths, this is in fact the case.
There is a cautionary corollary:lower angular resolution observations will tend to include a larger fraction of the cooler dust at large radii, and these outer regions will be less optically thick(if the gas and dust density decreases outward). In fact, one must recognize that there is no single wavelength at which one can say the source is optically thin or thick. The dust column(and optical depth) increases as the line of sight passes closer to the center; therefore the “apparent” (or average) optical depth one infers from an observation is dependent on the angular resolution or beam size of the observation.
3.2. Continuum Spectra
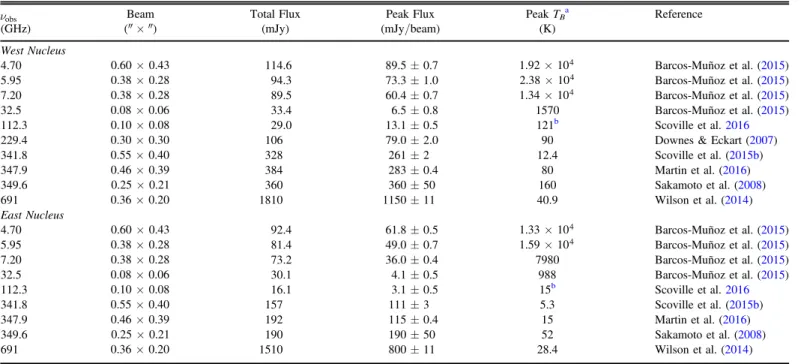
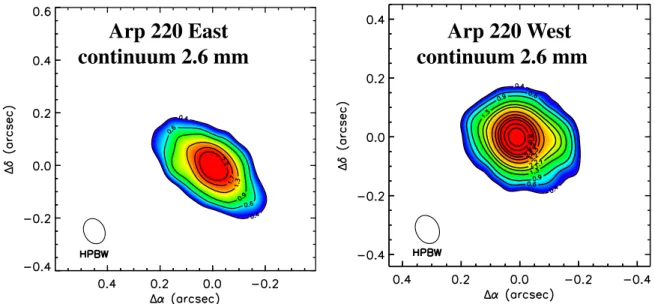
In Table 3, we list the radio and infrared continuum measurements done at <0 6 resolution,sufficient to separate the two nuclei(Figure1). The total integrated fluxes and peak
flux per beam are given, along with the peak brightness temperature calculated from the peakflux per beam at each of the different frequencies. It should be noted that the synthesized beam sizes vary between 0 6 and 0 08. In most cases, the interferometric integrated fluxes will recover emission on scales up to ~ ´3 the beam size, but emission on larger scales will not be fully recovered. The brightness temperatures determined from the peakflux at each frequency also refer to variable source radii ranging from 0 05 to 0 3, corresponding to 20 to 123 pc.
In Figure2the fluxes are plotted, and the spectral indexes for each frequency interval are shown. At low frequencies (n < 40 GHz), the spectral index (α inSnµna) is negative, and the emission is predominantly nonthermal synchrotron. At n200 GHz the dust emission dominates, and the spectral indexes areranging from a = 2 (optically thick and a single dust temperature) to steeper (a > 2 to4) if there are substantial contributions from optically thin dust. In this frequency range, the maximum spectral index will be ∼3.8, corresponding to optically thin emission with a typical Galactic ISM dust opacity coefficient ofb =1.80.1 (Planck Collaboration 2011a). In Figure 2on theright, the
spectral indexes at the highest frequency are 2.4 (west) and 3.2 (east), indicating that most of the emission is from optically thick dust with a small addition of optically thin emission(most obvious in the east nucleus where the optical depths are not so high).
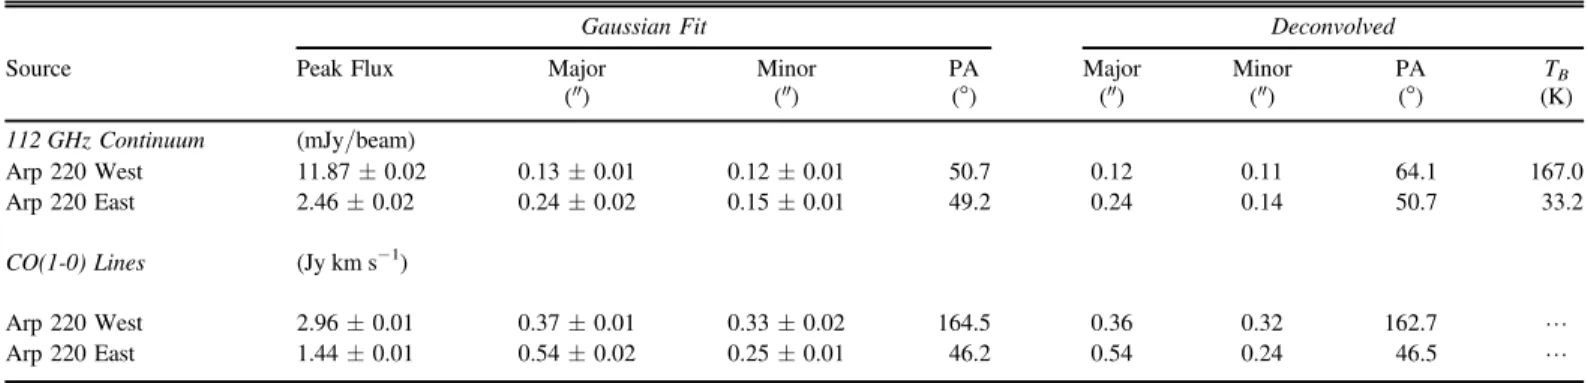
Table 2 Gaussian Source Fits
Gaussian Fit Deconvolved
Source Peak Flux Major Minor PA Major Minor PA TB
(″) (″) (°) (″) (″) (°) (K) 112 GHz Continuum (mJy/beam) Arp 220 West 11.87±0.02 0.13±0.01 0.12±0.01 50.7 0.12 0.11 64.1 167.0 Arp 220 East 2.46±0.02 0.24±0.02 0.15±0.01 49.2 0.24 0.14 50.7 33.2 CO(1-0) Lines (Jy km s−1) Arp 220 West 2.96±0.01 0.37±0.01 0.33±0.02 164.5 0.36 0.32 162.7 L Arp 220 East 1.44±0.01 0.54±0.02 0.25±0.01 46.2 0.54 0.24 46.5 L
Note.Sizes(FWHM) and major-axis PA estimates obtained from 2D Gaussian fits using the IDL routine CURVEFIT. The deconvolved sizes were obtained using the IDL routine MAX_LIKELIHOOD. The uncertainties in the parameters were the formal errors from the Gaussianfitting. For all of the observations, the synthesized beam was0.08´ 0. 10at PA=25°.7.
3.3. Dust Emission Fluxes and Brightness Temperatures At 112.3 GHz, the continuum emission is a mixture of synchrotron and dust emission. If we extrapolate the 32 GHz flux measurements (Barcos-Muñoz et al. 2015) with a spectral
index a = -0.60 determined between 7 and 32 GHz (see Figure 2), then the expected nonthermal and free–free
contribution at 112.3 GHz will be ∼0.47 of the 32.5 GHz fluxes, implying 15.8 and 3.1 mJy beam−1in the west nucleus
and 14 and 1.9 mJy beam−1 in the east nucleus. Subtracting these contributions from the observed fluxes, we obtain estimates for the dust continuum fluxes of 13 and 10 mJy beam−1 (west) and 1.8 and 1.2 mJy beam−1 (east), at 112.3 GHz. These dust-only fluxes are used to calculate the revised dust emission brightness temperatures given in parentheses in Table 3 for 112.3 GHz–121 K in the west nucleus and 15 K in the east on the scale 90 mas diameter or 19 pc radius. The peak brightness temperatures in the CO(1-0) emission are 187 and 175 K, respectively(see Table1); these
peak line brightness temperatures are seen at larger radii (see Figure3).
3.4. West Nucleus Luminosity
The 147 K brightness temperature of the 112.3 GHz dust emission seen on the west nucleus is unexpectedly high, given the previous submillimeterobservations (691 GHz) of Wilson et al. (2014) thatindicated TB=18127K on the west nucleus and anoptical depth oft434 mm 5.3. If the dust opacity varies with the standard Galactic powerlaw n1.8, then
the optical depth should be ~0.038´5.3~0.2 at 112.6 GHz. The estimated 147 K brightness temperature clearly requires a higher optical depth of t2.6 mm 1.
It is interesting to note that the implied dust photosphere, optically thick out to l ~ 2.6 mm, with dust temperature
TD 200K and radius 15 pc, must radiate p s = = ´ ´ L R T L R T 4 6.35 10 15 pc 200 K . 1 west 200 K dust 2 4 11 2 4 ( ) ( ) ( )
An identical estimate,LWest=6.3´1011L, was obtained by Wilson et al. (2014) from ALMA dust continuum
measure-ments at l= 445 m. This corresponds to 33% of the total IRm luminosity1.91´1012
L of Arp 220 (Sanders et al. 2003; Armus et al.2009)—all originating from R 15 pc.
Based on their 860μm continuum measurements at 0 23 resolution, Sakamoto et al.(2008) obtain lower limits on the
luminosity∼3×10¹¹Lfor the west nucleus. They argue that the derived luminosity is very sensitive to the adopted source size, varying as R−6. Our estimate given above is based on a resolved source size and a dust temperature of∼200 K, based on adetermination that the dust is nearly optically thick. It therefore is not just a lower limit but rather an estimate of the actual luminosity, albeit uncertain to a factor of2.
For a geometrically thin, optically thick disk, the emitting surface area is ~ R2p 2, so for the same T
D the emergent
luminosity would be a factor of2 lower than forEquation (1).
Table 3 Continuum Fluxes
nobs Beam Total Flux Peak Flux Peak TBa Reference
(GHz) (″ × ″) (mJy) (mJy/beam) (K) West Nucleus 4.70 0.60´0.43 114.6 89.5±0.7 1.92´104 Barcos-Muñoz et al.(2015) 5.95 0.38´0.28 94.3 73.3±1.0 2.38´104 Barcos-Muñoz et al.(2015) 7.20 0.38´0.28 89.5 60.4±0.7 1.34´104 Barcos-Muñoz et al.(2015) 32.5 0.08´0.06 33.4 6.5±0.8 1570 Barcos-Muñoz et al.(2015) 112.3 0.10´0.08 29.0 13.1±0.5 121b Scoville et al.2016
229.4 0.30´0.30 106 79.0±2.0 90 Downes & Eckart(2007)
341.8 0.55´0.40 328 261±2 12.4 Scoville et al.(2015b) 347.9 0.46´0.39 384 283±0.4 80 Martin et al.(2016) 349.6 0.25´0.21 360 360±50 160 Sakamoto et al.(2008) 691 0.36´0.20 1810 1150±11 40.9 Wilson et al.(2014) East Nucleus 4.70 0.60´0.43 92.4 61.8±0.5 1.33´104 Barcos-Muñoz et al.(2015) 5.95 0.38´0.28 81.4 49.0±0.7 1.59´104 Barcos-Muñoz et al.(2015) 7.20 0.38´0.28 73.2 36.0±0.4 7980 Barcos-Muñoz et al.(2015) 32.5 0.08´0.06 30.1 4.1±0.5 988 Barcos-Muñoz et al.(2015) 112.3 0.10´0.08 16.1 3.1±0.5 15b Scoville et al.2016 341.8 0.55´0.40 157 111±3 5.3 Scoville et al.(2015b) 347.9 0.46´0.39 192 115±0.4 15 Martin et al.(2016) 349.6 0.25´0.21 190 190±50 52 Sakamoto et al.(2008) 691 0.36´0.20 1510 800±11 28.4 Wilson et al.(2014)
Notes.Includes only continuum data at < 0. 6 resolution. Scoville et al.(2016) is this paper.
a
Peak brightness temperature in the continuum calculated from TB=(Spk Wbeam)l2 2k=1.22 ´ 103S mJy beamn( ) (qmajqminn(GHz) )2 = 1.36S mJy beamn l cm2 q q
maj min
( ) ( ) ) ( ) where the FWHM beam sizesθ are in arcsec. b
The brightness temperature of the dust emission contribution at 112.3 GHz after removing the extrapolated synchrotron/free–free seen at longer wavelengths from the observed TBof 163 K(west) and 39 K (east).
It is interesting to note that essentially all estimates of the infrared luminosity in ULIRGs assume a spherical, that is, isotropic source. If the infrared is in fact emitted from a thin disk thatis optically thick, these luminosity estimates should be increased by a factor of1 cos .i
A considerably lower temperature T=45 K is derived from fitting the total far-infrared SED of Arp 220 (Sanders et al. 1991), implying that, at the shorter wavelengths near
the 70μm IR peak, one is sampling colder dust in a more extended photosphere. This sampling of colder dust at shorter wavelengths is as anticipated in Section 3.1 for an optically
thick dust cloud:the optical depth is higher at shorter wavelengths. Hence, the t 1 surface (from which the observed photons at shorter wavelengths originate) will be at larger radius and lower T(assuming a centrally heated source). A major virtue of the longer wavelength observations reported here is the ability to penetrate the optically thick dust envelope and probe the inner regions of heavily obscured luminosity sources. The peak of the 200 K blackbody emission (Ln) is at l= 26 m, but the original sources of luminositym (young stars or a central AGN) undoubtedly emit their energy at much shorter wavelengths in the visible, UV, and X-rays.
Since the observations place an upper limit of∼200 K on the dust temperature at R=15 pc, this implies that the luminosity originating from smaller radii cannot be much larger than 6×10¹¹L—otherwise the dust would be hotter. If there is an AGN in the western nucleus, its power must be less than this. The remainder of the ~1.9´1012
L total luminosity, or about1.3´1012
L , must originate from more distributed star formation atR>15 pc(36 mas radius) and the east nucleus.
3.5. West Nucleus ISM Column Densities and Mass We use the observed dust opacity(t2.6 mm 1) to estimate the column density of the west nucleus point source assuming that the dust there hasproperties similarto thegeneral ISM dust observed in the Galaxy. Scoville et al. (2015a) empirically calibrated the long-wavelength
dust emission from Herschel SPIRE with the CO(1-0) ISM masses for 28 local star-forming galaxies and 12 ULIRG galaxies and with Planck measurements of the submillime-terdust opacity in the Milky Way. The data are consistent with a single proportionality constant relating the rest-frame 850μm specific luminosity of the dust to the molecular ISM mass. This empirical calibration is
a º á ñ = ´ n n - - -m L M M 6.7 1.7 10 erg s Hz , 2 mol 19 1 1 1 850 m ( ) ( )
where Ln850mm is the specific luminosity of the dust at l =
m
850 m. The mass Mmol includes acontributionfor He and
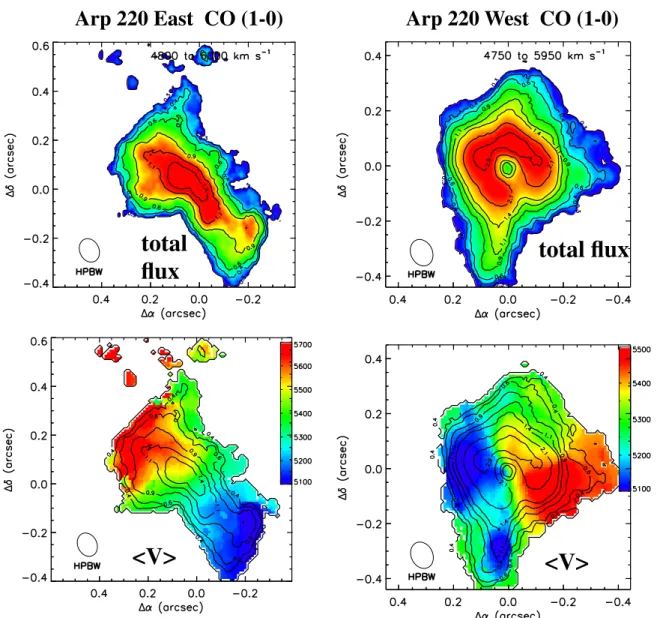
Figure 1.The 2.6 mm continuum distribution on the east and west nuclei is shown at0.08´ 0. 1 resolution(33 × 41 pc). The peak values are 3.1 (east) and 13.1 mJy beam−1(west). Coordinate offsets are relative to the 2.6 mm continuum peaks (Table1), and the contours are mJy beam−1.
Figure 2.Continuumfluxes measured at high resolution for the east and west nuclei of Arp 220 (Table 3). The expected power laws for nonthermal
synchrotron emission(NT) and Rayleigh–Jeans blackbody (BB) emission are shown for reference. At long wavelengths, the dominant emission is nonthermal synchrotron emission with flux in the rangen-0.5 to-0.7; at
n > 100 GHz the dominant emission is the dust continuum with spectra
varying between n2in the optically thick limit and n~3.8in the optically thin limit. The dust emission at n > 100 GHz is optically thick in the smallest aperture measurements and a combination of both optically thick and thin emission in larger aperture measurements.
heavier atoms, and the mass derivation employed a single standard Galactic CO–H2conversion factor.
For an optically thin mass sheet of area A and surface density Smol ISM, Equation (2) can be recast as
p t p k p k k a p = S = S S = = n n n n n n n n n n m L M AB T A B T B T B T 2 2 2 , yielding 2 . 3 mol D mol D mol mol D D 850 m ( ) ( ) ( ) ( ) ( )
We use the above calibration of dust optical depth to estimate the column of gas in the nuclear source. The bulk of the ISM dust in the nearby galaxies used for the calibration is at ∼25 K (see Scoville et al.2015a). Using this temperature in the
above equations then implies a dust absorption coefficient at 850μm k850 mm =8.06´10-3cm2gr−1, where the mass includes the He contribution. Scaling this opacity coefficient as n1.8 (Planck Collaboration 2011a), we obtain k =
2.6 mm
´
-1.03 10 3cm2gr−1. Putting this in terms of the H
2column
density, k2.6 mm=4.51´10-27 NH2. Thus an H2 column of
´ 2.21 1026 H
2cm−2 is required in order for t2.6 mm 1.19
Our estimate of the column density is considerably higher than earlier estimates of NH2~1025 and 3 6– ´1025cm−2 (Sakamoto et al. 2008; González-Alfonso et al. 2012). Their
estimates were lower since they were derived from higher frequency observations and hence should be viewed as lower limits if the dust is optically thick at those wavelengths. Our estimate is also well above the lower limit of >1025cm−2 derived by Teng et al. (2015) from nondetections in the
NuSTAR bands above 20 keV.
As an aside, it is interesting to note that the mass column density of ISM 900 g cm−2 in the western nucleus corre-sponds to a concrete wall 3–4 m thick or gold 1 ft thick. This is perhaps the highest ISM column density ever probed by astronomical observations. It corresponds to AV =2´105 mag and would be very Compton thick.
Lastly, we note that t2.6 mm must be 1 across a circular region with R> 10 pc since the similarity of the observed dust brightness temperature and dust physical temperature requires an areal filling factor of order unity in the central resolution element. The total molecular mass is then Mmol>1.4´109
M . Clearly, these estimates are uncertain, given the assump-tion that the dust has standard interstellar dust properties and abundance, relative to gas in the extreme conditions at the center of Arp 220. The mass so derived is approximately a factor of2 higher than the dynamical mass in the same region (also uncertain) obtained from the CO line kinematics (see Section5).
From the derived H2 column density NH2=2.21´1026
H2cm−2and line-of-sight path length of 30 pc, we infer a mean
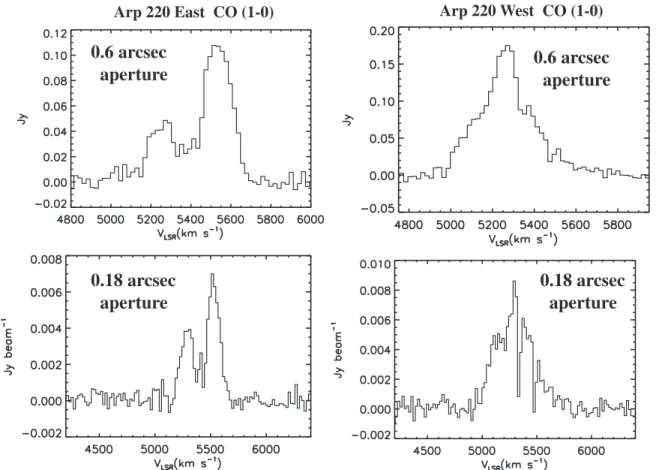
Figure 3.CO(1-0) emission from the east and west nuclei, in apertures of 0 8 (top panels) and 0 18 (bottom panels) diameter centered on each nucleus. The emission extends over 600–800 km s−1in both nuclei. Narrow self-absorption features can also be seen in some spectra(e.g., lower right panel). For the top panels, theflux in Jy is the integrated flux within the aperture; for the lower panels where the aperture is comparable with the beam size, we plot the average pixel value within the aperture(i.e., Jy beam−1). Note that in the bottom spectra the velocity range is much larger.
19
Alternatively, the Planck ratio of t250 mm NH=2.32´10-25cm2derived for Milky Way H2(Planck Collaboration2011b) translates to1.45´1026cm2
volume density ofnH2=2.4´106cm
−3in the central area of
the west nucleus.
At these extraordinarily high ISM densities, the dust and gas will be collisionally coupled (at nH2>104cm
−3) and in
thermal equilibrium (TD=Tk). Most molecular transitions at
millimeter tosubmillimeterwavelengths will have level popu-lations in thermal equilibrium with the H2gas. And if the dust
is optically thick into the millimeter regime, there will be substantial direct radiative coupling of the millimeter transi-tions to the dust radiation field. This is all consistent with the observed 187 K CO brightness temperature (see Table1).
3.6. The East Nucleus
For the east nucleus the dust optical depth is less. Wilson et al. (2014) estimate t434 mm =1.7 and T=80 K (compared to the above-mentioned values of 5.6 and 181 K for the west nucleus). This is borne out in our 2.6 mm continuum imaging, which indicates a peak of just 15 K for the dust in the east nucleus(after
removing the synchrotron and free–free contributions). This suggests t2.6 mm~ 0.2 (assuming TD=80 K). In this nucleus,
we cannot provide the equivalent energetic constraints as in the west from our data since the dust is not optically thick at l = 2.6 mm. However, from the ratio of τs derived by Wilson et al.(2014), one might infer that the east nucleus has ~1 4 the
luminosity of the west nucleus. Similarly, the ratio of dust opacities in the two nuclei suggests that the mass of dust and gas in the east nucleus is ~1 4 of that in the west nucleus. Better constraints will be provided by the high-resolution CO(2-1) imaging with ALMA, which is scheduled.
4. CO(1-0) Line Emission
Figure3shows the continuum-subtracted CO(1-0) emission line profiles for the west and east nuclei obtained in apertures of 0 8 diameter centered on each nucleus. The CO emission extends up to∼800 km s−1in each of the nuclei and is offset in the mean by∼120 km s−1between the two nuclei. In the west Figure 4.Integrated CO(1-0) line flux (top panels) and mean velocity (bottom panels) are shown. In the east nucleus the emission is clearly elongated along the major axis of the kinematics. In the west nucleus a hole is seen in the center coinciding with the dust continuum peak(see Section4.1). These images were computed with a
clipping cut to exclude from the line integrals any pixels below the 4σ noise level. The coordinate offsets are measured relative to the 2.6 mm continuum peaks (see Figure1). The contours are labeled with Jy beam−1and km s−1.
nucleus the line profile exhibits broad wings and a single peak, while in the east nucleus it is double-peaked.
Images of integrated CO emission and the intensity-weighted centroid velocity (á ñV ) are shown in Figure 4. The overall morphology of the gas distribution is remarkably different in the two nuclei. In the west nucleus, the total emission is less elongated along a major axis; there is a drop in the CO emission on the central resolution element (90 mas diameter); and overall, the emission is more compact(as was the case for the dust continuum).
Despite these differences, both nuclei exhibit a clear kinematic gradient, suggesting rotation. In the east nucleus, the kinematic gradient aligns closely with the major axis of the elongated CO intensity distribution. In the west nucleus the kinematic major axis is at PA 110 ; in this nuclear source- the emission intensity distribution is hardly elongated, and one does not see acorrelation with the major kinematic axis of either the CO or the continuum(see Table1). The magnitude of
the mean velocity gradients is impressive; in both nuclei, the shift is ∼500–600 km s−1 (see Figure 4,lower panels) over 0 3–0 4 (124–165 pc).
4.1. CO Hole on the West Nucleus
In the west nucleus, the central dip in the CO emission is coincident with the central dust continuum peak. The depth of the hole is approximately a factor of 3compared with the immediately exterior ring(see Figure4,upper right). Since the dust continuum in the west peaks strongly in the central resolution element, this dip in the CO emission is probably not due to a deficiency or clearing of ISM at small radii.
There are three possible explanations for the drop in the strength of the CO emission at the center:(1) the CO and the dust are in thermal equilibrium in this high-density core;(2) the high excitation temperature of the CO in the core depletes the lowest CO rotational levels, in favor of much higher J states, causing the CO(1-0) line to be optically thin; and (3) the CO emission from the core is self-absorbed by colder CO in the foreground along the line of sight.
Thefirst explanation is consistent with the very high column densityNH22 ´1026 H2cm−2 and volume density
= ´
nH2 2.4 106cm−3 deduced for the dust emission in Section 3.5. At these densities the H2 will be collisionally
coupled to the grain temperature,and TK=TD and the CO
levels will be thermalized, that is,Tx=TK. In this case, no line emission will appear in excess of the optically thick dust emission. This does require that the density must drop steeply at the outer radius of the dust photosphere to avoid there being an external chromosphere producing excess CO line emission outside the photosphere.
The second explanation, that the CO (1-0) line in the core has lower optical depth than the dust emission, could also follow from the very high excitation conditions in the core, compared to those in normal Galactic molecular clouds. This, combined with the large velocity widths expected in the core, could cause the CO(1-0) to be optically thinner than the dust at l = 2.6 mm. In low-density Galactic giant molecular clouds, the CO(1-0) line typically has more than a factor of 104greater optical depth than the dust at λ=2.6 mm. In the Arp 220 nuclei, this ratio is reduced by two orders of magnitude due to the ∼100 times higher gas velocity dispersion and another factor of 20–40 due to the ~20 40– times higher gas
temperature thatspreads the CO molecules over more levels. In addition, the stimulated emission correction to the optical depth will cause a further reduction. A modest depletion in the CO abundance could then cause the (1-0) line to be optically thin.
The third explanation, having the CO emission from the core be self-absorbed by low-excitation CO farther out along the line ofsight, requires that the foreground gas be coherent with that in the core, that is, at the same radial velocity. The CO emission at small radii will be predominantly at high velocities and thus is not coherent with gas close to the systemic velocity outside the nucleus.
In Arp 220 east, we do see three narrow absorption features (spatially offset 0 1 to 0 2 from the nucleus) within ±100 km s−1 of the systemic velocity; these absorptions are
sharp in velocity and never cover more than∼30 km s−1(e.g., Figure3,lower left). There is negative velocity absorption seen in CO(3-2), SiO (6-5), and HCO+(3-2), which is interpreted as an outflowing wind (Sakamoto et al. 2009; González-Alfonso et al.2012; Aalto et al.2015; Rangwala et al. 2015; Tunnard et al. 2015). However, forthe wind toproducethe
apparent hole in CO(1-0) only from the nucleus, the wind must be confined to radii 16 pc. This size is inconsistent with the larger spatial extent of the high J absorption lines. In addition, the outflow gas would only absorb the nuclear CO emission at negative velocities, leaving the other half of the emission unabsorbed.
Lastly, we note that if there were CO(1-0) absorption of the background continuum, we should expect that in the continuum-subtracted(1-0) spectra, we should see instances where the line emission has an apparent negative intensity (since too much continuum would have been subtracted at the line velocities). This is not seen in the spectra shown in Figures 3 or 9. If the foreground CO was absorbing only the background line emission from the nucleus, the continuum-subtracted spectra would not necessarily go below zero, but it is not clear why the foreground absorption would not also be absorbing the nuclear continuum. The“negative” intensity CO line could be suppressed if the continuum and CO line emission had different spatial extents.
We thus favor thefirst or second explanations to reasonably account for the CO hole in the west nucleus. The third explanation appears inconsistent with the high spatial resolu-tion spectra andrequires overlap of radial velocities between the nucleus and the foreground gas, and if the absorption takes place in an outflowing wind, then the positive radial velocity emission would be left unabsorbed.
4.2. CO Elongation in the East Nucleus
In the east nucleus, the CO emission is clearly elongated with a major/minor axis ratio of ∼3:1 (see Figure4,upper left) and 2:1 from the Gaussianfitting (see Table2). If the structure
is interpreted as an inclined disk, the former axis ratio implies an inclination of 70 to the line of sight. The east nucleus structure is clearly not axisymmetric:the peak in the CO emission is displaced ∼0 1 NE of the dust continuum peak (coordinate aD ,D =d 0, 0 in Figure4). There is also ∼50%
more integrated CO emission luminosity on the NE side than on the SW.
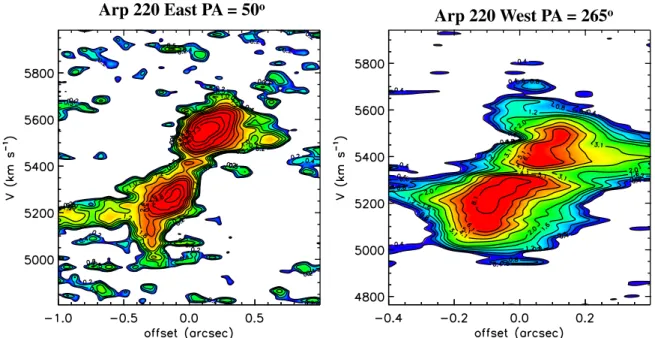
4.3. Major Axis Kinematics
Figure5shows the distribution of CO emission and the gas kinematics along the major axes of the west and east nuclei. The central reference position is taken to be the 2.6 mm continuum peak in each nucleus. In both nuclei the velocity gradient extends over approximately 700 km s−1. In the west nucleus, this velocity range is seen within±0 1 (R=41 pc) of the center; in the east, it occurs within±0 4 (R=165 pc) of the center. Figure 3illustrates the contrast in spatial extent of the high-velocity emission between the two nuclei when com-paring the top and bottom panels. The strip maps also clearly show the decrease in line emission on the nuclear peaks at the central velocities. At the same time, the central positions show a broad range of emission velocities: in the west, 4950–5700 km s−1, and in the east, 5150–5700 km s−1. This is also seen in the mean spectra for the nuclei shown in theFigure 3lower panels.
5. CO Emission Distribution and Kinematics In order to understand the small scale distribution of the CO emission and to place constraints on the gas kinematics, we have modeled each of the two nuclei with rotating disks inclined to the line of sight. This model, including a parameterized rotation curve and gas velocity dispersion, was thenfit to the observed CO line profiles on a well-sampled grid (60 mas spacing) in each nucleus, in order to derive the best-fit radial distribution of CO line emissivity. This was carried out using the maximum likelihood procedure developed in Scoville et al. (1983) with the modification that emissivities were
allowed to be different on the positiveandnegative offset sides of the major axis.
This modeling is donewith a 2D, infinitesimally thin planar disk with constant velocity dispersion as a function of radius.
This is obviously a much simplified model to describe the central disks in a merger system with a nearby companion and with energetic feedback from starformationand active nuclei feedback. The latter could be expected to result in velocity dispersion increasing toward the center, and the former would certainly warp any planar disk structure. However, given the limited resolution of the present observations relative to the scale of the disk, such higher order modeling is not yet warranted.
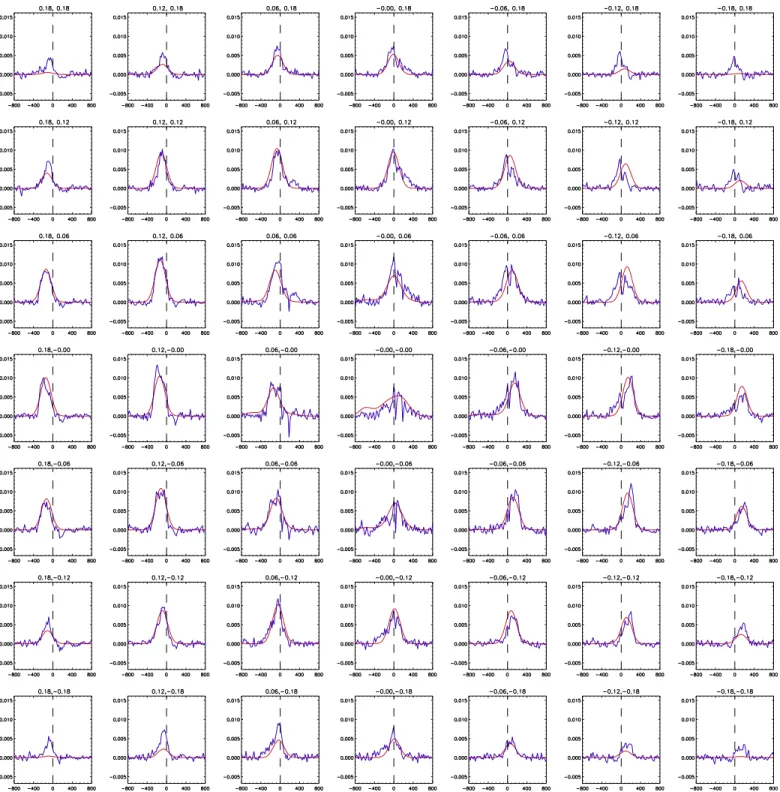
The models developed for the high-resolution CO (1-0) emission provide acceptable fits to the collection of observed CO(1-0) line profiles, with an overall reduced c ~ 4 62 – for both disks. The observed and model spectra are shown in the
Appendix. This is a goodfit, given the simplicity of the model (biaxisymmetric with a single velocity dispersion and rotation curve). The preliminary modeling results are shown in Figure6
and aresummarized in Table4. They establish the context for the discussion of the physical structure of the disks in Section5.2.
The dynamical mass estimates were calculated assuming a spherical configuration (see Section 5.1). The noteworthy
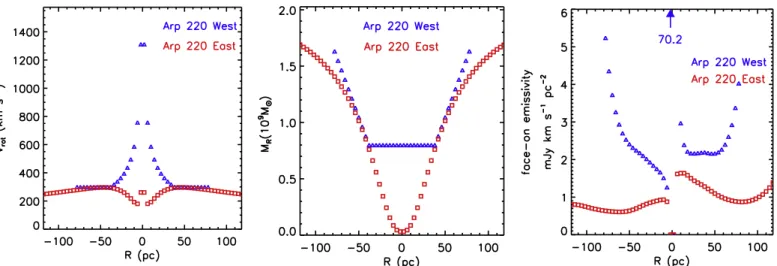
constraints from the disk line profile modeling are as follows:(1) a central point mass∼8×10⁸Mis apparently required in the west nucleus to provide a bestfit to the high velocities observed in the center, but no central point mass is required for the east nucleus (<108
M ); and (2) the overall dynamical masses are ~1.5´109
M at radii less than 70 and 90 pc, respectively. We expect that these parameters may change somewhat when we simultaneously model the other CO transitions and include the lower resolution imaging, but they set a framework for thepresent models. The full modeling with the complete data sets will be presented in Scoville et al.(2016).
Two cautions are in order with respect to the possible existence of a point mass in the west nucleus. First, our modeling has Figure 5.Spatial-velocity strip maps along the major axes of Arp 220 east(PA=50) and west (PA=265). The coordinate offsets are measured relative to the 2.6 mm continuum peaks (see Figure1). A positive offset coordinate corresponds to the receding (redshifted) side on the major axis; i.e., for the west nucleus,
thepositive offset is to the west,and for the east nucleus, the positive offset is northeast. Thus, on the west strip map (right-hand panel), the emission at offset=−0 4 and 5250 km s−1is emission from the east nucleus coming in, and on the east strip map (left-hand panel), the emission at offset <−0 5 and
assumed a constant velocity dispersion in each disk. This was done out of necessity to simplify the modeling. A large increase in the velocity dispersion(due to feedback) at the nucleuscannot be ruled out as a source of the large velocities at small radius. Second, the apparent point mass might be the result of extreme gas settling into the nucleus;that is, the large mass could be an interstellar gas concentration and not necessarily a black hole.
5.1. Dynamical Masses
Lastly, we provide a note of caution on the comparison of dynamical masses with the masses determined from the CO line
and dust continuum emission. If the dynamical mass is calculated in a simple spherical approximation fromMdyn=rVrot2 G, this mass estimate may be significantly different from that calculated from the observed kinematics assuming a disk mass distribution plus a central point mass.
The mass distribution in the nuclei of Arp 220 is very likely disk-dominated, and the spherical approximation is likely to incorrectly estimate the actual mass in such a configuration. We illustrate this with a simple model(similar to Arp 220 west): a central point mass of 5×10⁸ M and a disk of 109 M extending between r=20 and 80 pc with surface density Figure 6.Derived rotation curves ofenclosed dynamical mass as a function of radius are shown for the Arp 220 east and west disks as derived from fitting the high-resolution line profiles (see text). The dynamical mass is obtained in the spherical approximation withMR=RVrot2 G. The emissivity distribution(per pc
2of area) is
that which would be seen if the disks were face-on to the line of sight. The observed total integratedflux is the integral of this face-on emissivity corrected for inclination(i.e., multiplied by cos i). A central point mass of 8×10⁸
M is required in the west nucleus and only a limit of <108Min the east nucleus. The CO (1-0) emissivity shown in the right-handpanel is fairly flat with radius, except for the high-emissivity central point required in the west nucleus.
Table 4
Nuclear Disk Emissivity and Kinematic Models West Nucleus
Systemic velocity Vsys 5337 km s−1
Gas turbulence FWHM Dv 250 km s−1
Disk inclination i 30
Major axis P.A. 265
Rotation curve: Point mass ∼8×10⁸
M
Mass at<70 pc ~1.5´109M
CO emissivity: Peak atR<5 pc
Flat and 10×lower at R=10–50 pc axisymmetric
East Nucleus
Systemic velocity Vsys 5431 km s−1
Gas turbulence FWHM Dv 120 km s−1
Disk inclination i 45
Major axis P.A. 50
Rotation curve: Point mass <108M
Mass at< 90 pc 1.5´109M
CO emissivity: 0 atR<5 pc
Falls a factorof2 out to 100 pc
Peak at R∼10 pc
Receding side ´2 brighter
Figure 7.Circular velocities are shown for a mass distribution including a central point mass black hole(BH) of 5×10⁸
M and adisk of mass 109
M distributed with an r−2density falloff between 20 and 80 pc. The solid curve shows the proper circular velocity obtained by integration over the disk mass distribution, and the dashed curve isthe spherical approximation, that is, calculatingvcirc=(GM rr )1 2. The dot-dashed curve is the Keplerian rotation
curve associated with the central point mass. The dip at 20 pc is due to the net outward attraction in the inner regions of the disk; the cusp at 80 pc is due to there being no such outward attraction disk beyond 80 pc.
varying as r-2 and constant thickness. Figure 7 shows the circular velocity with forces determined properly for a central mass plus the disk. The circular velocity estimated in the spherical approximation (from the enclosed mass at each radius) is also shown for comparison.
The proper estimation (solid curve) and the spherical one (dashed curve) have significantly different vcirc. The differences
are due to the fact that in a thin disk configuration there is significant gravitational attraction in the outward direction by gas at larger radii. We defer a proper comparison of the emission-based mass estimates to a future paper, once we have full flux recovery of the CO and dust emission. The rotation curve shown in Figure 7 is somewhat higher than that in Table 4,but within the range of uncertainties due to the inclination angle. In Section 6, we note an added uncertainty with the dynamical mass estimates:that radiation pressure on the dust may also provide substantial pressure support in the disks.
5.2. Physical Structure of the Nuclear Disks
The high-resolution imaging presented here provides strong confirmation for the existence of nuclear disk structures in both nuclei of Arp 220, asfirst suggested by Sakamoto et al. (1999).
In the eastern nucleus the gas and dust emissions are clearly elongated, and this elongation aligns with the major axis of the CO velocity gradient. In Arp 220 west, the emission is not so clearly elongated, but there is a strong gradient in the CO line velocity at PA;265 . The lack of elongation in the emission distribution is likely due to the fact that the west nucleus is more compact and the kinematics suggest a more face-on inclination (inclination i=30 , compared to 45 in the east nucleus; seeTable4).
These nuclear disks are extraordinary structures with 109
M within radii <50 100– pc, and the two nuclei are only∼412 pc apart. Here, we discuss the mean ISM properties in the nuclei, the physical structure of the disks, maintenance of the disks, and the energetics of the nuclear sources. At this point, lacking the full data sets, our discussion is qualitative andintended to be illustrative of the physical considerations. The present observations do not recover all of the line and continuum flux from the region since they include only long baseline data and only the l ~ 2.6 mm observations; we anticipate a more thorough analysis when the low-resolution observations are completed including CO(2-1) and (3-2) line emissions with complete flux recovery. The observations reported in this paper do not include short spacing data, and hence they do not recoverflux associated with the large-scale structures 0. 5 or 200 pc.
Lonsdale et al. (2006) report Very Long Baseline
Inter-ferometry (VLBI) at 18 cm wavelength and ∼1 pc resolution, detecting 49 point-like sources, which they interpret as super-nova remnants(SNRs;see also Parra et al. 2007). The sources
are tightly clustered in the two nuclei,with 75% of the sources in two regions: 0.25´ 0. 15 (west nucleus) and0.3´ 0. 2 (east nucleus). In both cases these rectangles are aligned with the PA derived above for the disks. The estimated supernova (SN) rate is 4±2 yr−1based on the appearance of new SN between the epochs of the observations. The fact that 22 of the 49 SNRs are in the east nucleus and 27 in the west nucleus strongly suggests that the total star-formation rates are similar for the two nuclei, 45% versus55%. The fact that only 25% of the 49 SNR are
outside the two compact nuclear regions implies that relatively little (25%) of the total star formationoccurs in the larger regions of Arp 220.
Lastly, we note one puzzle. In the west nucleus, the kinematic modeling of the intensity and velocity distributions suggests a low-inclination disk(i=30 , Table4), yet this is inconsistent
with the elongated distribution of the SNRs (having a 2.5:1 major:minor axis ratio;Lonsdale et al. 2006)for which one
would infer i;60 for a thin disk. Two possible resolutions of this contradiction are(1) either disk gas is more inclined than 30 but the north and south extents of the west nucleus gas are increased by minor axis outflows or there isa substantial thickness to the disk or(2) the SNRs are locatedpreferentially along one axis within a low-inclination disk. The latter might occur if the nuclear disk had a central bar in which the most recent star formationwas preferentially occurring. However, the rotation period of the disk is only a few megayears,and it is unlikely that the massive stars formed in a bar would remain in a bar until the time that they undergo SN explosions. Higher resolution imaging and kinematics are probably needed to address this inconsistency.
5.3. Summary of Observational Parameters
For the purpose of the numerical evaluations in the discussion below, we adopt approximate estimates for the masses, radii, and luminosities for Arp 220. These are meant only for physical perspective in the discussion and are probably uncertain by factors of 2or more. For the ISM masses, we adopt ~1.5´109
M for each of the Arp 220 disks with their radial extents being 80 and 130 pc for the west and east nuclear disks, respectively(Table4), since the deconvolved radii are 74
and 11 pc(Table2). The velocity dispersions derived from the
line profile fitting are s = Dv vFWHM 2.3110 and 50 km s−1, respectively(s3D= 3s1D).
In the west nucleus the central point-like concentration has a mass of between 8×10⁸and 3×10⁹Mas derived from the gas kinematics and the dust emission, respectively. Resolution of this discrepancy may be possible with the higher resolution 1.3 mm observations, which will allow better constraints on the kinematics and on the true dust temperatures in that source. Below, we adopt 109 Mfor the unresolved mass within
R 15 for this extreme concentration.
The total infrared luminosity of Arp 220 is1.9´1012
L . Using the mid-infrared, high-resolution(∼0 4) photometry from Soifer et al.(1999, Table 3), we take the view that the majority of this luminosity arises from the two nuclei, apportioned 2/3 (west) and 1/3 (east;i.e., 1.2 and0.6´1012
L ). We caution that these estimates are approximate since the 3–24 μm photometry (Soifer et al. 1999) is not at the l~ 70 m far-m
infrared luminosity peak; also, the distribution of SNR is more nearly equal for the two nuclei (Lonsdale et al. 2006; Parra et al. 2007). Some of the overall luminosity is also likely to
originate at larger radii; the above luminosities should therefore be taken as upper limits to the luminosity of each nucleus.
5.4. Disk Structure
The formation of gaseous disk structures in the nuclei of merging galaxies is likely an inevitable result of the gas sinking dissipatively into the central regions more rapidly than the main stellar component of the galaxies. This results in
a gaseous bar leading the stellar bar(since the gas has sunk to smaller radii), and the stellar bar then exerts a back-wardtorque on the gaseous bar to further reduce its rotational angular momentum (see Barnes & Hernquist 1992, 1996).
The gas forms a rotating disk since vertical motions are efficiently damped out once the gas becomes concentrated, while the angular momentum is removed on a much longer timescale.
The thickness of the disk is determined by equilibrium between the gravitational forces toward the midplane of the disk and the gas motions in the vertical direction. These gas motions will be damped if two parcels of gas collide; their bulk kinetic energy is then converted to thermal energy in shocks. The high density of the molecular gas ensures that the shocks radiate the postshock thermal energy very efficiently. The net result is that the kinetic energy associated with vertical motions needed to maintain the disk thickness is radiated on a timescale similar to the collision time of the gas parcels. In order to maintain the thickness of the disk and its associated vertical motions on a longer timescale, constant replenishment of the turbulent energy is required.
The typical timescale for collision of gas parcels and the dissipation of the turbulent motions is given by the vertical crossing time of the disk and the fraction of the disk areafilled by gas parcels as viewed perpendicular to the disk:
t t s = = f H f . 4 a v a dis cross ( ) ( )
Here H is the full thickness of the disk, and fa is the areal
covering factor of the disk.
5.5. Disk Area Covering
The disk areal covering factor must be of order unity. The observed CO peak brightness temperature is comparable with the estimated dust brightness temperatures (200 K)and hence the dust temperature, since the dust is nearly optically thick. The CO peak brightness temperature in the west disk is 187 K (Table1),and the areal covering factor for the CO-emitting gas
must be∼1. In the east disk, the CO peak is 175 K, implying a similarly high areal covering factor.
5.6. Disk Thickness
For the nuclear disks, we may estimate the disk thickness assuming that the vertical distribution is determined by equilibrium between the gravitational force in the zdirection and the observed gas 1D velocity dispersions(s 1Dv( )). We do this under the very simple assumption that the vertical velocity dispersion is constant with radius and that the disks are in equilibrium. Specifically, this assumes that outflow winds are not contributing to the vertical scale height.
We consider two cases:(1) where the gas disk mass surface density is much less than that of the stellar disk or spheroid, and(2) where the surface density is dominated by the gaseous disk (i.e., a fully self-gravitating disk). The former is appropriate for low-z galactic disks, where the ISM mass is typically only 5%–10% of the stellar mass. The latter is likely to be most appropriate for high-z galaxies withlarge gas-mass fractions or the gaseous nuclear disks as in Arp 220 where the
gas has been preferentially funneled to the nucleus faster than the stars.
In the non-self-gravitating case, the vertical distribution of the gas will have density r=r0exp -z z2
0 2
( ). If we define the disk thickness(H) as the full thickness at which the density has dropped by a factor 1/e, then H=2 z0. For a spherical
distribution of stars, ⎛ ⎝ ⎜ ⎞ ⎠ ⎟ s = H r V r 2 2 v 1D . 5 rot ( ) ( ) ( )
For a typical low-z galaxy where the stellar distribution is disk-like, the vertical frequency n Wz rot~ 3, and the thickness is reduced by a corresponding factorof∼3.
In a fully self-gravitating gas disk, the vertical distribution is r=r0sech2 z 2z 0 ( ( )) with s p r s p = = S z r G D G 1D 8 1 2 , 6 v v 0 0 2 disk ( ) ( ) ( ) ( )
where Sdisk is the mass surface density of the gas disk. For a Mestel disk,Sdisk = Vrot 2pGr
2 ( ), and therefore ⎛ ⎝ ⎜s ⎞⎠⎟ = z r V r 1D . 7 v 0 rot 2 ( ) ( ) ( )
In thiscase, the equivalent full thickness at which the density has dropped by 1/e isH r( )4.34 z0: ⎛ ⎝ ⎜ ⎞ ⎠ ⎟ s = H r V r 4.34 v 1D . 8 rot 2 ( ) ( ) ( )
Figure8 shows the disk scale thickness (H) variation as a function of r for the west and east disks(Table4), indicating H
ranging from 1 to 30 pc at r< 50 pc. The disk crossing times (and thus the turbulent dissipation timescales) shown in the right-handpanel of Figure8 are 105to4 ´10 years5 .
In order to maintain the disk vertical structure and its observed velocity dispersion, it is required that the turbulent energy in the gas motions be replenished on a similar timescale. The sources of this input might include(1) starburst and AGN power and the momentum associated with their radiation,(2) the pressure support provided by radiation liberated by the turbulence dissipation, and (3) the gravitational potential energy released as the gas accretes inward and the potential energy associated with the decaying orbits of the two nuclei. These are discussed and evaluated in Section5.8.
5.7. Disk Gas Properties
For the masses and radii given above, we estimate the mean gas densities in the two disks. From the fitting of the line profiles across the two disks, the best-fit model has approxi-mately constant CO line emissivities as a function of radius outside the central R=10 pc, with the west disk having a factor of 2–3 higher mean emissivity compared to the east disk;
on the other hand, the east disk has a larger radial extent. We adopt amean disk thickness in the zdirection of 10 pc. The mean H2density(not correcting for He) is then given by
⎛ ⎝ ⎜ ⎞ ⎠ ⎟ ⎛ ⎝ ⎜ ⎞ ⎠ ⎟⎛ ⎝ ⎜ ⎞ ⎠ ⎟ p á ñ = á ñ = ´ ´ - n M n M M H R 4 R H m 1.7 10 10 10 pc 100 pc cm . 9 H disk 2 H H 4 9disk FWHM disk 2 3 2 2 2 ( ) ( )
For the mean thickness of 10 pc and density nH2
´
1.7 104cm−3, the column density through the disk is
= ´
NH2 5.2 1023cm
−2. Assuming a standard Galactic ISM
gas-to-dust ratioNH2 AV =1.0´1021cm
−2mag−1, wefind a
typical extinction of AV =520 mag. The disks will thus be optically thick to any NIR–UV radiation emitted by young stars formed within the disks.
Onefinal question is the structure of the molecular gas disk: Is it composed of a smooth gas distribution or discrete clouds (e.g., giant molecular clouds, or smaller clouds)? If the observed velocity dispersion σ=50–100 km s−1 is due to internal motions within individual clouds and if these clouds are gravitationally bound, virialized, and have uniform density, then their masses areMcloud=5 3Rsv(internal)2 G. If the 3D sv(internal)=100 km s−1and one requires that their density be twice the mean disk density (á ñ =nH2 1.7´10 cm4 -3), their masses must be ∼7×10⁷ M with radii=18 pc (the resolution of the observations). However, the area covering factor for the disk would then be inadequate ( ~fa 0.1),and their size would be larger than the disk thickness.
For higher density self-gravitating clouds, the area covering factor is even lower. Lower density self-gravitating clouds would be larger andhave a more appropriate area covering
factor, but then their density contrast would be sufficiently small that one might as well think of the disks as continuousrather than asa cloudy medium. We are thus led to the conclusion that the gas cannot be in discrete clouds but must be a fairly continuous medium (albeit with some clumping) distributed over the disk area.
To summarize,(1) if the gas is indeed relatively smooth (i.e., not in discrete clouds as in the Galactic disk), it must still have highly supersonic motions with Mach number >100.(2) If these motions are not in the form of smoothly varying flows, then the turbulent kinetic energy dissipates on a disk crossing time of ~10 years5 (Figure 8,right). (3) The turbulent kinetic energy must then be replenished within the dissipation timescale in order for the structure to last at least one rotation period of the disk. If the disk does not last this minimum time period, we should not expect to see a disk structure with the high velocity dispersion observed. (4) Alternatively, if the motions are in an ordered flow (and therefore lessdissipative), the scale over which the velocity field varies must be smaller than the spatial resolution of our observations of∼30 pc.
A hybrid picture—clouds of dense gas (with low areal covering factor) embedded in a diffuse molecular medium of low column but high enough areal covering factor to account for the CO brightness temperatures—might also be viable. Most of the mass would have to be in the compact, high-density clouds to avoid having the kinetic energy associated with their bulk motion rapidly dissipated by friction as they move through the diffuse medium. In this case, a large reservoir of kinetic energy is stored in the compact clouds, which stir up motions in the diffuse medium without dissipating significant kinetic energy. And of course, such clumps might not be long-lived, but rather arebeing formed and then destroyed. Discriminating this hybrid picture from a more continuous model will require high-resolution measurements of the brightness temperatures for high excitation emission lines, to assess the areal covering factor of Figure 8.Left panel: the estimated scale heights of the west and east disks are shown based on Equation(8) using the rotation curves shown in Figure6and velocity dispersions sv(1D)= Dv(FWHM) 2.3from Table4, i.e., 1D velocity dispersions were taken to be 109 and 52 km s−1, respectively. Right panel: the disk crossing timescale(H/s 1Dv( )),which is equivalent to the turbulent dissipation timescales calculated from Equation (4) with fa=1.
the dense component, and rare isotopes of CO to constrain the line optical depths.
5.8. Energy and Momentum Considerations
There are several sources of energy input to the gas thatmight replenish whatever losses there are in shock fronts: the radiative and mechanical energy and momentum input from the starburst, the gravitational potential energy resulting from shrinking of the two disks, and thefinal merging of the galactic nuclei. Taking a characteristic timescale of 1 Myr(which is an upper limit to the dissipation timescale if the motions are dissipative), we may compare these sources.
The total energy in the radiation field associated with L=1012Lintegrated over 1 Myr is1.1´1059erg. The total energy contained in the motions associated with the observed velocity dispersion sv(1D)=100km s−1is3 2(Msv(1D) )2 =
´
4.5 1056erg forM =1.5´10
ISM 9M(the 3 is to convert to a3D velocity dispersion). The potential energy associated with each disk and with the binary merging galactic nuclei is larger than that calculated above for the dispersive gas motions, by a factor V/s 3Dv( ))2 1, where V is the disk rotation velocity or the relative velocity of the nuclei.
Although the energy in the radiation field is vastly larger than that in the gas motions, it is more appropriate to compare the radiation momentum with that in the gas, since the gas motions are more likely to be driven by the radiation pressure than by expansion of hot gas heated by the radiationfield.
The radiative momentum input(L/c per unit time) integrated over 1 Myr is3.7´1048gr cm s−1; the momentum in the gas is 3×1049gr cm s−1, that is, an order of magnitude larger. The momentum input over the same time period from supernovae at a rate of∼4 yr−1 (Lonsdale et al. 2006;assuming 5 Mof ejecta in the momentum-conserving phase starting at
vexp 1000 km s−1)is ´4 1048gr cm s−1. In summary, if the gas motions are dissipated on a disk crossing timescale, there is no obvious source for their replenishment other than the large-scale gravitational field of the galaxy.
5.9. A Semicoherent Disk Wave Pattern
In the last section, we found that there are no known localized sources of energy to replace that which is dissipated on a disk crossing timescale. Here we explore the possibility that the observed velocity dispersion is due to “coherent” flows or waves within the disks. The flows must be semicoherent to reduce dissipation. The scale over which theseflows must span the full range of velocities ( s2 v) must be significantly smaller than the observational resolution of 37 pc. Clearly, this will not avoid all dissipation, since there will be some regions where theflow still has shocks, but in the absence of dispersive motions throughout, the overall dissipation might be reduced an order of magnitude. One possible scenario could be wave motions in the disks generated by the tidal field of the two merging galaxy nuclei—a dumbbell-like potential. The characteristic scale of such gravitational perturbations is 100 pc, that is, much larger than the required 30 pc scale. On the other hand, one expects that the energy input at long wavelengths should decay to smaller wavelengths, as in a turbulent cascade.
A gas parcel of unit mass moving in the z direction perpendicular to the disk will execute aharmonic motion relative to the midplane with the restoring force due to the central point mass and the disk mass at lower z height:
p r = -+ = - F G M r z z G M r z F G z and 4 r r central 2 2 3 2 3 disk ( )
where the disk is assumed to have constant mass densityρ over scale height H at radius r, and Mris the mass interior to r(disk
and central mass). The scale length H for the harmonic motion is then s w w w w p r = + = = H GM r 2 where and 4 G . 10 v c d c r d 2 2 2 2 2 3 2 ( ) These waves would be analogous to gravity waves,possibly generated by the tightly wrapped spiral pattern excited in late-stage mergers by the companion nucleus.
6. Radiation Pressure Support
As noted in Section5.1, it might appear difficult to reconcile the mass estimates for ISM within the disks (as well as any central components such as a black hole or compact dust source) with the observed rotation curves assuming circular motions. However, the high opacity of the dust will mean that there is substantial absorption and re-emission of the infrared radiation and, therefore, pressure support from the radiation field, since the dust is optically thick, even at far-infrared wavelengths(Scoville2003; Thompson et al.2005,2015).
Assuming the Mestel disk, with Lr and Mr being the
luminosity and mass as a function of radius in the disk, then the condition that inward gravitational forces are balanced by the outward radiation pressure is
kr p r p k = L c rH GM r L M c HG r 2 , implying 2 , 11 r r r r 2 ( )
where κ is the radiation absorption coefficient per unit mass weighted to the effective wavelength of the infrared radiation field at each radius. Using Equation (8) for the ratio H/r,
Equation(11) becomes ⎛ ⎝ ⎜ ⎞⎠⎟ p k s = L M G V 8.6 c . 12 r r v rot 2 ( )
Lastly, we require κ at the wavelengths of the far-infrared radiation in the disks. For the standard ISM gas-to-dust ratio NH AV =2 ´1021cm−2, k 312V cm2gr−1,and for kIR k ~ 1 30V (Pollack et al.1994; Scoville2013; Thompson