Development of a Multi-Stage Bubble Column
Dehumidifier for Application in a Humidification
Dehumidification Desalination System
by
Steven Lam
Submitted to the Department of Mechanical Engineering
in partial fulfillment of the requirements for the degree of
Bachelor of Science in Mechanical Engineering
at the
MASSACHUSETTS INSTITUTE OF TECHNOLOGY
June 2012
©
Massachusetts Institute of Technology 2012. All rights reserved.
Author
.
Department of Mechanical Engineering
May 24,2012
Certified by
.
John H. Lienhard V
Samuel C. Collins Professor of Mechanical Engineering
Thesis Supervisor
Accepted by
.
John H. Lienhard V
Samuel C. Collins Professor of Mechanical Engineering
Undergraduate Officer
Development of a Multi-Stage Bubble Column Dehumidifier
for Application in a Humidification Dehumidification
Desalination System
by
Steven Lam
Submitted to the Department of Mechanical Engineering on May 24, 2012, in partial fulfillment of the
requirements for the degree of
Bachelor of Science in Mechanical Engineering
Abstract
The Center for Clean Water and Clean Energy at MIT and KFUPM have been de-veloping many novel desalination systems. One of the new technologies originating from the Lienhard Research Laboratory is the Humidification Dehumidification de-salination system, or HDH. In many ways HDH resembles the natural rain cycle for producing fresh water, in that sea water is evaporated from oceans into humid air that travels up into the atmosphere, before condensing and producing precipita-tion. That precipitation is then collected as fresh drinking water. One of the main hindrances with carrier gas based desalination systems over traditional thermal de-salination systems like multi-flash distillation (MSF) systems is that there is a large thermal resistance in the dehumidifier between the carrier gas and the condensing coils resulting in poor heat transfer rates. The proposed solution is to create a bub-ble column for improved condensation. The condensing coil will be submerged in a body of water while humid air is sent through a sieve plate to create bubbles in this body of water where it will condense directly. Firstly, a single stage bubble column was designed, built, modeled, and tested. The model theoretically predicts the effects of bubble diameter, superficial velocity, liquid height in column, inlet mole fraction of vapor, impact on coils, and particle integration. Through experimentation it was shown that it was possible to achieve heat transfer rates of of 4 kW
1m
2 up to 20 kW1m
2; rates that are 10 to 30 times that of existing state-of-the-art dehumidifiers.
Secondly, a multi stage bubble column was designed, built, modeled, and tested in a full HDH system. Multi-staging is done to improve the effectiveness of the system. A three stage column was able to achieve an effectiveness of 89.4%.
Thesis Supervisor: John H. Lienhard V
Acknowledgments
This project was a large undertaking that required hard work and numerous late nights. However, there would not be anything without the help and guidance of numerous people.
First of all I'd like to thank my dear friend Seth Berg. He has always been excited and encouraging whenI talked about my project. He also took a lot of time off during finals week to review my thesis.
I'd like to thank the great folks at the Edgerton Machine Shop, Mark Belanger and Josh Dittrich, and the folks at the Hobby Shop, Ken Stone, Hayami Arakawa, and Brian Chan. There were several steps in building these large systems; the first one being the design and the second is the fabrication of the design. These great folks were always available to give me advice on how to properly machine my parts.
I'd like to thank Karan Mistry and Ronan McGovern of the Rohenshow Kendall Lab for their helpful tips and positive encouragement. Ronan was one of the first people that I had ever met in the lab and made me feel welcomed to be there. Karan was always friendly and would later be my 2.006 recitation instructor. He taught me core principles of 2.006 but more importantly helped me appreciate Thermal Fluid Mechanics.
I'd like to thank Professor Mostafa H. Sharqawy from KFUPM and Dr. Fahad AI-Sulaiman. Mostafa was integral in the development of the first single stage bubble column. His column designs and experimental setup were the key initial components that allowed the project to flourish. Mostafa provided a lot of guidance in the devel-oping our first setup and gave me the encouragement to become heavily involved in this group. Fahad helped me design the humidification system needed for our multi-stage setup. With his proficiency in thermal systems he made suggestions about the design of the humidification system that made it much more effective.
I'd like to thank Max St. John and Victor Nevarez for their assistance and com-pany. As UROPs and thesis students we have worked on many different structures side-by-side. Due to a lot of similarities between our projects we have ended sharing
a lot of components and setups. Whenever I needed an extra hand both of you were always willing to help out. In addition, your humorous company has made the work all the more enjoyable.
I'd like to thank Professor John H. Lienhard V for all his knowledgeable input on this project. As a leader in desalination technologies his expert advice has directed my project in positive directions that has led to a lot of profound results in what I would consider a very short amount of time.
Finally, and most importantly, I'd like to thank Prakash Govindan for his mentor-ship in this project. It would not be an understatement to say that without Prakash there would not be a project and we would not have made as many discoveries as we have made. His constant supervision mixed with his leisure attitude allowed us to make progress at an astounding pace. He gave me the perfect amount of supervision and freedom. I was allowed to design the systems as I thought would best suit the experiments and allowed to make mistakes and learn from my errors, and I can say a lot of errors and oversights were made. That type of freedom shows that you were confident in my abilities which gave me confidence to attack the problems in front of us. I look forward to working together in the future and see what fortunes await us. Thank you everyone.
Contents
1 Introduction
1.2 Conventional Desalination Technologies . 1. 2.1 Multi-Stage Flash Desalination 1.2.2 Reverse Osmosis Desalination . 1.1 Motivation for Desalination
17
18
19
19
20
2 Humidification Dehumidification Desalination
2.1
Overview.2.2
Benefits2.3
Demerits.3 Single Stage Bubble Column
3.1
Overall Concept .3.2
Design . . . .3.2.1
Frame3.2.2
Sieve Plate Profile3.2.3
Coil Designs .3.2.4
Humidifier . .3.2.5
Experimental Setup.3.3
Analysis3.4
Results.3.4.1
Bubble Diameter3.4.2
Superficial Velocity 2323
2425
27 2729
29
30
32
32
3436
38 3839
3.4.3
Liquid Height in Column. . .40
3.4.4
Inlet Mole Fraction of Vapor .41
3.4.5
Impact .41
3.4.6
Particles42
3.4.7
Others Variables43
4 Multi Stage 454.1
Overall Concept .45
4.2
Analysis47
4.3
Design49
4.3.1
Column49
4.3.2
Sparger Plate51
4.3.3
Coils . . .52
4.3.4
Air Chamber53
4.3.5
Humidifier ..53
4.3.6
Experimental Setup.54
4.4
Results . . .55
4.4.1
Temperature Profiles55
4.4.2
Effectiveness. . . .56
4.4.3
Column Diameter .56
4.5
Cost . . .57
5 Conclusion 59 A CAD Drawings 61 B Tables63
List of Figures
1-1 Water scarcity across the globe [3] . . . 18 1-2 Schematic diagram for a multi stage flash desalination system [10] 20 1-3 Depiction of a Reverse Osmosis membrane . . . 21 2-1 Schematic diagram of a closed loop HDH system [9] 24 3-1 Schematic diagram for a single stage bubble columnaiche 28 3-2 Resistance model for a bubble column heat exchanger [6] 29 3-3 Left: CAD depiction of tank. Right: Actual fabricated tank. 30 3-4 Mott Corp. 2240-AI6-10-AOO-I0-AB Precision Sparger Element with
connector fitting. . . 31 3-5 Left: Cad model with no.2 sparger plate. Right: Actual fabricated
sparger box with no.5 sparger plate. . . 31
3-6 Left: Circular design Right: Serpentine design 32
3-7 Left: Bubbles avoid impacting the coils Right: Bubbles makes several impacts while rising. . . 33
3-8 Schematic diagram of the humidification tank. 33
3-9 Left: The humidification tank with C-clamps sealing the tank. Right: Inside of tank. Note that the water is not boiling. 34
3-10 Schematic diagram of test apparatus [6] . 35
3-11 Single stage bubble column HDH setup . 35
3-12 Chart for humidity ratios that vary with temperature [2] 37 3-13 Effect of bubble diameter on the total heat flux in the bubble column 39 3-14 Effect of superficial velocity on the total heat flux in the bubble column 40
3-15 Effect of inlet mole fraction on the total heat flux in the bubble column 41
3-16 Effect of impact on the total heat flux in the bubble column . . . 42
4-1 Left: Parallel flow Right: Counterflow. . . 46 4-2 Left: Parallel Heat Exchanger Right: Counterflow Heat Exchanger. 46
4-3 Different counterflow temperature profiles 48
4-4 Counterflow exchanger with poor effectiveness 48
4-5 Multistage parallel flow temperature profiles . 49 4-6 Left: CAD model w/ 1 stage Right: Fabricated model w/ 2 stages and
insulation . . . 50
4-7 Circular sparger plate. 51
4-8 MS coil designs . . 52
4-9 MS coil side profile 53
4-10 MS humidifier showing the spray nozzle and platform 54 4-11 Schematic diagram of MS system and instrumental layout 55 4-12 Effect of number of stages on the total heat flux in the bubble column 56
4-13 Effect of column diameter on heat flux in the bubble column 57 4-14 Left: Path of Condensing Fluid Right: Column bubbling 58
A-I CAD diagram of the polypropylene blocks 61
List of Tables
B.1 Dimensions of 5 different configurations for sparger plates. B.2 Instrument designation chart . .
B.3 MS condensing coil dimensions. 3.1
4.1
Different particle properties . . . .
Circular sparger plates dimensions.
43
52
64 64
Nomenclature
Different symbols used through the paper
Acronyms BC Bubble Column
HDH
Humidification Dehumidification MS Multi Stage MSF Multi-Stage Flash RO Reverse Osmosis Re Reynolds Number SS Single Stage OD Oustide DiameterID
Inside DiameterA
Area[m2]cp Specific Heat Capacity
[J
/kgK]d Diameter [m] h Enthalpy
[J
/kg]m
Mass Flow [kg/s]P
Pressure [kPa] T Temperature[K]
¥-
Volumetric Flow [m3/s]E
Energy[J]
Q Heat[J]
Symbols
Q
Heat Transfer Rate [W]W
Work[J]
\IV
Work Rate [W]v Velocity [m/s2] p Density [kg/m3]
9 Gravity [m/s3]
C
Heat capacity rate [W/K]
z
Height [m]E Heat loss
[%]
qflux Heat Flux [kW /m2]
in,i inlet side
out,o outlet side
w water
da dry air
Subscripts wv water vapor
c cold
h hot
min minimum
Chapter 1
Introduction
Water scarcity is a problem that affects one-third of the population across the globe, up to 2 billion people [3]. This global problem is expected to worsen due to increasing population. A way to counter this problem is to produce more fresh water to meet our needs. One of the technologies that the Lienhard Research Group is working on is to desalinate seawater using Humidification Dehumification Desalination System, or HDH. HDH has several advantages but its main demerit is the poor heat transfer rate in the condensing coils in the dehumidifier. The proposed solution is to create a bubble column dehumidifier [4]. Air is sent through a sieve plate to create bubbles in a body of pure water. The water from the humid air bubble is condensed in the bulk and the energy is transferred to the coil immersed in the column of liquid. This leads to very high heat and mass transfer rates for dehumidification. In addition, the effectiveness of the device is maximized by multi-staging the bubble column to recover as much energy as possible from the dehumidification process.
In the following chapter, a brief description of HDH systems is given so the reader has background on the HDH technology and why it is used. Single stage bubbles columns are fully analyzed in Chapter 3 along with experimental modeling, designs for the system, and test results. A system approach analysis is used to analyze multi-stage bubble columns for their effectiveness in chapter 4. Finally a description on implementability, scalability, and feasibility is given on HDH systems, on page 57, as designed in this thesis. An overall energy consumption analysis is not given, however
a comparison is made between this system and those existing in the market.
1.1
Motivation for Desalination
Water scarcity is a growing problem around the world with nearly 1/5 of the pop-ulation living in areas of physical scarcity and every year this problem worsens [3]. Fresh water lakes are shrinking and ground water supplies are being depleted. There are areas in the world, like the Sahara, that have more evaporation than precipitation that makes the land very dry, and those that do not are under a lot of water stress. Water stress is the amount of water withdrawal over the difference in precipitation and evaporation. Even many of the developed countries are experiencing a high water stress, meaning each year they use up all the precipitation they receive and consume water from a reserve.
lillieor no watersearoily
PhYSilca) water scaJcity
testimated Approaching phy§i"ca
walerSicarcily
Figure 1-1: Water scarcity across the globe [3]
The world is covered by 71 % of water, 97% of that water is salt water. That means a mere 3% is fresh water, and most of that is trapped in glaciers [7]. By these figures alone it would seem sensible to turn some of the salt water into usable fresh water
through desalination. With the current state of desalination technology, desalination is only viable as a local solution. Fortunately, half of the people in the world live in cities and most of those cities are near coasts with a near endless supply of saltwater to treat.
1.2
Conventional Desalination Technologies
Various desalination methods are available on the market and are being actively used across the world. Saudi Arabia, the country that produces the most amount of desalinated water, produces nearly 70% of their fresh water through desalination; the US is the third largest desalination country. The two most widely used methods are multi-stage flash desalination and reverse osmosis desalination [7]
1.2.1
Multi-Stage Flash Desalination
The most common way of producing fresh water is to distill water from saltwater known as multi-stage flash distillation. The process is simple and starts with salt-water being heated to high temperatures (around 100°C). At those temperatures water is flashed (pressure is dropped via a hydraulic pressure drop) to evaporate as steam, leaving behind the brine which contains the contaminants and the ionized salt particles. The steam then rises and hits the heat exchanger resulting in a loss of heat, condensation, and collection in the form of freshwater. To improve the effectiveness of this system the saltwater is used as the cool fluid flowing through the exchanger. As seen in Figure 1-2, there is a hot end and a cold end of the system with mod-erate temperatures in the midsection. Saltwater starts at the cool end, heating up as it goes through the stages, until it reaches the hot end where it is almost at the appropriate temperature, needing only a bit more heat. That vaporized saltwater is sent through the system as described above is cooled down and is collected as brine at the last stage. The counter flow heat exchanger is used to minimize the heat loss in the system.
rJ
~4---:
- - - 1
C ....
~r---A ...- - - ,
B
>---..
A Steam in, B Seawater in, C Potable water out, 0 Waste out, E Steam out, F Heat exchange, G -Condensation collection, H - Brine heater
Figure 1-2: Schematic diagram for a multi stage flash desalination system [10]
needed to drive the system. This thermal energy is typically produced using fossil fuels although that can lead to a large carbon footprint. Multi-stage flash systems are applied in large-scale (several 100,000s of m3/day) systems and almost exclusively in co-generation (water and power) situations. They are not normally applied in small-scale standalone desalination systems.
1.2.2
Reverse Osmosis Desalination
The second most common method being used is a membrane filtration system known as reverse osmosis. The membrane is designed to prevent particles and ions from flowing through its filter while allowing water to flow through. Typically an electric pump is used to pressurize the inlet fluid to overcome the osmotic pressure difference across the membrane. The solute is contained within the pressurized side while the distillate emerges on the other side.
In a system like this there are still many drawbacks. The membrane is costly to produce and needs to be maintained very frequently by expert technicians due to fouling by ions. The separation efficiency of the membrane varies according to salinity, pressure, and water flow, and a solution with high salinity can very adversely affect the performance of the membrane. For applications in developing world situations, RO systems are thought to be too resource intensive.
Salt Water
High Pressu re
Clean Water
Chapter 2
Humidification Dehumidification
Desalination
An overview of HDH is necessary to understand the importance of the improvements suggested in this thesis. HDH desalination has been known for many decades but is still a rather poorly understood technology when you compare it to MSF or RO which have been thoroughly studied for many years. Only recently have large strides been made that allow HDH to be a feasible solution to the freshwater problem.
2.1
Overview
Humidification Dehumidification is a form of thermal desalination that is based on simultaneous heat and mass transfer devices. It is similar to MSF in that it is a dis-tillation technology although it uses air as a carrier gas. Some of the main attractions of this device is that it uses low grade heat to provide the thermal energy needed to power the cycle and can be operated at near ambient pressures. Low grade heat such as low-pressure steam from a power plant, or from renewable sources of energy such as solar energy, or even by geothermal sources can be used to power the HDH system. There are three main components to this technology- the humidifier, the dehumid-ifier, and the brine heater. Seawater is brought to the humidifier where it evaporates, turning into water vapor and combining with dry air to form humid air. This humid
air is brought to the dehumidifier where the humid air hits a heat exchanger and condenses to form fresh water which can be collected to drink.
HDH
system
Packed bed Humidifier~ Brine,li1b ~ Dehumidifiert
Sea water in, lllw,i ,ToFigure 2-1: Schematic diagram of a closed loop HDH system [9]
2.2
Benefits
HDH desalination systems are inexpensive to build and maintain, as will be demon-strated in the construction of the single stage bubble column, which makes it a perfect candidate for small scale, off-grid, decentralized desalination. Unlike RO, there are no specialized membranes that are costly to produce and require frequent replace-ments after a limited number of cycles. In an HDH system it is the packed bed of the humidifier that is quickly fouled by salt particles that deposit on its surface.
HDH also has many manufacturing benefits over MSF as well. MSF works at vary-ing pressures and operates at temperatures above 100°C to flash the fluid. By oper-ating at more modest pressures and temperatures systems, HDH can be constructed at lower costs using plastic materials and simple machining operations. Moreover, MSF has not been applied at a smaller scale (10-100m3jday).
2.3
Demerits
HDH is not widely used because there are barriers to the technology that do not make it commercially viable. However, although there are numerous advancements currently being made. HDH systems suffer from low energy efficiency and high capital cost resulting in a high cost of water production. Through a thermodynamic analysis it is clear that HDH has not reached its thermodynamic limit and that there are many improvements that can be developed to increase the energy efficiencies of HDH systems [5]
The high capital cost can be attributed to the non-condensable carrier gas present in the condensing mixture in the dehumidifier. High concentrations of the gas in-creases the resistance to heat transfer. Poor heat transfer dein-creases the condensation rate and lowers the amount of heat recovery. The effect of diffusion resistance to trans-port of vapor in non-condensable gas-vapor mixtures has been studied by researchers, and they have concluded that there is a quadratic variation of heat transfer with change in mole fraction of non-condensable gas present in the condensing vapor [8]. In a system like ours, with the mixture containing 60-90% air, the heat exchanger in the condenser will have orders of magnitude lower heat transfer coefficients, as low as 1 W /m2K, when compared to pure vapor systems.
Chapter 3
Single Stage Bubble Column
This thesis suggests a unique design using a bubble column as part of the dehumidifier to improve the heat transfer rate. The first section will explain the function of the bubble column along with a thermal network resistance model for this system. The second part of this section will go into detail about the design and construction of the dehumidifier, and experimental setup. The third subsection will explain and model different parameters that will drive the design of our setup. Much of this section has been discussed in a paper titled "Bubble columns for condensation at high concentrations of non-condensable gas: heat transfer model and experiments" [6] written by members of the Center for Clean Water and Clean Energy, and myself. That paper has been submitted to American Institute of Chemical Engineers, AIChE, journal for publication. As such this paper will not go into full detail about the modeling of the parameters selected for this experiment. Lastly, the results will be analyzed alongside the model and a conclusion will be made about different effects on heat transfer rates.
3.1
Overall Concept
Humidification Dehumidification is a form of thermal desalination that is based on simultaneous heat and mass transfer devices. It is similar to MSF in that it is a dis-tillation technology although it uses air as a carrier gas. Some of the main attractions
of this device is that it uses low grade heat to provide the thermal energy needed to power the cycle and can be operated at near ambient pressures. Low grade heat such as low-pressure steam from a power plant, or from renewable sources of energy such as solar energy, or even by geothermal sources can be used to power the HDH system. There are three main components to this technology- the humidifier, the dehumid-ifier, and the brine heater. Seawater is brought to the humidifier where it evaporates, turning into water vapor and combining with dry air to form humid air. This humid air is brought to the dehumidifier where the humid air hits a heat exchanger and condenses to form fresh water which can be collected to drink.
Coolant Coolant in
out
i
1
Condensate out
Vapor/gas mixture out
1f
r
+-f--I
...
+- f--Vapor/gas mixture in Cooling coils Liquid in column Bubbles SpargerAir distribution chamber
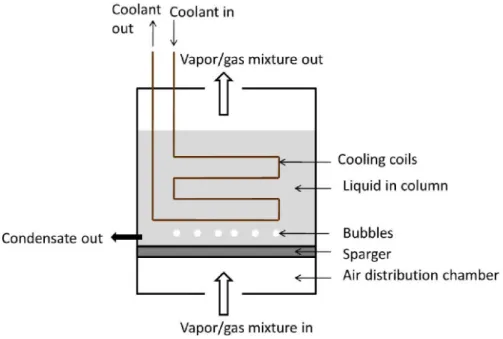
Figure 3-1: Schematic diagram for a single stage bubble columnaiche
By using a bubble column the pool of liquid acts as a medium for the air to transfer heat to the coolant in the coils but also creates turbulence around the condensing coils. It is proposed by Kast that the rising bubbles receive radial momentum and break up the boundary layer surrounding the coil wall [11]. These two effects improve heat transfer rates.
The heat transfer within the column is modeled as a thermal resistance network using bulk temperatures and approximating one-dimensional heat transfer. Shown in the figure below, there are four main temperature nodes- humid air (Tair ) , water
column (Tcolumn), coil wall (Tcoil ), and coolant (Tcoolant). R coil represents the resistance due to the coil wall, which is negligible when using copper coils. Rimpact represents the resistance between the coil surface and the bubbles.
In
a typical dehumidifier Rimpact would be the only thermal resistance betweenT air and T coil and is very large for air-water vapor mixtures. To improve performance Rimpact needs to be improved. Adding a body of water creates another bridge betweenT air andT coil throughRsensible, resistance between bubble and water, and Rbc , resistance between water and coil, and also reduces Rimpact by the two effects described above.RsenSible
Tcoo1am
Figure 3-2: Resistance model for a bubble column heat exchanger [6]
3.2
Design
Several different designs for the system have been developed through the course of this experiment, however only one variation was used to conduct the experiments.
3.2.1
Frame
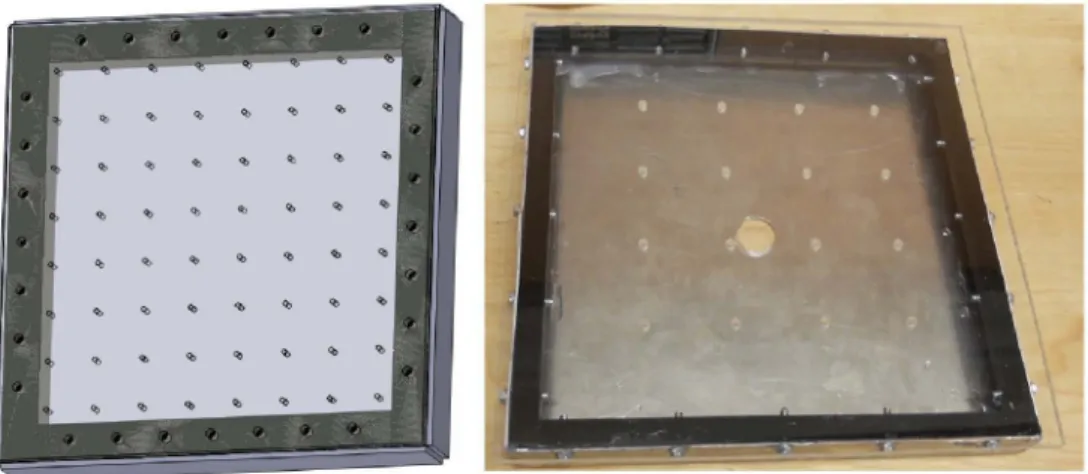
The column of the dehumidifier is constructed from several sheets of transparent CPVC, 3/8" thick. CPVC has a temperature range of O°C to 93°C, outside of our expected operating conditions of 10 °c to 80°C. Four sheets, approximately 12" wide by 18" tall, were used for the sides and two sheets, 12" wide by 12" tall, were used for the bottom and top cover. Aluminum L-brackets, I" by I" by 18", were used on
the corners attached with gasketed binding barrels. A Buna-N gasket seals the top and bottom plates of the column.
Figure 3-3: Left: CAD depiction of tank. Right: Actual fabricated tank.
3.2.2
Sieve Plate Profile
The sieve plate serves two functions- diffuse the incoming air into small bubbles and to prevent the water from flooding the air chamber. The first sparger chosen was a cartridge type from Mott Corporation. It is an in tank precision sparger element made of 316L stainless steel porous media. The media is rolled and has welded ends.
It is I" in length, and 2.5" in diameter. This cylindrical sparger produces fine Imm bubbles with a pressure drop of less than 13.7 kPa.
After initial testing it appeared that the cylindrical sparger could not produce a completely uniform array of bubbles, translating into poor bubble impact on portions of the condensing coil. In addition, modeling the effects of impact on the coil be-comes significantly more difficult when there is uneven impact and when the air is dissipating through a cylindrical vessel. An alternative sparger design was chosen for the dehumidifier although the cylindrical sparger is used in the humidification column
Figure 3-4: Mott Corp. 2240-A16-10-AOO-10-AB Precision Sparger Element with connector fitting.
because the humidification column only needs to produce humid air and will not be modeled. For equal volumes of gas the cylindrical sparger can produce bubbles which have 6.35 times more gas-liquid contact surface area than a sparger with 6.35 mm bubbles which is advantageous for a humidification system.
The chosen design for the new sparger is an aluminum sparger box measuring 10"x10"x1". There is a 3/4"x 3/4" ABS trim in the sparger box to facilitate switching sparger plates. Over the box is an acrylic sheet with a grid of small through holes. There are 5 variations in sieve design that vary in the number of holes, hole diameter, and hole pitch size in order to test the effect of bubble size to heat transfer rates. They are listed in the appendix.
Figure 3-5: Left: Cad model with no.2 sparger plate. Right: Actual fabricated sparger box with no.5 sparger plate.
The features of the sieve plate were generated by a program written by Dr. A. V. Kulkarni, from the Institute of Chemical Technology in Mumbai.
3.2.3
Coil Designs
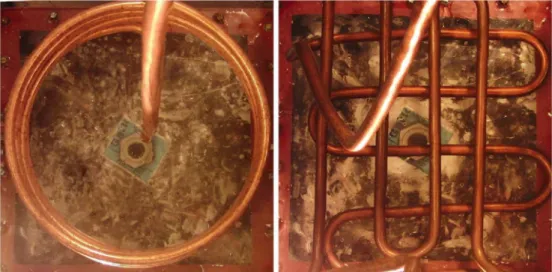
Two different condensing coils were designed to study the effect of impact of bubbles on the coil. Both coils were made from copper tubing, alloy 122, with an outside diameter of 0.375" and an inner diameter of 0.311" and were turned by hand. The circular coil has an overall turn diameter of 9" over the active sparger area of 8" by 8". As seen in the image below, the circulation of the water forces the bubbles to move away from the sides of the wall and through the center of the coil with minimal contact. The second coil, a serpentine design, is designed to pass over the sparger holes therefore deliberately contacting the bubbles.
Figure 3-6: Left: Circular design Right: Serpentine design
3.2.4
Humidifier
The initial design for the humidification column used the same framework as the dehumidifier along with the original cylindrical sparger. Alternatively, an off-the-shelf polypropylene tank, with a smooth seamless construction and a temperature range up to 80°C, was used instead. This tank was capable of sealing better and
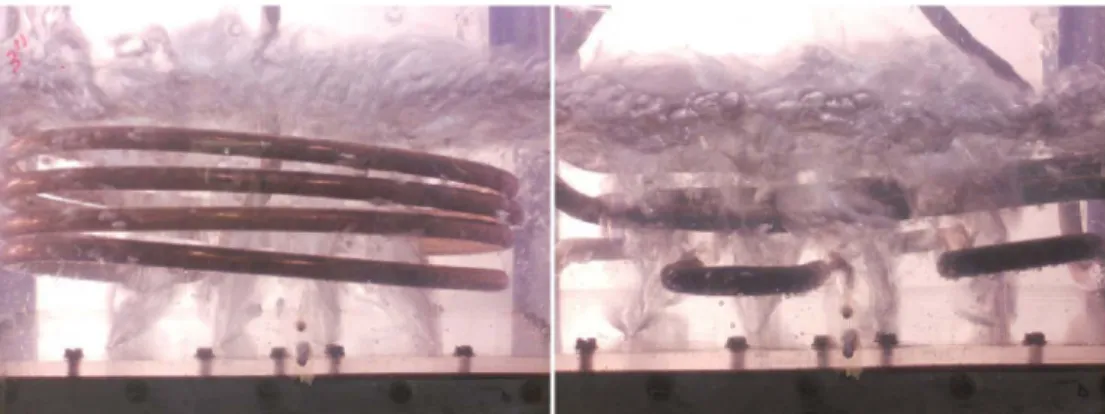
Figure 3-7: Left: Bubbles avoid impacting the coils Right: Bubbles makes several impacts while rising
provided very stable and consistent air flows. A 3/8" polycarbonate lid with a
0-ring seal was constructed to seal the tank and prevent leaking. The tank has an air inlet that suspends the cylindrical sparger vertically to produce bubbles, an air outlet with a mist eliminator screen, a water inlet valve, and a 1.5 kW submersion heater that surrounds the sparger. The body of water in the humidification tank is heated to 70°C, below boiling temperature of water at atmospheric pressure.
Humid Air Outlet Air Inlet
Water Level
Submersion Heater
Figure 3-9: Left: The humidification tank with C-clamps sealing the tank. Right: Inside of tank. Note that the water is not boiling.
3.2.5
Experimental Setup
The system temperatures and flow rates are monitored to allow adjustments in order to achieve thermodynamic balancing. There are numerous k-type thermocouples connected to a data logger with an uncertainty of ±0.1 °C. They are listed in the appendix. There are two rotameters, one to measure liquid flow and one to measure air flow. The air rotameter has a range of 0.8 - 8.2 ft3 Imin (378 - 3870 m3
Is)
with a resolution of 0.2 ft3/min ( 94.4 m3Is).
The water rotameter has a range of 0.01 -0.85 L with a resolution of 0.01 L/min.The following is a schematic of our experimental setup. Water flows in a closed loop system from the water reservoir, through the pump, to the condensing coil, and back. The temperature is regulated by a closed loop chilled water condensing coil and by an electric heater. A bypass valve is included in the design to reduce the duty on the pump. Air is supplied through an external wall source. The system is an open loop as it goes from the humidifier column through the dehumidifier column and into the atmosphere. System efficiency is not important because the study focuses on the characteristics of the dehumidifier.
Through a series of reiterative testing the following initial conditions are used
Air supply 3 9 10 T2
t
T6IIITTl
7 11r - - - - ',1 T8 I 8 PUMp(1, 11, 12) valves, (2, 6, 13) rotameter, (3, 8) sparger, (4) humidifer colLulln, (5) submerged electric heater, (7) pressure gauge, (9) dehumidifer column, (l0) water coil, (14) inline water heater, (15) cooling water tank, (16) chilled water coil, (T 1T8) thermocouples
Figure 3-10: Schematic diagram of test apparatus [6]
24°C, near ambient temperature c) air flow rate is 5.0 sefm,
d)
water flow rate is 0.5 lpm.Dehumidifier
3.3
Analysis
To begin obtaining results the system needs to be in steady state and thermodynam-ically balanced. For this an error term is created and whenever the error falls below a threshold the system will be considered in steady state and thermodynamically bal-anced. It is not possible to balance the system completely due to losses in heat. The analysis begins by drawing a control volume around the dehumidification column and using the First Law of Thermodynamics,
dE . . v2 v2
di
= Q -W
+
'L.m(h
+
2
+
gZ)in -'L.m(h
+
2
+
gZ)out(3.1)
There is no work done on the system, and we assume steady state when taking results. Mass flow and velocities at the inlet and outlet are the same. Potential energy is negligible in this situation. With some rearranging of terms, equation 3.1 reduces to
(3.2)
Specific enthalpy for an incompressible liquid can be written as,
(3.3)
where the difference in Pout and Pin is negligible. For water, the heat transfer rate is,
(3.4)
where,
(3.5)
Finding the flow rate for dry air is not as straightforward as it is for water. The humid air is a fully saturated mixture of H20 and air. The mass flow rate is dependent
on this humidity ratio of kilograms of water vapor per kilogram of dry air. The following image shows how the humidity ratio of air increases with temperature.
Sj .::.:: ... :cD
:.
10.101
o ;:; ftl 0:::b 0.115
":CIIE
:i
10.101
~ J"
I I,
,
.J I f I,
J f,
. / ' ~ ~"'" ~"
~eng inee ri ngto
0Ib
ox.
C0m-I
101
Temperatu re ,(deg Ie)
Figure 3-12: Chart for humidity ratios that vary with temperature [2]
The mass flow rate of air can be written as
. ¥da
mda = 1+X P
where,
(3.6)
(3.7)
data table. The heat transfer rate for dry air is,
(3.8)
The heat loss is given by the equation
Once E is minimized the qflux is calculated as
Qda
qflux
=-A
coil
(3.9)
(3.10)
qflux is calculated using Qda instead ofQw. While Qw would give a more accurate qflux, the uncertainty due to the propagation of error is significantly larger than when using Qda.
3.4
Results
The values for the model predictions are taken from "Bubble columns for condensation at high concentrations of non-condensable gas: heat transfer model and experiments"
[6].
3.4.1
Bubble Diameter
Using different sparger plates, with different hole diameters, different bubble diame-ters were generated. Within the scientific community there has not been a consensus made as to whether bubble diameter affects mass transfer coefficient greatly [8]. Our model and data shows a decreasing relationship between heat flux and bubble diam-eter, although it is small. This is at a fixed superficial velocity of 3.8 cm/s, mole inlet fraction of 21
%,
and a water column height of 254 mm.3
• Current bubble column experiments 2.5 0.5
o
Model predictionf
of
o 3 3.5 4 4.5 5 5.5 6 6.5 7 Bubble diameter [mmlFigure 3-13: Effect of bubble diameter on the total heat flux in the bubble column
3.4.2
Superficial Velocity
The effect of superficial velocity on mass transfer in bubble columns has been stud-ied extensively already. However,these studies do not involve condensation into the liquid column. From literature findings, models, and experimental data, it it can be concluded that heat and mass transfer coefficients increase as superficial velocity in-creases. This is done at a fixed hole diameter of 4 mm, mole inlet fraction of 21
%,
and water column height of 254 mm. The uncertainty of measurement on the superficial velocity is ±O.l1 cm/s and the heat flux is ±5%. From 3 cm/s to 9 cm/s the system is operating in the homogenous bubbly flow regime. The heat flux rapidly increases once the system goes into the heterogeneously bubbly (extremely turbulent) regime, and is seen in the multi-stage system tests.6
• Current bubble column experiments 5 o Model Prediction ~
t
=
'=
3 -;t
<II ..c ";j...
~ 2o
o 2 3 4 5 6 7 8 9 10Superficial velocity, VG[em/s1
Figure 3-14: Effect of superficial velocity on the total heat flux in the bubble column
3.4.3
Liquid Height In Column
In an HDH system a blower is needed to provide a high pressure end to drive the gas through the humidifier and dehumidifier. For a typical dehumidifier the pressure drop through it is minimal. In a bubble column dehumidifier a large portion of the pressure drop is due to the hydrostatic head of the liquid in the column that the humid air needs to overcome. To reduce pump size, and therefore costs, it is beneficial to minimize the liquid height. Reducing the pool volume would also decrease the transient time necessary to heat the pool before reaching steady state. The height would ideally be the height that just fully immerses the coil in the liquid pool, in this case 152.4 mm. It must also be above the integral length of a bubble diameter, a few millimeters, however this is easily achievable. With a superficial velocity of 6.53 cm/s, bubble diameter of 4 mm, and an inlet mole fraction of 21
%
there was no discernible effect of liquid height on heat flux above the minimum necessary.3.4.4
Inlet Mole Fraction of Vapor
It was stated earlier that mole fraction of vapor has nearly a quadratic effect on heat transfer rates, although this effect has not been applied to bubble columns. The inlet mole fraction is varied from 10% to 25% at a fixed superficial velocity of 3.8 cm/s, mole inlet fraction of 21 %, and a water column height of 254 mm. The model and experimental data both show a linear effect rather than quadratic. This is a significant finding showing another benefit of bubble column dehumidifiers.
4.5
4 • Current bubble column experiments
.f'
Model prediction '"e
3.5 --.~
3 0 ~=
!<::: ~ 2.5 ~ .c: -; 2 .... ~ 1.5 0.5o
0.05 0.1 0.15 0.2Inlet mole fraction of vapor [-1
0.25 0.3
Figure 3-15: Effect of inlet mole fraction on the total heat flux in the bubble column
3.4.5
Impact
In
all of the above experiments, bubble-on-coil impact was avoided; including impact into the predictive model would have been very difficult. This section studies the effect of using a serpentine coil. Under standard conditions it is observed that impact significantly increases heat transfer rates. For the serpentine design, a large portion of heat transfer between the humid air bubbles and coil is through the direct impactbetween the two. To obtain higher heat transfer rates the condensing coil should be designed for maximum impact.
9
.to 'iilhoU! hnpa t
<)withjrnpact 7
.
..,... ':'1: ~ 6 :!...
...
.,.
5...
. .....,. c>i .=.!
4 3 2 o 2 3 4 5+
6 7 8Superficial velocity, V~Ie.mfI
Figure 3-16: Effect of impact on the total heat flux in the bubble column
3.4.6
Particles
The use of particles is tested for the effects on heat flux. Particles can have two effects within the bubble columns. Particles circulating in the liquid pool will collide with rising bubbles and break them up into smaller bubbles. Additionally bubbles will impact the particles, transferring heat to the particle, and then the particle will impact the coil, transferring heat to coil. Two categories of particles were used. The first is polypropylene balls and the second is aluminum powder. The properties of the particles are listed below. Polypropylene is less dense than water so the circulation of the water pulls particles into the body to interact with the bubbles. Aluminum is also considered because of its high thermal conductivity. However aluminum is much denser than water so the diameter of the particle must be small enough so that it is fluidized within the streams.
Table 3.1: Different particle properties
Particle Density(g/cm3 ) Diameter (mm) Thermal Conductivity(W/m K)
Water 1 - 0.58
Polypropylene 0.93 3.17 0.22
Aluminum 1.76 0.102 250
Using standard fixed parameters there were no apparent effects from either par-ticles observed. As much as 500 ml, or 3
%
of water volume, of aluminum powder was added to the liquid body without an effect. One unfortunate side effect of using particles is that the condensed water is contaminated by the particle which would re-quire further filtering before drinking. A similar variation was done with a serpentine coil without an effect.3.4.7
Others Variables
A few other variables were examined merely to validate our modeling conditions. It
is assumed that the liquid body has a uniform temperature. The data shows that temperature is uniform radially as well as along the height of the water column. This is due to the constant mixing within the liquid body as the water circulates turbulently.
The above results show a lot of promise for bubble column dehumidifiers. A state of the art dehumidifier from George Fischer LLC [1] had a maximum heat flux of 1.8 kW
1m
2 while the bubble column dehumidifier was able to reach a flux of 8kW1m
2.
The single stage bubble column dehumidifier was not designed for maximum heat flux, but merely to test certain parameters. The multi-stage bubble column has been better optimized and is able to obtain significantly higher heat fluxes.
Chapter 4
Multi Stage
All of the analysis done to this point has been on a single stage bubble column but a multi-stage bubble column is necessary if it is used for any viable desalination system. The first subsection explains why a multistage column is more effective. The second su-section analyzes two different heat exchangers and which one to pursue. The third subsection is a detailed description of the design of the multistage system. The last subsection will show the results of the multistage system with an emphasis on effectiveness rather than heat flux.
4.1
Overall Concept
There are different variations on heat exchangers which can be categorized by flow arrangement and type of construction. The simplest constructions are concentric tube heat exchangers with either parallel or counterflow. In a parallel flow, the hot and cold stream enters from the same end and leave through the same end, flowing in the same direction along its length. Counterflow has fluids entering and leaving different ends and flowing in opposite directions.
In a parallel flow setup the two streams start at a high temperature differential and the differential decreases through the length of the heat exchanger. As seen from equation 3.4 as the temperature differential decreases the heat transfer rates decreases as well. In an ideal, infinite length heat exchanger, the heat transfer rate will decrease
Figure 4-1: Left: Parallel flow Right: Counterflow
to 0 when the hot stream and cold stream reach the same middle temperature. A parallel flow system is simple to build but the heat recovery is poor. A counterflow system is preferred. - HotStream - Cold Stream --- Hot Stream - Cold Stream
Length of Heat Exchanger Length of Heat Exchanger
Figure 4-2: Left: Parallel Heat Exchanger Right: Counterflow Heat Exchanger
In
a counterflow setup the streams oppose each other, allowing more heat transfer between the two streams. There are two parameters that will affect the shape of the curve, heat capacity rate and effectiveness. Heat capacity rate is defined as follows,(4.1) where Ch is the heat capacity rate for the hot stream and
C
c is the heat capacity rate for the cold stream. The heat capacity rate affects the curvature of the streams in the graphs. An exchangeraAZs effectiveness, defined as,or
Q
E
1= . -Qmax (4.2) (4.3)is the ratio of the actual heat transferred to the heat that could be transferred by an exchanger of infinite size.
or !J.H
E
2 = ---.-.--!J.HmaxE
2 -_
(hh,i - hh,o) (hh· - h .),2 C,1,(4.4)
(4.5)
Effectiveness of this system is the greater of the two effectiveness. In the ideal case, with
E=l,
the inlet of the hot streamaAZs temperature is equal to the oulet of the cold streamaAZs temperature. For a desalination system with high recovery, the ideal situation is when the condensing coil outlet temperature is equal to the humid air inlet temperature. This is impossible to achieve due to finite thermal conductivity, and other physical limitations. Although the system can be optimized so that the difference between cold outlet and hot inlet is minimized,shown in figure 4-3 allowing the system to use a smaller thermal heater.4.2
Analysis
There are numerous benefits to having a counterflow heat exchanger, however due to the design of the system it is not possible to have a pure counterflow. In the single stage bubble column, the hot air stream mixes with the liquid pool as the pool circulates around the cool coils. The temperature more closely resembles temperature curve in figure 4-4.
Hot Stream
Coild Stream
Co:ld Stream with iE=l
...
-
...
...........
I \ \ \ \ .....
\...
... ...
"
...
...
length of Heat Excha nger
Figure 4-3: Different counterflow temperature profiles
Hot Stream
Co:ld Stream
Uquid Body
Q) l.... ::::::I +-"ro
l.... - - - . Q)c..
E
~
lengtn of Heat Exchanger
This temperature profile is similar to a parallel flow heat exchanger with poor recovery. The solution is to use a multi-stage bubble column dehumidifier. By using multiple stages the temperature curve begins to resemble a counterflow system with discrete points, allowing more heat to be recovered.
3
rdStage
2
ndStage
1
StStage
HotStream Cold Stream ---~---=-~-~-~------
~~~---Length of Heat Exchanger
Figure 4-5: Multistage parallel flow temperature profiles
Having an infinite number of stages would have a recovery rate of 100%. In just 3 stages it has been the calculated that the efficiency is 92.5%.
4.3
Design
The humidification and dehumidification column has been redesigned to improve sealing, ease of manufacturing, ease of assembling, and interchangeability.
4.3.1
Column
The main body of the column is made of an acrylic cylinder 6.5" wide and 12" tall. Both ends of the cylinder has a 9" by 9" x 2" thick polypropylene cover with all necessary features CNC milled on the blocks, ensuring there are no leaks through the
sides of the column. Each block features a channel for the inlet and outlet of the condensing coil, a drain for collecting condensate, and a bolt circle for mounting the sparger plate. There is a channel with an o-ring on the top and bottom face of each block that the cylindrical body sits in. A drawing of the covers has been included in the appendix. The bottom chamber is used to distribute air and has a cover with just an inlet for humid air and a drain. The top cover only has an outlet for dry air. The system is held together by 17" lengths of 3/8" threaded rods so that a section can be easily dismantled without disturbing other sections and that new sections can be easily added. Swivel pads are attached to the bottom of the threaded rod to act as legs for the system.
- - +
2
ndStage
...
~lstStage
IJ--of-
Air Chamber
Figure 4-6: Left: CAD model w/ 1 stage Right: Fabricated model w/ 2 stages and insulation
Air flows from the bottom end through the column while the coolant travels from the top condensing coil to the bottom. The coils are connected through
Aj<lAi
tubing that runs along the outside of the column.4.3.2
Sparger Plate
The sparger plates are similar to the ones used in a single stage bubble column except that they are circular. Additionally the holes are kept within a 5" circle as to not interfere with the condensing coil fittings. Stages with smaller condensing coils use sparger plates with greater number of holes because their column supports a lower
liquid pool height.
Table 4.1: Circular sparger plates dimensions
# Drill Size(mm) Pitch (mm) Number of holes
1 1,5 13 49
2 1,5 15,5 36
4.3.3
Coils
Taking what was learned from the single stage column the size of the coil could be reduced greatly. Once again the coils are made of copper, alloy 122. The goal was to minimize the height of the coil and to place it as close to the sparger plate without being less than the integral length. Different coil designs were used for different stages, and coil design was reiterated several times. Setup A is a single stage, B is a double stage, and C is a triple stage. The dimensions of the coils for the three setups are listed in the appendix.
In setup C, stage 3 coil has the largest area while the stage 1 coil has the smallest because the first stage must have a minimal amount of heat transferred, otherwise all heat transfer will occur in the first stage and make the system less effective. Also note that stage 2 and stage 3 coils use a spiral design, as seen below. The serpentine design has a large bend radius limited due to the bending tool which limits the the number of bends that can be made in one layer. The spiral design can be made more densely due to its large bend radius.
Figure 4-9: MS coil side profile
It can be seen from fig. 4-9, that the minimum amount of water needed to cover the coil is small, a miniscule 0.65". The condensate collection port in the block was meant to double as a means to fill the chamber with its initial liquid pool. Condensation forms so rapidly that it takes only a matter of minutes before the necessary body of water has formed. With such a small body of water the system reaches steady state very rapidly.
4.3.4
Air Chamber
The air chamber is used to ensure that air is evenly distributed through the column. It is similar to the other chambers although this chamber is empty and is only 6" tall. It was found during testing that the heat loss through the sides condensed the humid air slightly. This effect is minimized by minimizing the size of the air chamber.
4.3.5
Humidifier
The humidifier uses a similar design as the dehumidifier with the polypropylene blocks and acrylic side walls. It serves a simpler function and does not need the plumbing that is required with the dehumidifier. The humidifier is a large 12aAZ tall, 10" wide air chamber with hot brackish water pouring from the top. Inside the column are packed beds that improve contact between the dry air and the heated seawater.
Figure 4-10: MS humidifier showing the spray nozzle and platform
chamber and collect water. A simpler design has been devised but not implemented that uses a cylindrical sparger with large air openings.
4.3.6
Experimental Setup
The same flow meters are used to measure air and water flow. Numerous K-type thermocouples were added to the system to measure air temperature in the bubble column and to measure the inlet/outlet temperatures of the condensing coil. The thermocouples are the same as the one used in the previous experiment. Other thermocouples were placed in the column to measure liquid body temperature, not used in the analysis, but to ensure that the system was operating accordingly. Slightly
different configurations were used for different setups.
Tll
m;l>: ...~ ...~ m)j I T7v
-r---I I I I nL.-I I I I \( T12~
-~ ~ ~
-~ ~ ~
-~
I
1- ---
~
---
~
: BRINE HEATER I I T2 I I , , I n , I I I III 13 Ino
cc:: I wn
LL I C II ~ I T4 I T9 ::J I ::I: I W I C I TS II T8 T6 I I I ~ , I , I I- - _. Seawater Pure water-- Carrlier gas
Figure 4-11: Schematic diagram of MS system and instrumental layout
4.4
Results
Conducting the experiment verified what the model had predicted.
4.4.1
Temperature Profiles
In the one stage humidifier the temperature curves behave very similarly to a parallel flow heat exchanger. As more stages are included into the system the temperature curves begin to resemble a parallel flow heat exchanger.
4.4.2
Effectiveness
The modeled effectiveness for a 3 stage is 92% while the experimental effectiveness was 89.41
%.
The difference is less than 3 percentage points, however there is an ex-planation as to why there is a difference. Firstly, the coil design needs more iterations to achieve the necessary heat transfer.1 0.9 OB
£:
0.7 ~ 0.5 Q;l .~ 0.5 tl 0.4~
0_3 :t:•
%Model • Experimental 0.2 0.1 0 - - ' - - - ' - - - ' - - - ' - - - ' o 1 2 NlJl1lberofStagesFigure 4-12: Effect of number of stages on the total heat flux in the bubble column
Another important reason is that the heat transfer is being limited by the thermal resistance as seen in the resistance model described in fig. 3-2. Poor performance of HDH systems was previously due to the thermal resistance between the condensing coil and the gas vapor mixture. This is no longer the case as the system is currently operating in the heterogeneously bubbly (very turbulent) regime. The largest thermal resistance is now between the coil and coolant fluid. As seen from the figure below, in the multi-stage design the heat flux is significantly higher than in the single-stage design and an order of magnitude higher than state of the art systems.
4.4.3
Column Diameter
By decreasing the column size without varying the air flow, the superficial velocity of the stream increases dramatically. That is seen in the figure below, however,
conditions are not fixed between results so a direct comparison is not appropriate. 30 25 20 15 10 5 • Single Stage
.A.Multi Stage
- St ate oft heArtSyste m
0...l...- 1....-_ _----l. ...L... ...L.- 1....-_ _----l. ...J
o 50 100 150 200 250 300 350
Figure 4-13: Effect of column diameter on heat flux in the bubble column
The coil uses 1/4" copper tubing rather than 3/8" which allows the stream within the coil to operate in the turbulent regime. These two effects account for the large increase in heat flux. In order to increase the heat flux and increase the effectiveness of a 3 stage bubble column the flow within the condensing coil must increase even more and move into a higher turbulent regime. To do this, the diameter of the condensing coil must decrease and then the velocity will increase as a squared function. The Reynolds number for an extremely turbulent stream is 10,000. For the stream to experience a Re=10,000 the tube needs to be 1/16" in diameter. At this size the pressure drop through the tubing will be enormous.
4.5
Cost
With such a large heat flux and high energy recovery rate, this HDH system will be able to produce water cheaply. High heat fluxes allow the system to be very small even at large water production rates. Additionally the design is completely scalable.
Ifmore water production is needed a wider system is easily designed, or several small systems can be placed in parallel. This allows the capital costs for manufacturing to
Figure 4-14: Left: Path of Condensing Fluid Right: Column bubbling
be low compared to other desalination technologies. The main operating cost is the thermal energy, and with high energy recovery rates, the variable costs can be low.
Ifthere is a source of waste heat or renewable energies, like solar, then the variable costs can almost be
o.
Chapter
5
Conclusion
Some countries depend on desalination technologies to provide clean water to its nation and this number will only increase as water becomes scarcer. This need is what drives technological innovation like bubble column HDH desalination. Bubble columns do not create small increases in efficiency but make fundamental leaps in system performance. We saw that
• HDH bubble columns could achieve a heat flux of 20 kW
1m
2 • superficial velocity increases heat flux• inlet mole fraction of vapor increases heat flux linearly
• liguid height of column has no effect on heat flux
• impact of bubbles on column nearly doubles heat flux
• 3 stage bubble column had an effectivness of nearly 90%
HDH desalination has been considered to be a low performance system, however with the modifications suggested in this paper the effectiveness can be above 89%. It is a simple, low maintenance, low cost system and it may not be long before HDH is the leading desalination technology. There are a lot of merits to this system therefore a few members from the CCWCE will be licensing this technology to begin a startup.
Appendix A
CAD Drawings
Throu h-hole for air to hit sorer
Channel for Condensin Coolant
SECTIONB-B
I
i
8
q o10; 10,000
Appendix B
Tables
Table B.1: Dimensions of 5 different configurations for sparger plates
# Drill Size(inch) Pitch (mm) Number of holes
1 1/16 16 121
2 3/32 23 64
3 1/8 26 36
4 5/32 32 25
5 3/16 40 16
Table B.2: Instrument designation chart
# Name
T1 Humidifier Water Column
T2 Dehumidifer Air Inlet
T3 Dehumidifer Air Column Top T4 Dehumidifier Air Outlet
T5 Condensing Coil Water Inlet
T6 Condensing Coil Water Outlet
T7 Dehumidifier Water Column Top
Table B.3: MS condensing coil dimensions
Setup Stage# 0.0. (inch) 1.0. (inch) Length (inch) Type A
1
1/40.19
50
Serpentine B1
1140.19
28 SerpentineB
23/8
0.311
60
Circular C1
1/40.19
16
Serpentine C 2 1140.19
30
Spiral C3
3/8
0.311
30
SpiralReferences
[1] Calorplast heat exchangers. Website. http://www.us . piping. georgefischer. com/go/85FD4C79D60EB5F06E88713117408325/.
[2] Humidity ratio of air. Website.
humidity-ratio-air-d686.html.
http://www.engineeringtoolbox.com/
[3] Coping with water scarcity: Challenge of the twenty-first century. Technical report, Food and Agriculture Organization of the United Nations, 2007.
[4] G. Prakash Narayan et al. Multi-stage bubble column vapor mixture condenser. Assigned to MIT, Patent pending, USSN 13/241,907.
[5] G. Prakash Narayan et al. Thermodynamic analysis of humidifcation dehumid-ification desalination cycles. Desalination and Water Treatment, 16:339-353, 2010.
[6] G. Prakash Narayan Lam Steven et al. Bubble columns for condensation at high concentrations of non-condensable gas: heat transfer model and experiments. American Institute of Chemical Engineers, 2012. in process of being published. [7] Lienhard John H. Innovations in clean water technology: Desalination. Lecture
Video, 2011.
[8] Saha D Maheshwari NK, Vijayan PK. Effects of non-condensable gases on con-densation heat transfer. Proceedings of 4th RCM on the IAEA CRP on Natural Circulation Phenomena, 2007.
[9] G. Prakash Narayan. Status of humidification dehumidification desalination. IDA World Congress, International Desalination Association, September 2011. [10] Castelnuovo Ruben. Multiflash. Website, 01 2010. http://en.wikipedia.org/
wiki/File:Multiflash.svg.
[11] Analyse Kast W. Analyse des wrmebergans in blaensulen. International Journal of Heat and Mass Transfer, page 5:389, 1962.
![Figure 1-1: Water scarcity across the globe [3]](https://thumb-eu.123doks.com/thumbv2/123doknet/14732632.573378/18.921.180.743.547.913/figure-water-scarcity-across-the-globe.webp)
![Figure 1-2: Schematic diagram for a multi stage flash desalination system [10]](https://thumb-eu.123doks.com/thumbv2/123doknet/14732632.573378/20.921.187.718.113.321/figure-schematic-diagram-multi-stage-flash-desalination.webp)

![Figure 2-1: Schematic diagram of a closed loop HDH system [9]](https://thumb-eu.123doks.com/thumbv2/123doknet/14732632.573378/24.921.198.709.188.587/figure-schematic-diagram-closed-loop-hdh.webp)
![Figure 3-2: Resistance model for a bubble column heat exchanger [6]](https://thumb-eu.123doks.com/thumbv2/123doknet/14732632.573378/29.921.207.730.412.620/figure-resistance-model-bubble-column-heat-exchanger.webp)