HAL Id: insu-01576676
https://hal-insu.archives-ouvertes.fr/insu-01576676
Submitted on 4 Jan 2021
HAL is a multi-disciplinary open access
archive for the deposit and dissemination of
sci-entific research documents, whether they are
pub-lished or not. The documents may come from
teaching and research institutions in France or
abroad, or from public or private research centers.
L’archive ouverte pluridisciplinaire HAL, est
destinée au dépôt et à la diffusion de documents
scientifiques de niveau recherche, publiés ou non,
émanant des établissements d’enseignement et de
recherche français ou étrangers, des laboratoires
publics ou privés.
Measuring the expansion velocity of the outflows of LS I
+61 303 through low-frequency radio observations
B. Marcote, M. Ribó, J.M. Paredes, C. H. Ishwara-Chandra, John D.
Swinbank, J. W. Broderick, S. Markoff, Robert Fender, R. A. M. J. Wijers, G.
G. Pooley, et al.
To cite this version:
B. Marcote, M. Ribó, J.M. Paredes, C. H. Ishwara-Chandra, John D. Swinbank, et al.. Measuring
the expansion velocity of the outflows of LS I +61 303 through low-frequency radio observations.
6th International Meeting on High Energy Gamma-Ray Astronomy, Jul 2016, Heidelberg, Germany.
pp.UNSP 040018, �10.1063/1.4968922�. �insu-01576676�
Measuring the Expansion Velocity of the Outflows of
LS I
+61 303 Through Low-Frequency Radio Observations
B. Marcote
1,a), M. Rib´o
2, J. M. Paredes
2, C. H. Ishwara-Chandra
3, J. D. Swinbank
4,
J. W. Broderick
5,6, S. Markoff
7, R. Fender
5, R. A. M. J. Wijers
7, G. G. Pooley
8,
A. J. Stewart
5, M. E. Bell
9,10, R. P. Breton
11,6, D. Carbone
7, S. Corbel
12,13,
J. Eisl¨offel
14, H. Falcke
15,16, J.-M. Grießmeier
17,13, M. Kuniyoshi
18, M. Pietka
19,
A. Rowlinson
9, M. Serylak
20,21,13, A. J. van der Horst
22, J. van Leeuwen
16,7,
M. W. Wise
16,7and P. Zarka
23,131Joint Institute for VLBI ERIC, Dwingeloo, The Netherlands
2Departament d’Astronomia i Meteorologia, Institut de Ci`encies del Cosmos (ICCUB), Universitat de Barcelona (IEEC-UB), Spain
3National Centre for Radio Astrophysics, TIFR, Pune, India 4Department of Astrophysical Sciences, Princeton University, USA
5Astrophysics, Department of Physics, University of Oxford, UK
6Department of Physics and Astronomy, University of Southampton, Highfield, Southampton, UK 7Anton Pannekoek Institute for Astronomy, University of Amsterdam, Amsterdam, The Netherlands 8Mullard Radio Astronomy Observatory, Cavendish Laboratory, The University of Cambridge, UK
9CSIRO Astronomy and Space Science, Australia
10ARC Centre of Excellence for All-sky Astrophysics (CAASTRO), The University of Sydney, Australia 11Jodrell Bank Centre for Astrophysics, School of Physics and Astronomy, The University of Manchester, UK
12Laboratoire AIM (CEA/IRFU - CNRS/INSU - Universit´e Paris Diderot), CEA DSM/IRFU/SAp, France 13Station de Radioastronomie de Nan¸cay, Observatoire de Paris, PSL Research University, CNRS, Univ. Orl´eans,
OSUC, Nan¸cay, France
14Th¨uringer Landessternwarte, Tautenburg, Germany
15Department of Astrophysics/IMAPP, Radboud University Nijmegen, The Netherlands 16ASTRON, the Netherlands Institute for Radio Astronomy, Dwingeloo, The Netherlands
17LPC2E - Universit´e d’Orl´eans/ CNRS, Orl´eans, France
18NAOJ Chile Observatory, National Astronomical Observatory of Japan, 2-21-1 Osawa, Mitaka, Tokyo, Japan 19Oxford Astrophysics, Denys Wilkinson Building, Oxford, UK
20Department of Physics& Astronomy, University of the Western Cape, South Africa 21SKA South Africa, 3rd Floor, The Park, Park Road, Pinelands, South Africa 22Department of Physics, The George Washington University, Washington, USA 23LESIA, Observatoire de Paris, CNRS, UPMC, Universit´e Paris-Diderot, Meudon, France
a)Corresponding author: marcote@jive.eu
Abstract.LS I +61 303 is a gamma-ray binary that exhibits an outburst at GHz frequencies each orbital cycle of 26.5 d and a superorbital modulation with a period of 4.6 yr. We have performed a detailed study of the low-frequency radio emission of LS I +61 303 by analyzing data from the Giant Metrewave Radio Telescope (GMRT) at 150, 235 and 610 MHz, and from the Low Frequency Array (LOFAR) at 150 MHz. We have detected the source for the first time at 150 MHz, which is also the first detection of a gamma-ray binary at such a low frequency. We have obtained the light-curves of the source at 150, 235 and 610 MHz, all of them showing orbital modulation. The light-curves at 235 and 610 MHz also show the existence of superorbital variability. A comparison with contemporaneous 15-GHz data shows remarkable differences with these light-curves. At 15 GHz we see clear outbursts, whereas at low frequencies we see variability with wide maxima. The light-curve at 235 MHz seems to be anticorrelated
with the one at 610 MHz, implying a shift of about 0.5 orbital phases in the maxima. We model the shifts between the maxima at different frequencies as due to changes in the physical parameters of the emitting region assuming either free-free absorption or synchrotron self-absorption, obtaining expansion velocities for this region close to the stellar wind velocity with both mechanisms.
INTRODUCTION
Gamma-ray binaries are binary systems composed of a young massive star and a compact object. These systems exhibit non-thermal emission from radio to TeV gamma-rays, with their spectral energy distribution clearly dominated by the MeV-GeV photons. Up to now only five systems have been discovered: PSR B1259−63, LS 5039, LS I 61 303, HESS J0634+057, and 1FGL J1018.6−5856. A detailed review of all these systems can be found in [1].
LS I 61 303 is composed of a young B0 Ve star and a compact object orbiting it every 26.4960 d [2] in an orbit with an eccentricity of ∼0.72 [3]. The system exhibits a 1–10 GHz radio light-curve orbitally modulated. The source exhibits a clear outburst per orbital cycle [4, 5, 6]. A modulation with a period of 1667 d is also observed at all wavelengths, the so-called superorbital modulation [2]. This modulation affects the amplitude of the non-thermal outbursts and the orbital phases at which the peak emission takes place.
OBSERVATIONS
To perform a detailed study on the variability of LS I +61 303 below 1 GHz we have analyzed all the archival obser-vations from the Giant Metrewave Radio Telescope (GMRT) at 150, 235 and 610 MHz. The last two frequencies were recorded simultaneously during the same observations. Most of these observations were taken during a monitoring of the source performed during three consecutive orbital cycles in 2005–2006. We have also conducted and analyzed observations at 150 MHz with the Low Frequency Array (LOFAR) in 2013. All these data have been compared with contemporaneous observations at 15 GHz with the Ryle Telescope and the Owens Valley Radio Observatory 40-m telescope (OVRO), which show the known behavior of LS I +61 303.
Whereas the GMRT and RT observations were taken at a superorbital phase of ∼0.2, the LOFAR and OVRO observations were taken at a superorbital phase of ∼0.8–0.0. The behavior of the source at these two different superor-bital phases is expected to be completely different. A comparison between the three low frequencies is thus impossible and both datasets will be discussed separately in the following.
RESULTS
Light-curves at 235 and 610 MHz
The monitoring performed by the GMRT at 235 and 610 MHz in 2005–2006 allowed us to determine the behavior of LS I +61 303 during three consecutive orbital cycles. Despite each cycle is poorly sampled, a folding of the data with the orbital phase show the light-curves of the source at the two mentioned frequencies, see Figure 1. The 610-MHz light-curve shows a quasi-sinusoidal emission, with the maximum taking place at a orbital phase between 0.8 and 1.1. Whereas the increase of the emission starts at similar orbital phases than the one at 15-GHz, the maximum is much more wider and the decay takes place around 0.3 orbital phases after the one at 15 GHz.
The spectral indexes are basically modulated by the 610-MHz emission (see Figure 1, as the source exhibits a smaller variability at 235 MHz.
Light-curve at 150 MHz
At 150 MHz only six observations have been conducted at the moment. However, the presence of variability in the emission of LS I +61 303 at this frequency has already pointed out (Figure 2. We observe a flux density modulation with the maximum emission taking place at orbital phases around 1.0. A comparison of these data with contempora-neous OVRO data at 15 GHz shows that the peak of the emission is delayed ∼0.5 orbital phases.
FIGURE 1.Top: Folded light-curve of LS I +61 303 with the orbital period at 235, 610 MHz (GMRT data), and 15 GHz (RT data). Whereas the source exhibits a quasi-sinusoidal modulation at 610 MHz with the maximum located at orbital phases between 0.8 and 1.1, we observe a delay of about 0.5 orbital phases in the light-curve at 235 MHz. The variability is clearly different form the one observed at 15 GHz. Bottom: Spectral index derived from the 235 and 610 MHz data.
0.0 0.5 1.0 1.5 2.0 φorb(Porb=26.4960 d, JD0=2 443 366.775) 0 20 40 60 80 100 120 140 160 Sν /mJy LOFAR 150 MHz GMRT 150 MHz OVRO 15 GHz
FIGURE 2.Folded light-curve of LS I +61 303 with the orbital period at 150 MHz (LOFAR and GMRT data) compared with contemporaneous 15-GHz OVRO data. We observe a similar behavior, although a delay of about 0.5 orbital phases could be supported from these data.
DISCUSSION
We have obtained for the first time the light-curves of LS I +61 303 at frequencies below 1 GHz. These light-curves show significant differences with respect to the known behavior of the source in the frequency range of 1–15 GHz (see e.g. [6]). Additionally, the observed flux densities support the presence of a turnover between 235 and 1 GHz (the
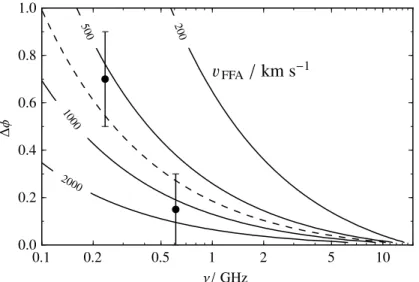
FIGURE 3.Expected shift in orbital phase for the peak emission of LS I +61 303 at a frequency ν with respect to 15 GHz for different expansion velocities, vFFA. In this model we have assumed a region dominated by free-free absorption (FFA). The black
circles represent the shifts derived from Figure 1.
emission at larger frequencies is known to be consistent with a power-law [6]).
The most plausible scenario at this point is that the absorption mechanisms responsible for the turnover could also be responsible for the observed differences in the light-curves. The available data do not allow us to infer the dominant absorption mechanism at frequencies below 1 GHz. However, in this kind of systems we expect that either free-free absorption (FFA) or synchrotron self-absorption (SSA) dominates at around the turnover frequency (see e.g. [7]. In the following we model the radio emitting region of LS I +61 303 assuming a region dominated by free-free absorption or by synchrotron self-absorption. With these models and the available data we infer the properties of this region.
In both cases we have assumed a one-zone model with an homogeneous synchrotron-emitting region. A detailed explanation of the considered models can be seen in [8]. We assume that the peak emission corresponds to a change in the opacity of the emitting region, becoming optically thick at a particular frequency. Given that the transition between an optically thin to an optically thick region would take place at different moments for different frequencies, this assumption can easily explain why the peak emission takes place at different orbital phases. The delay between the different frequencies can thus constrain the expansion velocity of this region.
A FFA dominated region would require an expansion velocity of ∼ 700 km s−1 (see Figure 3) to explain the observed delays at 235 and 610 MHz for an assumed mass-loss rate of 5 × 10⁻⁸M
yr−1[9].
In the case of a SSA dominated region, an additional dependency of the magnetic field, B with the angular size of the region, ` is required. In this case we can assume a decay inversely proportional to the size (as in a conical or toroidal expansion) or to the square of the size (as expected in a spherical expansion). Figure 4 shows the effect of different expansion velocities for both cases. An expansion velocity of ∼ 1 000 km s−1 and of ∼ 17 000 km s−1 is derived from this model for a dependency of B ∼ `−2or B ∼ `−1, respectively.
CONCLUSIONS
We have studied for the first time the emission of LS I +61 303 at frequencies below 1 GHz. The presence of a turnover at frequencies between 235 MHz and 1 GHz is inferred from these observations. Moreover, we have detected variability at 150, 235, and 610 MHz, seen significant differences with respect to the light-curves observed at 1– 15 GHz. These differences can be explained by the presence of transition to an optically thick region. Whereas the dominant absorption mechanism remains unclear, we have modelled this emitting region with the two most plausible scenarios: a region dominated by free-free absorption and by synchrotron self-absorption.
FIGURE 4.Expected shift in orbital phase for the peak emission of LS I +61 303 at a frequency ν with respect to 15 GHz for different expansion velocities, vSSA. In this model we have assumed a region dominated by synchrotron self-absorption (SSA) and
two possible dependencies of the magnetic field, B, with respect to the size of the region, `. The black circles represent the shifts derived from Figure 1.
In both cases we have derived expansion velocities for the emitting region which are clearly sub-relativistic. Additionally, in some cases these velocities are close to the stellar wind velocity (∼ 1 000 km s−1). This fact would give further support to the scenario of a young non-accreting pulsar with a collision between the stellar wind and the relativistic pulsar wind. A micro quasar scenario would provide much higher expansion velocities, due to the presence of a relativistic jet.
ACKNOWLEDGMENTS
We thank the staff of the GMRT and LOFAR who made these observations possible. GMRT is run by the National Centre for Radio Astrophysics of the Tata Institute of Fundamental Research. LOFAR, the Low Frequency Array designed and constructed by ASTRON, has facilities in several countries, that are owned by various parties (each with their own funding sources), and that are collectively operated by the International LOFAR Telescope (ILT) foundation under a joint scientific policy. The Ryle Telescope is operated by the University of Cambridge and supported by STFC. This research has made use of data from the OVRO 40-m monitoring program which is supported in part by NASA grants NNX08AW31G and NNX11A043G, and NSF grants AST-0808050 and AST-1109911. We thank T. Hovatta for providing the OVRO 40-m dish data. B.M., M.R. and J.M.P. acknowledge support by the Spanish Ministerio de Econom´ıa y Competitividad (MINECO) under grants AYA2013-47447-C3-1-P,
FPA2013-48381-C6-6-P, MDM-2014-0369 of ICCUB (Unidad de Excelencia ‘Mar´ıa de Maeztu’), and the Catalan DEC grant 2014 SGR 86. B.M. acknowledges financial support from MINECO under grant BES-2011-049886. J.M.P. acknowledges financial support from ICREA Academia. J.W.B. acknowledges support from European Research Council Advanced Grant 267697 ‘4 Pi Sky: Extreme Astrophysics with Revolutionary Radio Telescopes’. R.P.B. has received funding from the European Union Seventh Framework Programme under grant agreement PIIF-GA-2012-332393. S.C. acknowledges financial support from the UnivEarthS Labex program of Sorbonne Paris Cit´e (ANR-10-LABX-0023 and ANR-11-IDEX-0005-02). The financial assistance of the South African SKA Project (SKA SA) towards this research is hereby acknowledged. Opinions expressed and conclusions arrived at are those of the authors and are not necessarily to be attributed to the SKA SA.
REFERENCES
[1] G. Dubus, A&AR 21, p. 64 (2013). [2] P. C. Gregory,ApJ575, p. 427 (2002).
[3] J. Casares, I. Ribas, J. M. Paredes, J. Mart´ı, and C. Allende Prieto,MNRAS360, p. 1105 (2005). [4] J. M. Paredes, R. Estalella, and A. Rius, A&A 232, p. 377 (1990).
[5] P. S. Ray, R. S. Foster, E. B. Waltman, M. Tavani, and F. D. Ghigo,ApJ491, p. 381 (1997).
[6] M. S. Strickman, M. Tavani, M. J. Coe, I. A. Steele, J. Fabregat, J. Marti, J. M. Paredes, and P. S. Ray,ApJ
497, p. 419 (1998).
[7] B. Marcote, M. Rib´o, J. M. Paredes, and C. H. Ishwara-Chandra,MNRAS451, p. 4578 (2015).
[8] B. Marcote, M. Rib´o, J. M. Paredes, C. H. Ishwara-Chandra, J. D. Swinbank, J. W. Broderick, S. Markoff, R. Fender, R. A. M. J. Wijers, G. G. Pooley, A. J. Stewart, M. Bell, R. P. Breton, D. Carbone, S. Corbel, J. Eisl¨offel, H. Falcke, J.-M. Grießmeier, M. Kuniyoshi, M. Pietka, A. Rowlinson, M. Serylak, A. J. van der Horst, J. van Leeuwen, M. W. Wise, and P. Zarka,MNRAS456, p. 1791 (2016).