THROUGH EXCLUSION OF THE LARGEST CLAIMS
MARCEL DERRON Zurich
It is often found even today in Europe that for certain statistical investigations the conclusion is drawn that the extent of the avail-able statistical data is not sufficient. Going to the root of this pretention, however, we notice that there is a want of clear con-ception about the extent that is in fact necessary in order that a valid conclusion may with greater probability be arrived at. This, for instance, is the case when obvious tariff reductions are shirked from by entrenching oneself behind the law of large num-bers, which by its very nature can in actual practice be never accomplished in its inherent sense.
Apart from a proper understanding of the limits within which a set of statistical data may subject to certain assumptions be as-cribed full measure of credence, there is further a lack of the neces-sary tools that would permit, on the basis of ascertainable values alone, far-reaching conclusions to be drawn or a maximum of useful information to be gathered from an investigation of which the scope is evidently not sufficient.
Credibility Theory, of which Prof. Mowbray [4] *) may be re-garded as the initiator, was evolved in the U.S.A. about 50 years ago to fill this lacunae. The development of Credibility Theory may be considered as one of the most significant contributions of American actuarial science, and it is frankly astonishing that apart from certain specific realisations in the collective risk theory which are fairly closely related to Credibility Theory, it is only in recent years that this interesting topic has met with the required attention in Europe.
Accordingly, whereas to the American actuary the application of the Credibility Theory is a matter of routine, for his European colleague it is an entry in a new actuarial field, which—looking
l
at the work published recently, above all in Italy and Switzerland— he is apparently willing to tread on. It will come to him as a little surprise, however, that although fortunately a large number of papers on the Credibility Theory, chiefly by members of the Casualty Actuarial Society, has already been compiled—as can be seen from the Introduction to Credibility Theory by L. H. Longley-Cook, past Chairman of the Casualty Actuarial Society [3]—the scientific research in this field has fallen behind the manifold possibilities of practical application.
Thus, most investigations are based on the simplified assumption that the amount of each individual claim will always be the same, which implies that in computing credibility tables merely the claim frequency is taken into account. The variation in the amounts of individual claims is disregarded although it is generally admitted that by this omission the standards for full credibility are set too low.
The paper submitted here will therefore be of limited interest to the practitioner, since it seeks to study the question how credibility betterment may be achieved through appropriate exclusions of large claims, that is to say, how by suitable reinsurance the credence of a certain statistical body of experience may be improved for rating purposes, giving full credibility already to a limited statistical material.
This paper was suggested and encouraged by the present chairman of ASTIN, Dr. Ammeter. In particular, he has kindly granted permission to the author to make use of the numerical data from his previous study.
1. CRITERION FOR FULL CREDIBILITY
Normally the starting point is a simplified model which fulfills the following three stipulations:
1. The probability of a claim during a specified period of time is the same for all risks under observation;
2. The probability of a claim is proportional to time;
3. The amount of any claim is 1, the standard for all claims. Consequently, only the distribution of the claim frequency and not the distribution of the total claim is considered.
Denoting by
q the claim frequency
n the number of risks with claim frequency q r the number of claims
i/s the time interval
the probability that the total number of claims will be exactly r for ns trials, where s should be sufficiently large so that none of the n risks appears more than once as claim in the time interval i/s, is given by the (r + i)th term of the binomial expansion of [(1 — q/s) + q/s]ns, where q/s signifies the occurrence of a claim in the time interval i/s.
This (r -\- i)th term can be represented by
nsCr (I ~ qjs)™~r qjs? (i)
where nsCr stands for the corresponding binomial coefficient.
The probability P that the number of claims in ns trials lies within i 100 k% of the expected value nq (= mean) is therefore equal to the expression
P = S "lsCr (I — qls)ns-r q/sr (2)
where nq is finite and s tends to infinity.
Perryman [5] has shown with the help of Stirling's approximation that this expression can be reduced to:
2
P - -,=
J/2TC nq
J
e
~£i
dx(3)
so long as s is very large and k is not large. If the new variable t = %l\/nq is introduced, one obtains the standard for full credibility
/5 J
This formula is based on the assumption of a Poisson distribution. Recent studies have shown, however, that this assumption only applies conditionally, particularly in the case of motor insurance,
where it is impossible to obtain completely homogeneous groups by classifying the insurance portfolio into risk categories.
For its part the factor nq = t in the Poisson distribution
~7F
^
represents a stochastic variable, which implies that a compound Poisson process instead of a simple one should be used.
This thought is not carried any further, since the basic considera-tions will remain the same as for a simpler model. It would only render the formula structure a little more complicated.
This criterion for full credibility is based on the assumption that the distribution of the claim amounts is disregarded. That this assumption is valid only to a very limited extent is gener-ally recognised. There is, however, some hesitation in rendering the formula structure more complicated after this simple procedure has stood the test in practice. Also, it has been stated with some justification that, in general, the requirements for full credibility are rather stringent, the usual assumptions being P > 0,9 and k < 0, 1, so that the disregard of the distribution of claim amounts could to a certain extent be compensated for.
The frequency function f(x, t) of the total loss results from the convolution of two stochastic quantities, the claim frequency and the distribution of claim amounts. If the claim frequency is assumed to be a Poisson process with the limitations already mentioned, we may write
W~
s
*
<r) {x) (6)
For the distribution of the amounts of claim a log-normal distribu-tion would be especially suitable in non-life insurance, but this would lead to such great obstacles for a numerical computation that this distribution is hardly applied for practical applications.
2. THE DISTRIBUTION OF THE TOTAL LOSS UNDER EXCLUSION OF THE LARGEST CLAIMS
This question has been treated by Ammeter in two of his papers [1, 2] as well as during his various lectures in the U.S.A. in the
Autumn of 196/). For the frequency function of the total loss in a specific insurance portfolio formula (6) applies. If the largest claim be excluded, according to Ammeter, this leads to
f(x,t,-i) = I
o
where the expression
e—* tr *(r—1
(7)
is the (r — i)th convolution of the truncated distribution of the claim amounts sm(x). It is to be noticed that the distribution of
claim amounts is first truncated and then convoluted.
If the n largest claims are excluded, the frequency function is given by
/(*, t, n =
J
2J
~7F
ns(m) [i*(r—n) ]n~1\sm(x)] dm
(8)
As distribution for the claim amounts Ammeter has considered a Pareto distribution. Under this assumption the mean [zi<~M) is
(XI(—n) — / / a - 1 I 1 ^ 1 Ia — 1 — a — 1 I "p\ / a—2\ a — 2 a — 2 (n — 1)!-1- \ a — 1/ a — I -i_ TT\ / a — 2 \
— r -
1I
a — 2 x \a — 1/a — 2 a — 1 a — 2 a — 2 a — 2 -1- \oc — 1/As an example, for n = 2, this leads to
(9) [XI < a — 2 a— 2 \ — T ^ / a — 2 \ a — 2 _ | « -a — 1 / -1- \<x — 1 / a — I (10)
This result is very illustrative. The first expression represents the mean of the total loss without exclusions; the second expression represents the decrease of the mean through exclusion of the largest claim; the third one corresponds to the mean of the second largest claim. It is clear that with increasing n the correction amounts will decrease, which—as can be readily seen—is also the case here. The formula can be simplified if the asymptotical relation
r (n + c)
—frr~r— ~ «
c(n)
is applied for large n. We can then write
a — I -J_ a — 2 ^ a — 2 a — I
a — 1 / -J—i a"2
t 1 1 — t"-1 n*'1) (12
It can be readily seen that for yu(—re> to exist, t must be greater than n. Moreover, as pointed out by Ammeter, the increase in the range of existence of a Pareto distribution through exclusion of the largest claim can, for large claims, be easily estimated by means of this formula.
The standard deviation cannot be represented in such a simple manner. For further study reference should be made to [i].
3. CREDIBILITY BETTERMENT THROUGH EXCLUSION OF THE LARGEST CLAIM
With increasing number of claims t, the distribution of the . total claim amount converges towards a normal distribution. Although, because of the large claims that will occur for an in-creasing number of claims, a large variation of claim amounts has to be reckoned with, and the skewness of the distribution is naturally not o, it seems permissible to assume the total loss as normally distributed for large values of t. Such a procedure requires, however, that one should be conscious of the inaccuracy inherent in such an
assumption, especially as the tail of the distribution cannot be rightly apprehended. The figures resulting from such a procedure, therefore, would probably turn out to be too small. This circum-stance does not weigh heavily as regards the topic examined here, since we are concerned only with the betterment of credibility through exclusion of the largest claims and are not trying to estab-lish a new criterion of credibility.
For a normal frequency distribution with mean JJ. and standard deviation a, the probability P that an observation differs from the mean y. by less than a = k]x is given by
p
=^wJ
e
-*°°
dx
^
Putting x = a t j/2 and integrating from o to + a, we get
The upper limit of the integral can thus be considered as a function of P, so that we can put
or
Using a table of the normal distribution it is easy to calculate the function/(P), e.g.
for P = 0,95 ^f(P) = 1,3859. If we now put k = 0,025, then
In case, therefore, G)\L = 0,01276, it can be assumed with 95 % probability that the deviation of an observation from the mean value amounts to less than 2,5 %.
In case of p observations instead of one, the mean and the stan-a
dard deviation for a normal distribution are [x and ap = —r=
respec-yp
tively. Our problem can therefore be formulated as follows: How large should p be in order that with probability P no deviations greater than k\x will occur.
We have
and therefore
2 a2
The quantity p represents the standard for full credibility and can be determined as soon as a and jz are known.
A similar deduction was suggested by Perryman [5] who, however, based it on the assumption that the mean values of the claim frequencies are distributed normally. In order to account for the distribution of the claim amounts the factor 1 +—- was in-troduced by Perryman, where s signifies the standard deviation and m the mean of the distribution of the claim amounts.
The quantity p indicates the credence that should be attached to a certain body of experience. When P and k are fixed, p is
propor-C72
tionate to —. The credibility of a certain statistical body in comparison with another one may therefore be measured by com-paring the quotient between the square of the standard deviation and the square of the mean. Thus we may denote the standard for full credibility, when no claims are excluded, by p, whereas by p(—i) the standard for full credibility, when the largest claim is excluded, is defined.
We have
which means that, for the same variables P and k, the relation
(17)
holds true.
Instead of determining, however, the quantities ^ and />(~~1), we will tackle the problem from a different angle by starting from an assumed number of claims t. For a certain number of expected claims t, p will represent the credibility that may be attached to that particular body of experience. The credibility p(~x> for the same number of expected claims t will obviously not be the same.
Thus on the basis of equation (17), the credibility betterment through exclusion of the largest claim can be determined by studying the quotient pt—1) / p.
Resorting to the figures which Ammeter has kindly permitted to make use of and which have been taken from his paper [1] men-tioned already, we have the following comparison for the expected number of claims t = 100. a 3-25 3-5° 3-75 4.00 180.00 166.67 i57-!4 150.00 TABLE I a 30.00 22.36 I9-I5 17-32 t = 100 167.61 157-27 149.61 I43-7I 20.92 18.77 17.22 16.19 pl-»/p in % 56.0 79.0 89.2 95-2
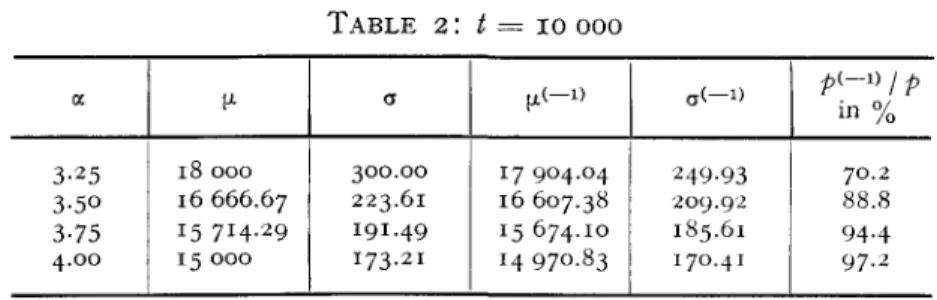
The result seems to be plausible even though the dependency of the credibility betterment on the parameter value of a is fairly high. It is, however, pretty clear that this is partly conditioned by the relatively small number of claims t. On account of this the truncated moments and the consequent ratios p(~^ / p as regards credibility betterment were calculated also for t = 10 000. The result can be gathered from the following table.
TABLE 2: t = 10 000 a 3-25 3-5O 3-75 4.00 M-18 000 16 666.67 15714.29 15 000 a 300.00 223.61 191.49 173.21 17 904.04 16 607.38 15 674.10 14 970.83 249-93 209.92 185.61 170.41 in % 70.2 88.8 94-4 97.2
The result is satisfactory and even more plausible than those of table 1. By increasing the expected number of claims, the exclusion of the largest claim does not have so large an influence as in table 1. For increasing values of <x, the claim variation is smaller, so that the largest claim coverage has lesser effect on the credibility. As an example we may see that for a = 3.5 only 88.8 % of claims are needed to give full credibility when the largest claim is excluded as compared with a portfolio, where no claim is excluded at all. The betterment is therefore significant and shows that the influence of a carefully selected reinsurance policy is of great importance for stabilizing the losses incurred.
The exclusion only of the largest claim represents merely a special case. Scarcely, in practice, only the largest claim would be covered. Nevertheless, it is obvious that a normally reinsured portfolio will attain significant betterment in credibility by exclu-sion of the largest claims.
LIST OF REFERENCES
[1] AMMETER Hans, Note Concerning the Distribution Function of the Total Loss Excluding the Largest Individual Claims, Astin Bulletin, Vol. I l l , Part II, 1964.
[2] AMMETER Hans, The Rating of "Largest Claim" Reinsurance Covers, Quarterly Letter, Jubilee Number, Vol. II, 1964.
[3] LONGLEY-COOK L. H., An Introduction to Credibility Theory, Casualty Actuarial Society, 1962.
[4] MOWBRAY A. H., How Extensive a Payroll Exposure is Necessary to Give a Dependable Pure Premium ? Casualty Actuarial Society, 1914. [5] PERRYMAN Francis S., Some Notes on Credibility, Casualty Actuarial