An Analysis of the Health Care Industry Dynamics
By Osamu Uehara
Bachelor of Art in Policy Management, 1999 Keio University
Submitted to the Department of Civil and Environmental Engineering in Partial Fulfillment of the Requirements for the Degree of
MASTER OF ENGINEERING IN CIVIL AND ENVIRONMENTAL ENGINEERING AT THE
MASSACHUSETTS INSTITUTE OF TECHNOLOGY JUNE 2002
02002 Osamu Uehara. All rights Reserved
The author hereby grants to MIT permission to reproduce and to distribute publicly paper and electronic copies of this thesis document in whole or in part.
Signature of Author.
Osamu Uehara Department of Civil and Environmental Engineering May 23, 2002
Certified By
John R. Williams Y/Associate Professor, Civil and Environmental Engineering Thesis Supervisor
Certified By
Certifed BvOral
Buyukozturk MASSACHUSETTS INSTITUTE Chairman, Departmental Committee on Graduate Studies
An Analysis of the Health Care Industry Dynamics
By Osamu Uehara
Submitted to the Department of Civil and Environmental Engineering on May 23, 2002 in Partial Fulfillment of the Requirements for the Degree of Master of Engineering in Civil and Environmental Engineering
Abstract
The introduction of information technologies to health care organizations is believed to improve the delivery of health care process and bring a great deal of benefit to the society. However, due to the lack of understanding in the nature of such organizations, many system providers have failed to implement their technologies to their fullest potential.
The goal of this thesis is to present an analysis of health care industry and provide useful insights that help system vendors understand the complexity of the environment. The methodology chosen is system dynamics. A simulation model was developed based on a series of interviews conducted with physicians. After performing sensitivity analysis on the model it is determined that only through controlling the inflow of potential patients can any meaningful reduction in physician workflow be achieved.
Thesis Supervisor: John R. Williams
Acknowledgement
I would like to take this opportunity to thank those who have supported and encouraged me throughout three years of advanced educational experience here at MIT
First and foremost, I would like to thank my family, Shoji, Chie, Akira, Masako, Shigeru, Ken and Uncle Akira and Aunt Yoshiko for their love and support.
I would also like to thank Dr. Mikio Shoji for his encouragement to pursue advanced education here at MIT.
I also thank to my colleagues -Andrew Ferriere, Glorimar Ripoll, Pai-Fang Hsiao, Sakda Chaiworawitkul, and Tashan Yen.
In Addition, I would like to thank Anthony Rogers, Bryan Bergeron, Daniel Sands, P.J. Huang, and Tricia Bourie for their great insights and wisdom from the health care professional point of view
I am also grateful to John A. Rassias, Professor, Dartmouth Collage, for his kindness and help for improving my English skills.
Also, I would like to thank my thesis and project supervisor, John R. Williams, for guidance and patience through the year.
Finally, my sincere gratitude goes out to my soul mate, Sachi Nagaoka, for her continued love, encouragement, and confidence in my ability.
I feel privileged that I can conclude my three years of education at MIT with the completion of Master of Engineering Program.
Table of Contents
A C K N O W L E D G E M E N T ... 3
TA B L E O F C O N T E N T S ... 4
L IST O F F IG U R E S ... 6
CH APTER 1 -INTRO DUCTIO N ... 8
1.1 BACKGROUND & PROBLEM STATEMENT - INDUSTRY OVERVIEW ... 8
1.1.1 The m arket... 8
1.1.2 General Trend in the Industry ... 9
1.1.3 Industry Issues and concerns...11
1.1.4 Industry Problem Summary... ... 12
1.2 EXISTING SOLUTION ... 13
1.2.1 Current Solution: Solutions already implemented...13
1.2.2 Our solution: Prototype and features... 15
1.3 P U RPOSE ... 18
1.4 M ETHODOLOGY... 19
1.5 THESIS ORGANIZATION ... 20
CHAPTER2 -INTRODUCTION OF THE METHODOLOGY ... 21
2.1 INTRODUCTION OF SYSTEM DYNAMICS... 21
2.1.1 System Thinking ... 22
2.1.2 Causal Loop and Feedback loop ... 23
2.1.3 Stock and Flow Structure... 28
2.2 BENEFIT OF SYSTEM DYNAMICS... 29
CHAPTER3 - DYNAMIC SIMULATION MODELING ... 31
3.1 OVERVIEW OF MODELING PROCESS... 31
3.2 INTRODUCTION OF DYNAMICS HYPOTHESES ... 32
3.3 INTRODUCTION OF BASIC STRUCTURE OF HEALTH CARE INDUSTRY... 43
3.4 SEGM ENTATION S... 45
-4-3.4.1 Quality of Service Loop ... 45
3.4.2 Reputation With Quality Service Loop ... 46
3.4.3 Reputation With Experience Loop... 48
3.4.4 Care Team Capacity Expansion Loop... 49
3.5 CAUSAL LOOP DIAGRAM WITH STOCK... 51
3.6 INTRODUCTION OF THE MODEL ... 52
CHAPTER4 - ANALYSIS OF THE SIMULATION ... 55
4.1 DETAILS AND CHARACTERISTICS OF THE SIMULATION MODEL... 55
4.1.1 Stock Structure... 55
4.1.2 Convert Tasks into Patients ... 56
4.1.3 A dmission Control Structure... 57
4.1.4 Discharging Control Structure... 59
4.1.5 Care lbam ... 60
4.2 SIMULATION RESULTS... 61
4.3 SUMMARY OF SYSTEM SENSITIVITY TEST ... 64
4.4 MODEL BOUNDARY AND ASSUMPTIONS ... 66
4.5 IN SIG H TS ... 69
4.6 FUTURE IMPROVEMENTS TO THE MODEL ... 72
CHAPTER5 - RESULT, INSIGHT AND DISCUSSION ... 74
R E F E R E N C E ... 76
APPENDIXI - SIMULATION MODEL ... 77
APPENDIX2 - INTERVIEW LOG ... 87
List of Figures
Figure 1.1 Industry M arket Size... ... 9
Figure 1.2 Government Expense on Health Care ... 9
Figure 1.3 On-Site and Off-Site System...17
Figure 2.4 Example of positive loop by Sterman, J...24
Figure 2.2 Example of negative loop by Sterman, J...25
Figure 2.3 Example of multiple loop by Sterman, J...26
Figure 2.4 Polarity and Link by Sterman, J. ... 27
Figure 2.5 Stock and Flow Structure Example...28
Figure 2.6 Decreasing information content in moving from mental to written to numerical database by Forrester, J...30
Figure 3.1 Rising Patient's consumerism...34
Figure 3.2 Causal Loop Diagram for Hospital Patient Flow...44
Figure 3.3 Diagram for Quality of Service Loop Set...46
Figure 3.4 Diagram for Reputation With Quality of Service Loop Set...47
Figure 3.5 Diagram for Reputation With Experience Loop Set... ..49
Figure 3.6 Diagram for Care Team Capacity Expansion Loop...50
Figure 3.7 Diagram for Hospital Patient Flow with Stocks...52
Figure 3.8 Hospital Patients Flow Simulation Model...54
Figure 4.1 Comparisons between Patients Flow and Task Flow Structure...56
Figure 4.2 Calculating total patient numbers from number of tasks...57
Figure 4.3 Admission Rate Control Components...58
Figure 4.4 Discharge Rate Control Component... 60
Figure 4.5 Care Team Stock Structure...61
Figure 4.6 Vensim© DSS Simulation Screen...63
Figure 4.7 Aggregated Output Screen on VensimC DSS...64
Figure 4.8 Patient represented by a sequence of Tasks... 70
-6-Chapteri -Introduction
1.1 Background & Problem Statement - Industry Overview
1.1.1 The market
The health care industry in the United States has become a 1.2 trillion dollar
industry as of the year 2000. It almost doubled in market size since early 1990 and is 1.7
times larger than the European market. In the United States, the industry consists of three
important parties: (1) payers such as the government and insurance companies, (2) service
providers such as hospital, and (3) physicians, nurses and patients. The Government's
yearly expenditure on medical service has increased significantly in the last thirty years.
According to a projection for 2008, the U.S. Federal government is expected to spend
24.5% or $620 billion, of the federal budget on Medicare and Medicaid, compared with 17.9% or $319 billion, in 1998. This trend is still escalating as the aging of society
progresses.
-8-14 12C 100 a0 6 4 2 1960 1970 1980 1990 2000 U.S. Health Car industry: 196 0- 20MX
Figure 1.1 Industry Market Size
10 $ in BiHion 25' 20 ' 10-~ 1978 1988 1998 2008* 0 Medicae &Nedemid as % of GDP
Sowoc: Burtau ofLabor Statistics, Modaily Labor Review, Nov. 1999.
Figure 1.2 Government Expense on Health Care
1.1.2 General Trend in the Industry
The changes that have occurred in the health care industry can be categorized into
three groups: (1) regulatory changes, (2) changes in the patient's mentality, and (3) changes
in the business structure.
Changes in the regulations started as new technologies developed. For instance, as new technologies such as electronic patients records started to get attention, the United
States Congress recognized the importance of establishing unified guidelines for the future.
Therefore, congress passed the Health Insurance Portability and Accountability Act of 1996
(HIPAA). The main purpose of HIPAA is to set a formal privacy and security guideline for
health care related information management.
Regulations are not the only change in the health care environment. Patients'
attitude toward health care has also changed. Rising patient consumerism is one of those
changes. Diffusion of informed consent, increasing number of hospital visits per patient,
and increasing accessibility to health related information through the Internet are educating
patients more about their health condition and medication.
Corresponding to such fundamental change in the environment, hospitals are
forced to make major changes in its system. One of these changes is the hospital financing
structure. Today, some large private hospitals are trying to adopt a service-based charge
system. Traditionally, they used a capitation scheme that limits their inability to be
financially sound. Service-based charges give stronger incentive for hospitals to increase
their operation efficiency. This is an appropriate strategy, particularly since the need for
medical service has increased significantly over the last two decades.
These changes are still progressing and creating a more complex business
environment rapidly.
-10-1.1.3 Industry Issues and concerns
The primary concern for health care organizations these days is the rapidly growing demand for medical service, which grows as a result of an aging society As it has been observed in the last ten years, the fear of having insufficient capacity to meet such high demand appears to have become a reality. Excess demand could cause a serious
damage to the entire health care system in the long term.
Overwork for physicians is one of such damages. Today, physicians and nurses are working harder and longer hours than ever before. Yet, patients still queue up to request more medical services.
Consequently, diminishing quality of medical service occurs as the overwork
issue becomes serious. Under the tight constraint of budgets, human resources, and time, excess demand for medical services can seriously have impact on the quality of service
over time.Hospitals have two main choices to maintain high quality of service, while dealing at the same time with increasing demand. One is to reduce that demand, by not accepting any more patients than their capacity allow for. The second choice is to improve
their operation efficiency. Today, many hospitals have chosen to go for the latter option.
They are currently interested in introducing information technology (IT) as one of the
methods to achieve such an objective.
1.1.4 Industry Problem Summary
After more than twenty yeas since people realized the terrifying future of the
social security system, the fear of losing an affordable and quality health care is about to
become a reality. The fundamental shift in the demography forces significant changes in the
environment surrounding health care organizations, such as the Balanced Budget Act of
1997, rising consumerism of patients, increasing government and public oversight, change
in regulatory requirements, and rising prescription. Today's health care organizations are
feeling pressure as never before.
-12-1.2 Existing Solution
1.2.1 Current Solution: Solutions already implemented
The adoption of the IT within the hospitals in the United States has been
progressing gradually over the last ten years. The movement started with the adoption of
the electronic patient records system, because hospital administrations believed that it could
improve efficiency by reducing unnecessary paper work. Administrators also believed it
would not lower the quality of medical practice, since those data were mainly used for
administrative duties, such as billing.
Once they adopted IT for administrative purposes, they then tried to implement
the system in actual clinical practice. Specialists, like laboratory technicians and
radiologists, became the first adopters. Their adoption of IT in practice significantly
improved the efficiency of hospital operation because of the increased accessibility to
critical patient information such as X-Ray pictures and blood test results. IT also
Today, implementation of the hospital information system is facing a new
challenge with the issue of system integration. One of the reasons why integration was so
difficult to achieve is because every department has different systems. For example,
Massachusetts General Hospital, the largest hospital in New England, has at least seventeen
different systems. Integration was made even more difficult by the fact that systems are
required to carry out daily operation without interruption.
Another reason is because there has been no standard format. For instance, the
name of any particular field for the same information may be different in the two different
departments' database. Some of the departments have the same information with different
field names. These kinds of small differences among systems make it difficult to integrate
disparate systems. The introduction of HIPPA compliance may resolve this issue in the near
future.
Also, the lack of vision as a whole contributed to the challenge as well.
Historically, as briefly described in the previous section, introduction of a system started
gradually field by field, or department by department, as an experiment. During these
-14-processes, each department made its own decisions regarding the kind of systems it was
going to use without consensus from and coordination with others. This is because each
field in medical practice is highly specialized, and the characteristics of information being
handled vary according to the field where that particular physician belongs. Consequently,
so many different types of systems were introduced without consideration given to other
departments. This resulted in the development of integration difficulty. Weak leadership
from hospital management through these processes regarding purchase decisions surely
contributed to the current state of affairs.
1.2.2 Our solution: Prototype and features
Through our eight months thesis project for the Master of Engineering Program at
MIT, we have tackled the very same issue that many hospitals are coping with. Our goal is
to identify and develop a more effective solution for these real challenges by using an
information system that would help hospitals improve their operation efficiency. Thus, the
across the hospital, and provision of necessary information for physicians' decision making.
Our proposed solution consists of two main components. One is the on-site
clinical information system, and the other is the off-site home monitoring system. The
on-site system provides support for better decision-making by doctors and is primarily used
in the hospital. This system inherited many of its features from systems already in place.
The core value for the off-site system is patient monitoring. The system adds new
value to existing clinical systems because it reduces the physicians' workload.
One of the reasons why a doctor's workload has increased considerably these
days is the growing number of patients with chronic diseases. Today, not only old people
but also young children are struggling with these kinds of diseases. As a result, the number
of patients that a doctor has to take care of increases sharply and is creating a very serious
gap between hospital capacity and demand by this group of patients.
Patient
Off Site
Patient
On Site
Prevention & Early detection
Monitoring & Consultation
Diabetes Patients
Focus
Task
Example
Treatment Medical TreatmentSaint Joseph Hospital
Figure 1.3 On-Site and Off-Site System
We believe that the integration of these two types of systems will improve
efficiency of hospital operation and become a great alternative for doctors to maintain an
intimate relationship with patients, while at the same time reducing their workload. For
instance, the patients' monitoring system allows physicians to communicate with patients
without their physical presence in the hospital. Furthermore, this allows physicians to
maintain the same level of commitment. Consequently, patient visits can be reduced. This
will enable the physicians to acquire more flexibility with their schedule.
Based on the above concept, a prototype was developed. The purpose of this
prototype is to demonstrate our idea for the next generation hospital information system.
Because of given time constraints, limited resources, and considering the purpose of this
prototype, a boundary for the prototype was set as follows. First, focus on specific diseases
such as diabetes and hypertension was strictly implemented. Second, a sample patient
database was created instead of dealing with legacy systems and databases that hospitals
are currently using. Third, security issue was not given top priority. Log-in and password
check is the only security feature that is currently implemented.
1.3 Purpose
This paper examines the verification of our prototype and its concept in a real
hospital environment. More specifically, The following concepts are discussed: (1) a
dynamics simulation model, based on several interviews conducted with the health care
professionals who are currently working for well respected Boston-based medical
institutions; (2) an analysis of the model is presented along with the model boundary,
characteristics of the model behavior, and assumptions made; (3) desirable features for
integrated health care information system, which reflects some real needs we obtained
through interviews and model analysis; (4) a comparison between those desirable features
-18-and actual features that our prototype is currently providing, along with thoughts regarding
future improvements of the system.
1.4 Methodology
In order in order to verify the degree of compliance of the prototype in
comparison to the reality, a system dynamics simulation model has been developed. System
Dynamics is an effective tool to understand the complex world around us. It has been
applied to a wide variety of challenging cases in politics, social science, business
management, literature, and engineering.
One of the underlying premises of system dynamics is to see the world as a chain
of events that causes changes in other parts of the system rather than just a linear
progression of disjointed, single events.
In the past, works related to infection disease and insurance have been done using
the system dynamics approach to gain a better understanding of the issues in the health care
1.5 Thesis Organization
In order to present the idea of this thesis effectively, the structure of the simulation is discussed first. Following that, an analysis of the model structure, model behavior and limitation of the model is performed. Next, future improvement to the model is listed. Finally, the verification and the future improvement of our prototype based on insights acquired through the simulation are discussed.
-20-Chapter2 -Introduction of the Methodology
2.1 Introduction of System Dynamics
System dynamics is a field of study, founded by Jay Forrester in 1956 at Sloan
School of Management, Massachusetts Institute of Technology, for studying and managing
complex feedback systems, such as one finds in business and other social systems.
What system dynamics attempts to do is to understand the basic structure of a
complex system and the behavior it can produce. Many of these systems and the problems
that they created can be built as a computer model, and those models are often used for
developing effective policies, strategies and solutions for problems.
System dynamics takes a different approach from other approaches to study
complex systems in social, political, business and many other issues. That approach is the
use of feedback loops. Combination of causal loop diagram and stocks and flows diagrams
- both are core components of system dynamics - help to describe how systems are
find in modem day problems.
Following, I will describe some of the important concepts and terms that are used
in system dynamics.
2.1.1 System Thinking
System thinking is a core component of system dynamics. The approach of
system thinking is fundamentally different from that of traditional forms of analysis.
Traditional analysis mainly focuses on separating smaller individual pieces of the system
and analyzes each characteristic. System thinking, in contrast, looks at things as a whole,
and focuses on how one constituent interacts with other constituents of the system. In other
words, system thinking deals with the interactions among parts of the system, which
enables us to understand how the entire system behaves as a result.
On the contrary, traditional methods deal with a part of the system and analyze
its function, structure and characteristics. This difference in system thinking results
sometimes in strikingly different conclusions than those generated by traditional forms of
-analysis, especially when the subject is dynamically complex.
2.1.2 Causal Loop and Feedback loop
Feedback is another important concept in system dynamics. Feedback loops
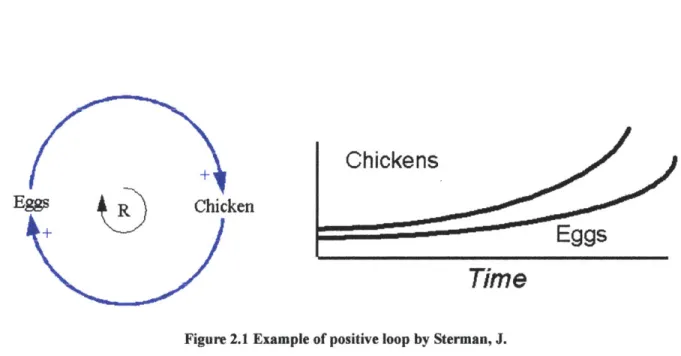
consists of closed paths of cause and effect. Loops can be categorized into two types: one is positive feedback, and the other is negative feedback loop. Positive loops are known as self-enforcing loops. In Figure2.1, I present a simple example of a re-enforcement or positive loop. The diagram is constructed by two variables and two links. The logical connection for this diagram is following: as the number of chickens increases the number of eggs increases. In the same way, the number of eggs increases then the number of chickens increases. Therefore, repetition of this cycle generates an exponential growth in the population of chickens and eggs, as shown in Figure2. 1.
Chickens
Eggs
Time
Figure 2.1 Example of positive loop by Sterman, J.
Negative loops are self-correcting. Figure2.2 shows an example of a negative
loop. The logical connection for this diagram is that as the number of chickens increases,
the number of road crossings of the chickens increases. However, as the number of
crossings increase, the number of chickens killed by accident also increases. This
eventually reduces the population of chickens over time. Therefore, the outcome of this
loop should look like goal seeking behavior as presented graph in Figure 2.2.
-24 -.--- I t 2t OW - - --- -1 . . . ... ---- -- -...
4
Chicken B CRnsii Orossings
+
Road Crossings
Chickens
Time
Figure 2.2 Example of negative loop by Sterman, J.
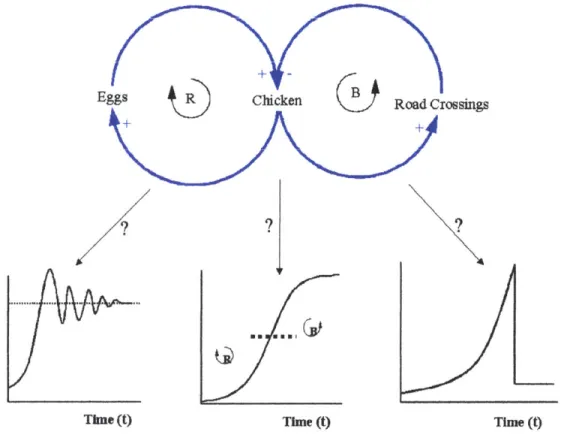
Thus, the interaction of these two loops creates dynamics behavior which would
look like Figure2.3. Figure2.3 is an example of multiple loops. The diagram is the
combination of loops in Figure2.1 and 2.2. Three graphs presented in Figure2.3 are the
example of some of the expected behaviors that this combination of two loops could
generate. The difference in the shape of the graph is caused because of the difference in the
strength of the loops. In other words, the loop or loops, that is the strongest at any given
time will temporally dominate the system and define the shape of the graph. Therefore, we
Eggs Chicken Road Crossings + + Time (t) To (o)l Time (t) Time (t)
Figure 2.3 Example of multiple loop by Sterman, J.
As I have shown above, causal loop diagrams are simple maps showing the
causal links among variables with arrows from a cause to an effect. This causal loop
diagram consists of three elements. These elements are variables, links, and polarity.
Variables are the elements of the system. Such examples are Chicken and Egg in Figure2.3.
Links are the connection of those variables. The nature of the relationships between two
variables is represented by polarity, either a positive (+) or negative (-) signature.
- 26
Symbol
Interpretation
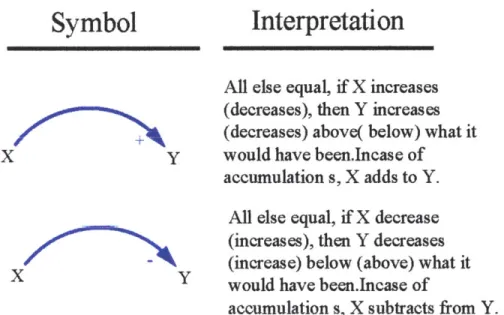
All else equal, if X increases (decreases), then Y increases + (decreases) above( below) what it
y would have been.Incase of accumulation s, X adds to Y.
All else equal, if X decrease (increases), then Y decreases - (increase) below (above) what it Y would have been.Incase of
accumulation s, X subtracts from Y.
Figure 2.4 Polarity and Links by Sterman, J
x
/100
2.1.3 Stock and Flow Structure
There are some limitations in causal loop diagrams, although a causal loop
diagram is a friendly and useful tool to represent interdependencies and feed-back
processes. One of the most important limitations of causal diagrams is their inability to
capture the stock and flow structure of the system. Stocks are accumulations, and the level
of accumulation in the stock is controlled by flows, both inflows and out flows. Stocks are
important because stocks generate delays that cause dynamics in behavior of the system.
Stock and flow, along with feedback, are two central concepts of dynamic system
theory.
Stock
Inflow Outflow
Inflow
Ouflow
Figure 2.5 Sock and Flow Structure Example
-28
2.2 Benefit of System Dynamics
There are many benefits of using system dynamics. It can be a very powerful and
useful tool to deal with complex issues in many levels. For example, a causal loop diagram
is particularly useful because it is a very explicit and intuitive tool. It can be used as a tool
for sharing our mental models with others and help us in unifying knowledge on issues.
System dynamics also help us to enhance our mental model. We usually make
assumptions and simplify issues to understand them better in the own way.
However, these assumptions sometimes make difficult for us to share ideas.
System dynamics is helpful to clarify such underling assumptions and enhance the
boundary of our mental model. Those implicit assumptions are often elicited and clarified
through the process of developing causal loop diagrams.
Among many benefits, probably the most valuable contribution of system
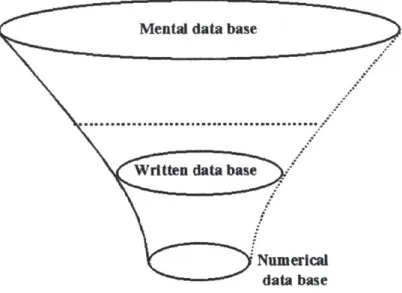
dynamics is allowing us to use the richest source of information that we can afford, i.e., mental database, to build effective policies and solutions.
The process of changing data format from mental data to written data, and written
data to numerical data diminish the richness of information, which is often reflected in
one's insights. The system dynamic's approach overcame this problem by introducing own
framework and methodology that allow them to directly access to the mental database. This
advantage of using mental database becomes even more significant since it is the most
effective strategy to make a transit in paradigm.
Mental data base
Written data base
Numerical
data base
Figure 2.6 Decreasing information content in moving from mental to written to numerical database by
Forrester, J
-Chapter3
-
Dynamic Simulation Modeling
3.1 Overview of modeling process
During the last eight months, I was privileged to be able to interview physicians,
nurses, hospital administrators, faculty members of medical schools, health care system
vendors, and health care consultants. Through these interviews, I tried to understand the
essence of the issues and challenges with which they are currently struggling, and to find
the direction where this industry is headed. In this and the following chapter, I will present
a simulation model that my colleague and I developed. This model is based on interviews
my colleague and I conducted. Our intention for building a simulation model is to replicate
some of the behaviors that we can observe in the real health care industry in the United
States, and analyze that model to gain a better understanding of the industry. However,
since the health care industry is a large and complex system, it is impossible for us to
capture its many aspects and entities.
care professionals, which we identified through interviews, and kept the model boundary
smaller in order to keep the simulation within a manageable size. To build this simulation
model, we used Vensim©. First, I will introduce some dynamics hypothesis - patterns of
expected behaviors of the key variables -that we obtained through interviews. Then, I will
move on to introduce a model structure.
3.2 Introduction of Dynamics Hypotheses
As I described in the previous section, health care is a large and complicated
system. It involves many actors and aspects. Through interviews that we conducted with
physicians, nurses, hospital administrators, health care information system vendors, and
consultants who work in health care industry, we were able to identify many different types
of issues that the health care industry is currently facing. Those issues reflect some of the
important dynamic behaviors which exists in this industry. Following, I will present a list of
subjects that people in the industry are interested in and for which they have particular
concern. I add a brief explanation of each issue.
-0 Increasing number of patients
>
As the aging society progresses, the number of people who need medicalattention increases significantly
Increasing cost in health care.
> Insurance premium has been increasing sharply in the last ten yeas as the total
cost for medical service has increased, corresponding to the progress of the aging
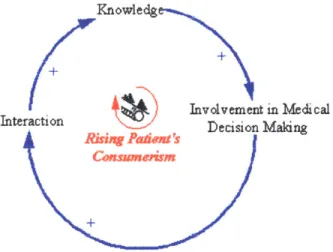
9 Increasing patient's consumerism
As patients became more knowledgeable about their conditions and diseases, they
tried to participate in the process of decision-making. This participation for
decision-making made patients more knowledgeable through their increased
interaction with physicians. As a result, there relationship between physicians and
patients also become more active.
Knowledg Tnvolve-tme Interaction Decision Rising Padan 's CMSWnMsMW Lt in Medical Making
Figure 3.1 Rising Patient's consumerism
-0 Finance structure of health care industry
Government and private insurance companies provide hospital primary financial
sources. Hospitals receive money, which is allocated according to specific
guidelines by the insurance contracts. Hospital financing is currently constrained
by the framework of capitation, which has been primal system in insurance
industry for a long time. The capitation system defines two things, (1) how much
money can the hospital get from insurance companies per patient, and (2) how
many patients' hospital needs require attention.
4 In the following section is a very brief summary of a typical capitation
contract between a hospital and HMOs. " Up to 100 patients, we pay you 50
dollars per patients. However, even if you exceed 100 patients, I will not pay
more than 5,000 dollars, which is equilibrium amount of 100 patients times
50 dollars per patient.
The capitation system exerts an enormous amount of financial pressure on
medical attention. However, an excessive number of patients creates serious
financial trouble for a hospital. Thus, hospitals, naturally, try to optimize their
operation by cutting unnecessary treatment to patients. They rather choose to
provide financially but not technically suitable due to the patient's health care
plan.
In order to resolve this issue, some hospitals started to use a service based
charging system, i.e., the amount of money the hospital can get is based on the
service provided. The adoption of this new system seems to be supported not only
by the hospital but also by the patients who are involved in increasing their
consumerism.
0 Issue of overwork for physicians and nurses
An increase in the number of patients develops a tremendous amount of overwork
for the physicians, nurses, laboratory technicians and other members of the
caregiver team.
-9 Quality of medical service issue
>
Increasing work pressure develops a negative influence on the quality of service,which is often visible in the rate of mistakes accumulated and the time required to
finish each assigned task.
* Competition
>
Each practitioner would like to be the best in the field because excellentperformance makes them influential in the health care organization and allows
them to make a great deal of money. On the other hand, this sense of rivalry can
be used to introduce new technologies. For instance, if a successful
implementation of the new technology boosted the reputation of one particular
doctor, other doctors, in order not to be surpassed, may be attracted to using the
technology. This helps to spread the value of that particular technology, as well as
0 Reputation of health care organization issue
>
Reputation is one of the useful indicators for hospitals to understand how wellthey are doing from their patients' point of view. The reputation of a hospital can
be classified in two types. One is the type of reputation driven by an excellent
doctor, and the other is based on total performance of the hospital in general.
However, it is not always clear which of these reputations is the stronger, nor is it
easy to measure the impact of the combined reputations.
* Authority issue
>
Many hospitals are more likely to depend on one doctor or a small group ofdoctors' performances and reputations. The fame of these doctors empowers these
particular doctors and the hospital risks losing its authority. This kind of shift in
power can often be seen in budget control. Today, a department head has more
control on how to spend his or her budget than hospital management. Further,
-38-the tendency of each field becoming more specialized also contributes to -38-the
transfer of decision making authority and budget control from hospital
management to department head level.
* Tradition vs new method issue
>
Physicians have practiced in their own way over decades, going through the sameprocesses and routines of making a diagnosis by writing it out on paper. One of
the reasons why it is difficult to introduce a new technology into medical practice
is because of similar, routinized work habits.
For example, in the case of electronic patient records, from a physician's point of
view, there is no difference in function whether writing a note on paper or typing
on a PC, since both provide exactly the same functions and data which they used
for making a diagnosis. Therefore, physicians are more likely to stay with method
with which they are familiar. For the successful introduction of the new
9 Issue of identifying leading user
>
For the successful implementation of new technologies, it is important to satisfytwo requirements. First, the new technology
physicians' process flow.
should fit into the existing
It is not likely to be adopted when technology does
not fit into this existing workflow, even if that technology were superior.
Second, to identify the appropriate primary users. This is very impermanent
because we often fail to identify them accurately because of misunderstanding the
system. For example, people often assume that doctors are the primary users of
health care and actually input patient data into the system. However, in reality
nurses are most likely to be in charge of data input, while physicians remain as
the primary users of such information. Therefore, it is important to get support
from nurses.
-40-* Adoption of technology and technology learning curve
The Learning curve is a serious issue for physicians. They have tried many
prototype systems that were brought by vendors. However, most of these vendors
could not survive in competition and they stopped supporting the system after
few months. As a result, doctors wasted their time trying to learn how to use a
new system. Because many frequently experienced this problem, doctors were
discouraged from trying out new systems that require some months to learn. It
usually takes six months for a nurse to learn how a new system and technology
works, while it usually takes much longer for doctors.
* Time sensitiveness and convenience factor influence on use of IT
>
Caregivers are very time sensitive people. One of the reasons why patients areasked exactly the same questions over and over again when they are admitted to a
hospital is not because they do not have those data in the patient's record, but
records.
To resolve this concern, hospital has tried to adopt information technology. Such
a technology is not yet convenient enough to improve their work habits because
many databases in the hospital have not been integrated.
Doctors maturing rate and hospital capacity issue
>
It is important for hospitals to control the level of maturity of physicians andnurses to maximize hospital capability. In order for inexperienced doctors to
polish their skills, they need to get sufficient experience. Today, in a tolerant
environment, such as a teaching hospital, inexperienced doctors are allowed to
make minor mistakes in order to learn from them. In contrast, in an environment
where making a mistake is not an option, such as in an Emergency Room,
physicians are instructed to follow strict protocols and guidelines, and
inexperienced physicians gain experience while following those protocols.
-0 Nurse helps to improve doctors' performance
Another way for inexperienced physicians to gain experience and necessary
knowledge is learning from nurses. Nurses are a great source of information for
two reasons. For example, they are the ones who actually take care of patients on
daily bases. Also, nurses are often more familiar with the hospital system than
doctors. In order to exchange their experiences, perspectives and information,
currently, nurses spend time one-on-one with physicians. These meetings help
physicians both in developing intimate working relationships and obtaining
necessary information.
3.3 Introduction of basic structure of health care industry
As I illustrated in the previous section, the health care issue is a large complicated
system, and it is impossible for us to capture every issue in one small simulation model.
Therefore, my colleague and I focused on one particular aspect of the issue, which may
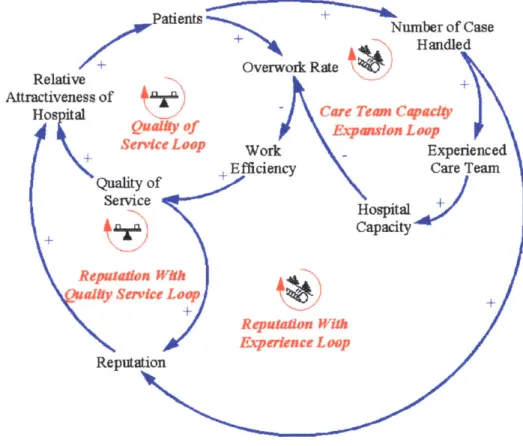
Figure 3.2 is a causal loop diagram for our simulation. This represents a very
simplified version of the aspect of the industry, which we are trying to capture. This
aggregated diagram contains four important loop sets, two re-enforcement loops and two
balancing loops. Those four loops are Quality of Service Loop, Reputation With Quality
Service Loop, Reputation With Experience Loop, and Care Team Capacity Expansion Loop.
Following, I will describe detail of each loop.
Patients +Number of Case
+ RHandled
+ Overwork Rate
Relative +
Attractiveness of C
H o ial ~Care Temn Capacity
Qualty of Expansion Loop
Service Loop Work - Experienced
Quality of + Efficiency Care Team
Service ServiceHospital +
Capacity
Reputalion With ality Service Loop
Reputation With Experience Loop
Reputation
Figure 3.2 Causal Loop Diagram for Hospital Patient Flow
-44
3.4 Segmentations
I will introduce the basic logic for each of four loops -Quality of Service Loop, Reputation With Quality Service Loop, Reputation With Experience Loop, and Care Team
Capacity Expansion Loop- following.
3.4.1 Quality of Service Loop
Figure3.3 represents Quality of Service for the hospital. This is the base loop for
our model. We introduced five variables here. They are: (1) Patients, (2) Overwork Rate, (3)
Work Efficiency, (4) Quality of Service, and (5) Relative Attractiveness of Hospital. The logic
for this loop is seen in the fact that as the number of patients increase, Overwork Rate
increases. As a result, Quality of Service is diminished corresponding to decreasing Work
Efficiency. Thus, the Relative Attractiveness of Hospital decreases, and this attracts fewer
Patients Relative Attractivenes Hos ital Number of Case Handled + Overwork Rate s of Quality of Experienced
Service Loop Work Care Team
+Efciency Quality of
Service Hospital
Capacity
Reputation
Figure 3.3 Diagram for Quality of Service Loop Set
3.4.2 Reputation With Quality Service Loop
Figure3.4 represents how the quality of service the hospital provides affects the
hospital's reputation. In this loop, we introduced an additional variable, Reputation, to the
Quality of Service Loop, which I described in the previous section. This loop is also a
balancing loop. The basic logic for this loop is that better quality of service results in a
-46
good reputation. This good reputation contributes to increase the relative attractiveness of the
hospital. However, an increasing number of patients eventually kills the quality of service
due to overwork.
Patients
Number of Case
Relative Overwork Rate
Attractiveness of Hospital
Experienced
Work Care Team
Reputation with Efficiency
Quality Service Loop + Hospital
+
9Capacity
ua itQuality of
Service
Reputation
Figure 3.4 Diagram for Reputation With Quality of Service Loop Set
3.4.3 Reputation With Experience Loop
Figure3.5 represents how the number of cases that the hospital handles affects its
reputation. We introduced another variable, Number of Cases Handled. We tried to capture
two things: (1) how the number of visible cases, or high profile cases, attract more potential
patients, and (2) how the level of maturity of physicians affects a hospital's reputation. We
believed that both of these inputs generate a positive reputation for the hospital. Thus, number of new patients is increased as the number of successful cases increases a good
reputation. This loop is a positive feedback loop.
-48-Number of Case Handi d Rea +v Overwork Rate
Relative Attractiveness of
Experienced
Work Care Team
Quality of Efficiency
/
Service Hospital Capacity R eputation WUA + Experience Loop ReputationFigure 3.5 Diagram for Reputation With Experience Loop Set
3.4.4 Care Team Capacity Expansion Loop
Figure3.6 represents how the hospital capacity is built and expanded. Here, we
introduced two new variables, Experienced Care Team and Hospital Capacity. This is also a
positive loop. However, this loop is more complex than the previous one because it involves
a time delay between Number of Case Handled and Experienced Care Team. This delay
becoming a doctor takes a long time, and gaining sufficient experience takes even longer.
Therefore, as the number of patients increases, the number of cases handled
increases. The doctors' skill level is improved with a time delay as they experience more
cases. Once the number of experienced doctors increase, hospital capacity is expanded. This
decreases Overwork Rate for physicians. As a result, Quality of Service is improved. This
results in attracting more patients to the hospital.
Patients
Number of Case
SOrHandled
Relative + verwork Rate
Attractiveness of are Team Capacty
H ital Expansion Loop
Work Experienced
+Efficiency - Care Team
Quality
ofService +
Hospital
+ Capacity
Reputation
Figure 3.6 Diagram for Care Team Capacity Expansion Loop
-3.5 Causal Loop Diagram With Stock
Causal loop diagram presented as Figure3.2 was appropriate for presenting key
logical connections among variables. However, that diagram did not capture a certain type
of important information such as stocks and flows.
In Figure3.7, we presented a new diagram that is improved from a previous
diagram (Figure3.2). We identified some of the important stocks in this new diagram. We
introduced five stocks in total. They are Patients, Number ofCase Handled, Doctors, Nurses,
and Reputation. Identifying these stocks are one of the important processes because these
C--i Paiwent; patient Flow Relative Auractiveness of + + HospiW OverwoskRate Expeznence Rate nbr Cs
Quality of Service + Work Efficiency H+ptl~pct
Deca~it A OMNIt ttng~eutHosCpcital IRa Wk + +Caact
- LooM at
' Rate for ctors Cure Team
Reputation Inisrcue Capacity
Decay Rate Gtting Reputati CaaiyNurses
Matai Rate for
lnvatmel
Figure 3.7 Diagram for Hospital Patient Flow with Stocks
3.6 Introduction of the Model
In order to convert a causal loop diagram (Figure3.7) into a simulation model, we
narrowed down the scope of the issue and concentrated on the following essential
hypothesis.
-52-0 Patients are the main stock of the system.
" Overwork Rate controls Quality of Service.
" Hospital Capacity is defined by number of experienced physicians.
Based on the three points listed above, we developed a simulation model, which
is displayed as Figure3.8. In order to build this model, we used Widget Model (Chapter 18
of Business Dynamics, Sterman, J.) as a reference.
Task per Patients + Coming Pei Number of Peoile Corning to Hospital everyday Iritial Task To
Initial Care Tea
Total
+ Patients Normal Done
+ Number of Work Rate Number of People Admitted
People Waitingn
C INTask To do Task In
Generatn Task In Process Task Done Rate Process Rate Process Rate
+i Done T e
/a Team
In Tasks +Adpa asko CpdrTs
rday M Adndssiox niml nsud
Process c4"Ic - Work + Maximum
Start Rate Cn "-" DIs
CwtLap LOOP..
Minimumn Tune to F CotlpTsk
AmtNeed to be Dshg
f+ Done CmLopWorkP
Max Care Team+ Do TbefrGp Capacity in Task
Table for Gap
Fulfilment /
4
In
Inital Task In Process
+
-Care Team 0= =C
Task for One 'an Constant
Capacity Raturig
Rate .penence
essure
Figure 3.8 Hospital Patients Flow Simulation Model
-Chapter4
-
Analysis of the Simulation
4.1 Details and Characteristics of the Simulation Model
In order to successfully convert the loops -Quality of Service Loop, Reputation
With Quality Service Loop, Reputation With Experience Loop, and Care Team Capacity
Expansion Loop- into an operational simulation, we came up with the following ideas.
4.1.1 Stock Structure
The first challenge that we faced was the representation of the amount of work in a
hospital. Initially, we set the main stock as Patients and Admitted Patients (Figure4. 1). It was
natural for us to think of setting these two as the main stock. However, as we developed the
rest of the simulation, we realized the difficulty in trying to capture the level of hospital work
based on the number of the patients without considering other factors. For instance, the level
of a hospital workload seems to be defined by the number of tasks performed rather than the
as shown in Figure4. 1.
PtetPtet Patients Patietns
Patients In flow Patients
Admission Rate Discharge Rate
Task To Task In
do Process
GPnerocsate
Process Rate Process RateTask in Task Done Rate
Figure 4.1 Comparison between Patients Flow and Task Flow Structure
4.1.2 Convert Tasks into Patients
Although we did not treat patients as the main stock, it is still a very important
variable. In fact, "patients" is still a unit that is the most often used in any medical institution
to measure hospital capacity. Therefore, we came up with the solution of converting the
number of the tasks into the number of patients. Figure4.2 is the component that allows this
conversion in numbers.
-Task per Patients
Total Patients
Number of '1 Number of People People Waiting Admitted
Ps
Toes R
Task In Process Rate
Figure 4.2 Calculating total patient numbers from number of tasks
4.1.3 Admission Control Structure
To control Task in Process Rate is one of the other important components of this
simulation.
There are two important basic objectives that this component needs to accomplish.
One is that Task To do not generate negative value since such concept does not exist in the
real world. Another is to accept no more patients than capacity, defined by the number of
Rate, which is the ratio of Task in Process and Max Care Team Capacity in Task. This
fulfillment rate controls the number of newly admitted patients based on its current vacant
capacity.
Task To Task In do Task In Process Process
Rate
Ad a d~pc Admiwvion~
Maximum Process ore Loop
Start Rate
Capacity Minimum Time Fullfilment Rate
to Adit Max CareT
le for Gap Capacit in Task Fulfilment Task for One +
Capacity Care
Matrin Rae Constant
Tm
Maturing Rate -d Maturig Rate
Time to Get Experience
Figure 4.3 Admission Rate Control Components
-58-4.1.4 Discharging Control Structure
Controlling discharge rate is another important task. We developed a component
which controls this flow by using the level of Work Pressure. There were two ideas that we
wanted to implement here. The first idea was the representation of work pressure. We defined
that the total tasks that Care Team has to do is the sum of Task to do and Task In Process. We
took the ratio of this number, the sum of two values, and hospital capacity and named that
Work Pressure. This means that not only admitting more patients, but also having more
queuing patients is generating more work pressure.
The second idea is how this work pressure influences discharging rate, Task Done
Rate. In our model, Task Done Rate will decline when Work Pressure increases. The basic
logic for this follows: Once the work pressure goes up, there results decreased efficiency in
the work. Thus, more time is required to finish for task. As a result, the Task Done Rate will
decline, causing fewer discharges of patients.
J
Normal Done
+ workRate
Task To Task In
do Process Task Done
Process Rate Minimum Done
+ Time er Task
haa Capac
Wor Pressure WO
Effect Loo Maximum
Discharging Rate
+ Total Tasks Need
to be Done et
Max Care Team + ok Psseec
C apaci in Task
Task for One Tame
Capaity eamConstant
Maturing Rate Time to Get
Experience
Figure 4.4 Discharge Rate Control Component
4.1.5 Care Team
In reality, hospital capacity is the function of physicians, nurses, and equipment.
Moreover, physicians and nurses, who are the stocks, can be divided into two different types:
experienced and inexperienced. However, we simplified this mode as Figure 4.5.
-60
Max Care Team Capacity in Task
+ + Constant
Tas caMaturing Rate
Task for One Ceam
Capacity Maturing Rate Time to Get
"*N Experience
Figure 4.5 Care Team Stock Structure
4.2 Simulation Results
In the following sections, I will write about the result of our simulation run. In the
beginning, I will introduce our simulation model and its initial conditions. Figure4.6 and 4.7
are screenshots from the simulation of Vensim© DSS. Figure4.6 is the simulation itself.
Figure4.7 is its output graphs. The following shows the value for variables of the base run
simulation:
0 Task per patients = 5 tasks
* Number of people coming to hospital every day = 100 people
" Initial task to do =1000 tasks
* Initial care team = 23.5 team
* Initial Task in Process = 0 task
* Minimum Time to Admit = 0.25 day
* Task for one capacity = 5 tasks per team
* Time to get experience = 180 days
* Constant Maturing rate =5 teams
* Minimum Dome Time Per Task = 0.5 day
* Normal done Work Rate = 3 tasks per day
* Simulation Time = 30 days
-62
L* Ya aO"f " To* 46k,
Task per 1----a- e
patents Normal Done
+ er ofNumber of People Work Rate
Task To Task In
Gleneraftag Task In
cess Process Rate Minimum Done
+ TimerTk
I_+-- Ai
)
DConng In Ta skso
per daa straint
Mwtimusn Process -+ Maximum
Number of People ut\%% C £ffMc* Loop & DiwkUV
Coming to Hospital Total -he Conshl Loop
everydayto Advt
Total Tasks Need
Max CrTeam
Capa inTask
Initial Task To Do
+ + Constant
IiiOre eam +eMawunn* Rate
Task for One
Initia Task In Process Capacey Gam
to et
Figure 4.6 VensimC DSS Simulation Screen
R
141
yw"i wlofts' A #8
TA
Task In Process Task In Process Rate Total Patients Capacity Fullfilment Rate
* 20,000 600 4,000wW
0
8 16 24 0 6 12 18 24 30 0 6 12 18 24 30 0 6 12 18 24 30TIe (day) Tne (day) Time (day) 7=e (day)
T%* ?Aocs PWS:00 T& T& k V~w Re em* - T*UMW TOW e CM - piqIe Mpw~ u~s ~:Cm - d
Task To do Task Done Rate Number of People Waiting Work Pressure
4,000 8 600 200
0 8 16 24 0 6 12 18 24 30 0 0
Time (day) Time (day) 0 6 12 18 24 30 0 6 12 1824 30
Tne (day) Tne (day)
Tede To I: Curat Tedk Ta Dow Fift : Ceuu - TakAW HN* -d a : Cwt - -- vn. M Dora
Number of People Admitted
4,000
0 6 12 18 24 30
Tme (day)
M blwdP"qh Amtkod: C - pum "
Figure 4.7 Aggregated Output Screen on VensimC DSS
4.3 Summary of System Sensitivity Test
I conducted several simulation runs and identified the most influential variable in
the system. The primary purpose of checking the sensitivity of the system for each input is to
find effective solutions for the problem that the system created. Through these simulation
runs, we discovered some interesting behaviors.
-64
I will briefly summarize those results:
* Minimum time to Admit
>
Increase in value for this variable generates longer time delay for the entiresystem. Task In Process Rate, Task Done Rate, Capacity Fulfillment Rate, and
Maximum Discharging Rate shows less steeper S-shape growth.
* Initial Care Team
>
This value represents the number of care teams available at the starting point ofthe simulation. Increase in this number generates overshooting behavior in Task
To do and Task in Process Rate. However, it does not provide significant impact
on Task In Process and Task Done Rate. Basically, what is happening here is
" Task for One Capacity
>
This represents the number of tasks that one team can handle. This variable cangenerate some change in behavior for Task lb Do and Task In Process Rate.
Essentially, this has similar impact as Initial Care Team has.
* Constant Maturing Rate
>
This value represents how many care teams are generated. This value cangenerate an arch similar to the shape for Task To Do. Increase in this value also
generates less work pressure and enlarges Maximum Discharge Rate
4.4 Model Boundary and Assumptions
Any simulation model has a boundary and a limitation. Understanding these
constraints, including the assumptions we made for simplifying the reality, is a very
important process of the model analysis. Here I will briefly summarize and discuss the
constraints of the model.
-66-0 Constant growth rate for Generating Process Rate
We set this as a constant for two reasons. First, people visit a hospital whenever
they feel sick whether they are actually sick or not. People do this because they
need to hear professional opinions from doctors to feel better. Second, recent
statistics show that the number of patients has been increasing significantly. We
wanted to reflect these two phenomena. Therefore, we set this value as a constant.
No Financial Segments
>
Financial structures are different in each health care organization. In order tobuild a concrete model to capture this, we need to build a complicated set of
loops. Because of the amount of work required to accomplish this model, we will