HAL Id: hal-00543302
https://hal.archives-ouvertes.fr/hal-00543302
Submitted on 6 Dec 2010
HAL is a multi-disciplinary open access
archive for the deposit and dissemination of
sci-entific research documents, whether they are
pub-lished or not. The documents may come from
teaching and research institutions in France or
abroad, or from public or private research centers.
L’archive ouverte pluridisciplinaire HAL, est
destinée au dépôt et à la diffusion de documents
scientifiques de niveau recherche, publiés ou non,
émanant des établissements d’enseignement et de
recherche français ou étrangers, des laboratoires
publics ou privés.
Graph-based multi-scale analysis of plates and rods in
human trabecular bone
Jerôme Dias, Sébastien Valette, Julien Dardenne, Rémy Prost, Françoise
Peyrin
To cite this version:
Jerôme Dias, Sébastien Valette, Julien Dardenne, Rémy Prost, Françoise Peyrin. Graph-based
multi-scale analysis of plates and rods in human trabecular bone. 2010 IEEE ICIP, Sep 2010, Hong Kong,
China. pp.2289-2292, �10.1109/ICIP.2010.5653464�. �hal-00543302�
GRAPH-BASED MULTI-SCALE ANALYSIS OF PLATES AND RODS IN HUMAN
TRABECULAR BONE
J´erˆome Dias
∗, S´ebastien Valette, Julien Dardenne, R´emy Prost, Franc¸oise Peyrin
CREATIS; CNRS UMR5220; Inserm U630; INSA-Lyon; Universit´e de Lyon, France
ABSTRACT
Trabecular bone is made of a complex network of plate and rod structures, the proportion of which evolves with age or disease. Thus the identification of trabecular plates and rods is important in understanding bone fragility. We propose a novel approach based on 3D multi-scale adjacency graph analysis of high resolution 3D tomographic images of bone structures. The purpose of this new method is to classify each voxel of the 3D images in two classes : plate and rod vox-els. We show that the use of a multi-scale framework is very efficient at detecting rods with different sizes. We present applications of our method to both synthetic images and ex-perimental bone synchrotron radiation micro-CT images.
Index Terms— trabecular bone, multi-scale, clustering
1. INTRODUCTION
Research in the field of bone disease makes extensive use of micro-CT to explore bone micro-architecture since micro-micro-CT is a non-destructive means to obtain very accurate 3D images of bone sam-ples. A number of quantitative three-dimensional morphometric pa-rameters [1, 2] can be extracted from such images. However bone micro-architecture is made of a complex network of trabeculae and its topological organization is also of interest. It is typically orga-nized as a mixture of plate and rod structures, the relative proportion of which evolves with age or disease. For instance, osteoporosis yields to a more rod-like structure. The SMI (Structure Model In-dex) which is supposed to vary between 0 (for plates) and 3 (for rods) has been introduced to quantify this organization. However, it is a global index, based on an ideal model of the structure involving the computation of the surface and its derivative [3].
To get more detailed information, local topological analysis methods have later been proposed, either based on skeleton [4, 5] or on medial axis transform [6]. These methods were exploited to obtain a decomposition of the structure in individual plates and rods which was correlated to biomechanical parameters [7, 8, 9]. These methods are based on skeletonization, which is a convenient tool to get simplified representations of 3D images preserving most topological information. In general 3D skeletons are not only union of curves, but are composed both of curves and medial surfaces. Intuitively, curves correspond to cylindrical parts within the object and medial surfaces to planar parts.
∗Currently PhD Student in CEA-LETI, MINATEC, Grenoble, France.
In sharp contrast with previous approaches, we propose a new method, to locally identify plates and rods, based on multiscale Ad-jacency Graph (AG). The first step is the segmentation of the bone regions (black in figure 1a) from the soft tissues background. The second step of the proposed algorithm is a clustering of the bone vox-els. We randomly distribute clusters inside the bone region and then optimize the clustering using a Centroidal Voronoi Diagram (CVD) approach [10]. The barycenter of each cell is used as a node, and an AG is constructed based on the adjacency between the clusters. Afterwards, we analyze the cycles in the AG to classify each edge as members of a rod or plate region. This approach is embedded into a multi-scale framework so as to reduce the algorithm sensitivity to different rods sizes. The efficiency of our approach is shown on ex-perimental bone trabecular structures acquired in synchrotron radia-tion micro-CT and compared to medial axis based method [6, 11].
2. DEFINITIONS
Here we give some definitions used in this paper. Let the entire domain made with voxels beΩ. We assume that Ω is the union of studying object domainΩO (In black figure 1a) and the external
domainΩE(In white figure 1a):
Ω = ΩO∪ ΩE (1)
For clarity purposes, we will explain our approach in two di-mensions. For a given image (resp. volume)Ω, we associate an AG obtained with a clustering ofΩO[10].
3. OUR APPROACH
Our novel approach is based on a clustering method and processes directly the bone voxelsΩO.
The first step consists in creating a clustering of the bone vox-els, by constructing an Approximated Centroidal Voronoi Diagram (ACVD method) inΩO. The second step consists in building the
corresponding AG of the generated clustering. The third step is an identification of edges on which no cycle of length 3 (a triangular loop) can be found. This step allows us to determine the rod-like edges on the AG. Finally, we compute an edge clustering which maps each voxel ofΩOto the nearest edge of the corresponding AG. This
step is used to create the final map describing rod-like and plate-like regions.
(a) (b) (c) (d) (e)
Fig. 1:
Our approach on 2D example : Input image (1a). We construct an
ACVDof the input object
ΩO(1b). The clustering is
used to generate the
AGand then detect edges rod-like (colored in red in 1c). Using the
AG, we construct the edge clustering(1d) which is finally used to identify voxels associated to rod-like edges (1e).
Figure 1 shows the main steps in our algorithm on a 2D example: the input image is shown in figure 1a. We construct an ACVD of the input objectΩOfigure 1b. With this clustering, the adjacency sites
of the ACVD are connected by edges to form the AG, figure 1c. Then we determine rod-like edges on the AG. Finally we identify voxels on rods figure 1e, by using the associated edge clustering figure 1d and rod-like edges (red colored in figure 1c).
3.1. Trabecular Bone Clustering
The first step of our approach, represented figure 1b, is the splitting of the input objectΩOinto different regions Ciby means of
cluster-ing, in spirit with CVD approaches, where each region is defined by a site ziwhich is also the barycenter of his associated cell Ci:
zi= R Cix.ρ(x)dx R Ciρ(x)dx (2) Where x is a point insideΩOand ρ(x) a given density function.
In this paper, we choose ρ(x) = 1 everywhere, for a uniform clus-tering. It is known that CVDs minimize the following energy term [10] : EV = n X i=1 X pjǫCi Z pj ρ(x)kx − zik 2 dx (3)
We minimize EV, i.e. we aim at maximizing the cells
com-pactness, in spirit with [10, 12]. Intuitively, this approach leads to the creation of compact clusters with similar size, hence providing a solution to the sphere packing problem.
3.2. Adjacency Graph Construction
The AG Construction consists in connecting neighbor cluster sites by an edge. In figure 1c, we show the AG associated to its clustering in figure 1b. The voxels outside the object to be analyzed do not contribute to the AG. The resulting graph is then a simplified repre-sentation of the object, suitable for a fast and efficient topological analysis.
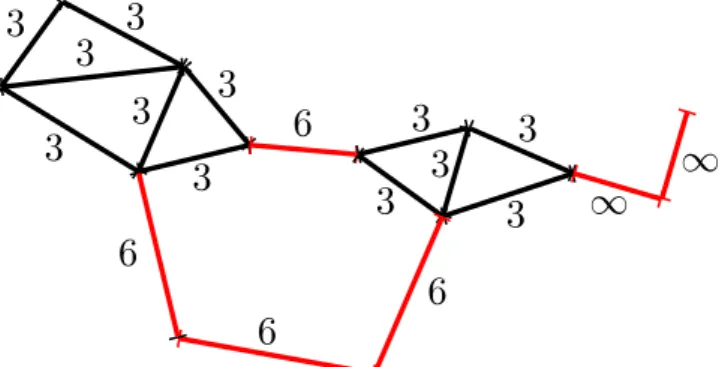
Fig. 2:
Our approach on 2D graph : each edge
eis given a
score
Seequal to the length of the shortest cycle containing
e.
Rod-like edges (for which
Se> 3) are colored in red.
3.3. Rod-like edges identification
The detection of rod-like regions depends on a rod-like edge identi-fication step performed on the corresponding AG. We consider that non-rod edges will be plate-like edges. We use an algorithm to find edges with high likelihood of being in a rod of the bone structure. Each edge e is given a score Seequal to the length of the shortest
cycle containing e. Note that for consistency reasons, when an edge e is not inside any cycle, we set Se= ∞. Afterwards, a given edge
e is classified as rod-like if Se>3, otherwise it is classified as
plate-like (fig 2). Finally, instead of computing all the cycles present in the AG which could be time consuming, we classify an edge as rod-like edge if its vertices endpoints v1 and v2have no common neighbor
vertex. This test is strictly equivalent to verifying that Se>3.
4. MULTI-SCALE ANALYSIS
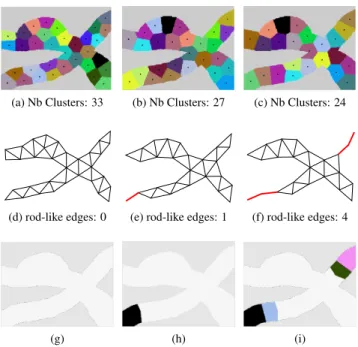
To perform our detection algorithm, one has to choose the number of regions created during the clustering. This number is very critical, as choosing a high number of clusters (little clusters size) will result in few detected rods, and a low number of clusters (large clusters size) will likely result in a lot of rods. To illustrate this problem, figure 3 shows the result of our approach on the same object, for different number of clusters. The chosen number of clusters are 33, 27 and 24: the resulting number of detected rod-like edges is respectively 0, 1 and 4. Then, instead of trying to determine the optimal
num-(a) Nb Clusters: 33 (b) Nb Clusters: 27 (c) Nb Clusters: 24
(d) rod-like edges: 0 (e) rod-like edges: 1 (f) rod-like edges: 4
(g) (h) (i)
Fig. 3:
MultiScale clustering on 2D example
ber of clusters, we choose to perform our algorithm in a multi-scale fashion. We first start with an arbitrary high number of clusters (typ-ically the number of voxels inΩEdivided by 50) and incrementally
decrease this number until the clusters size are larger than the maxi-mum rod size in bone structures, which is well documented (100 to 200 µm). The decrease is made by applying a fixed growing factor to the clusters size for each incremental step. This modification has two main advantages: we do not longer need to choose the number of clusters and we can detect small rod-like regions as well as large ones. The third row of figure 3 represent voxels associated to each rod-like edges, by using an edge clustering.
5. GEOMETRIC FILTER
Multi-scale analysis is a good means of avoiding to fix the number of clusters in our approach, but it brings an other problem: the chances of wrongly classifying a region as rod-like gradually increase with the clusters sizes. To overcome this difficulty, when an edge e is labeled as rod-like by the AG analysis algorithm, the related voxels should verify a geometrical criterion to be effectively classified as rod-like. For a given edge, we define the sphericity criterionΓeas:
Γe= 36 · π · Ve 2
Ae3
(4)
Where Veand Aeare respectively the estimated volume and area of
the region belonging to e [13]. Ve and Ae are estimated by
com-puting the inertia tensor of the set of voxels which closest edge is e. For a perfectly spherical region,Γe= 1. In all our experiments, we
discarded any edge for whichΓe<0.9.
6. RESULTS
We have tested our algorithm and the medial axis approach [6] with a synthetic volume composed of several plates and cylinders, and both algorithms gave similar good results.
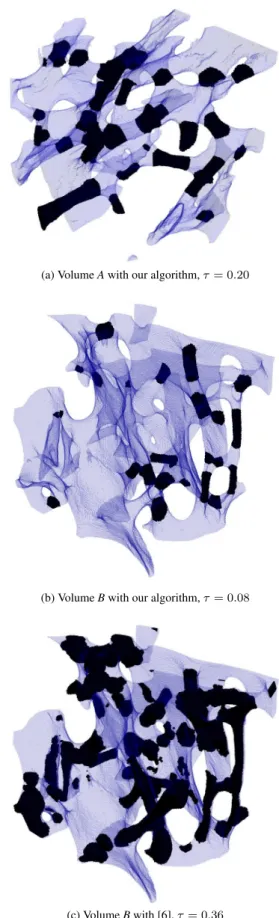
Figure 4 compares results obtained with our approach and with the medial axis approach [6, 11] on two 3D trabecular bone struc-tures (A and B) imaged by synchrotron radiation micro-CT with a voxel size equal to10µm. Due the high contrast and signal to noise ratio, bone was easily segmented from background by simple thresh-olding.
For each2003
voxels volume, the computation time for our al-gorithm is in order of several minutes, the vast majority being spent on computing clusterings. Detected rod-like regions are shown in black, while the remaining plate-like regions are transparent. For each volume, we have computed the rod/plate ratio τ= V r
V p, where V r and V p are respectively the plate-like and rod-like volumes. This criterion provides an efficient way of characterizing osteoporosis. Note that the computed ratio τ are consistent with respect to visual analysis. Effectively, the volume B contain more plates than rods elements, compare to the volume A, what explain its lower τ value. With our approach and the medial axis approach [6], we retrieve ef-ficiently the real τ value of different phantom composed of several plates and cylinders. But we can remark that the new classification obtained on figure 4b, which is based on regions is more regular than that obtained on figure 4c based on voxels [6].
7. CONCLUSION
We have proposed a novel approach to identify rods and plates in 3D micro-CT images of trabecular bone which alleviates conventional noise problems encountered with skeletonization. The multi-scale scheme introduced provides robustness to the method. Our algo-rithm is driven by only one parameter. Application to experimental bone micro-CT images shows that the method performs well. In fu-ture works, the method will be applied to a large data set of osteopor-toc and osteoarthrosic samples. The availability of this new method will open many further applications in the field of bone research for the understanding of bone fragility diseases.
Acknowledgements
This work was supported in part by the R´egion Rhˆone Alpes via both the Simed project of the ISLE research cluster and the cluster 11 HVN. This work is in the scope of the scientific topics of the PRC-GDR ISIS and STIC Sant´e research groups of the French National Center for Scientific Research (CNRS). Our implementation is based on the Visualization ToolKit (www.vtk.org).
8. REFERENCES
[1] T. Hilderbrand and P. R¨uegsegger, “A new method for the model-independent assessment of thickness in three-dimensional images,” Journal of microscopy, vol. 185, no. 1, pp. 67–75, 1997.
[2] E. Martin-Badosa, A. Elmoutaouakkil, S. Nuzzo, D. Aam-blard, L. Vico, and F. Peyrin, “A method for the automatic characterization of bone architecture in 3d mice microtomo-graphic images,” Computerized Medical Imaging and Graph-ics, vol. 27, no. 6, pp. 447–458, 2003.
[3] T. Hildebrand and P. R¨uegsigger, “Quantification of bone mi-croarchitecture with the structure model index,” Computer Methods in Biomechanics and Biomedical Engineering, vol. 1, no. 1, pp. 15 – 23, 1997.
[4] P.K. Saha, B.R. Gomberg, and F.W. Wehrli, “Three-dimensional digital topological characterization of cancellous bone architecture,” International Journal of Imaging Systems and Technology, vol. 11, no. 1, pp. 81–90, 2000.
[5] B.R. Gomberg, P.K. Saha, H.K. Song, S.N. Hwang, and F.W. Wehrli, “Topological analysis of trabecular bone mr images,” IEEE Transactions on Medical Imaging, vol. 19, no. 3, 2000. [6] A. Bonnassie, F. Peyrin, and D. Attali, “A new method for
analyzing local shape in three-dimensional images based on medial axis transformation,” IEEE Trans Sys Man Cyber, vol. 44, no. 4, pp. 700–705, 2003.
[7] M. Stauber and R. M¨uller, “Volumetric spatial decomposition of trabecular bone into rods and plates-a new method for local bone morphometry,” Bone, vol. 38, no. 4, pp. 475–484, April 2006.
[8] M. Stauber, L. Rapillard, G.H. Van Lenthe, P. Zysset, and R. Muller, “Importance of individual rods and plates in the assesment of bone quality and their contribution to bone stiff-ness,” J Bone Miner Res., vol. 21, no. 4, pp. 586–595, April 2006.
[9] X.S. Liu, P. Sajda, P.K. Saha, F.W. Wehrli, G. Bevill, T.M. Keaveny, and X.E. Guo, “Complete volumetric decomposition of individual trabecular plates and rods and its morphological correlations with anisotropic elastic moduli in human trabecu-lar bone,” J Bone Miner Res., vol. 23, no. 2, pp. 223–35, 2008. [10] S. Valette and J.M. Chassery, “Approximated centroidal voronoi diagrams for uniform polygonal mesh coarsening,” Computer Graphics Forum (Eurographics 2004 proceedings), vol. 23, no. 3, pp. 381–389, 2004.
[11] F. Peyrin, A Bonnassie, D. Attali, B. Brunet-Imbault, Chap-pard C., and C.L. Benhamou, “New geometric parameters for the description of three-dimensional bone structures from very high resolution microtomography images,” Med. Phys., , no. 7, in press 2010.
[12] J. Dardenne, S. Valette, N. Siauve, N. Burais, and R. Prost, “Variational tetrahedral mesh generation from discrete volume data,” The Visual Computer (proceedings of CGI 2009), vol. 25, no. 5, pp. 401–410, 2009.
[13] E. Parra-Denis, Analyse morphologique 3D de particules de forme complexe : Application aux interm´etalliques dans les al-liages d’aluminium, Ph.D. thesis, Universit´e de Saint-Etienne, 2007.
(a) Volume A with our algorithm, τ = 0.20
(b) Volume B with our algorithm, τ = 0.08
(c) Volume B with [6], τ = 0.36 Fig. 4: