Advance Access publication 9 January 2009
METABOLIC EFFECTS
Effect of a Small Dose of Alcohol on the Endurance Performance of Trained Cyclists
Virgile Lecoultre∗and Yves SchutzDepartment of Physiology, Faculty of Biology and Medicine, University of Lausanne, CH-1015 Lausanne, Switzerland
∗Corresponding author: Department of Physiology, Faculty of Biology and Medicine, University of Lausanne, CH-1015 Lausanne, Switzerland.
Tel:+41-21-692-55-70; Fax: +41-21-695-55-95; E-mail: [email protected]
(Received 28 August 2008; first review notified 17 November 2008; in revised form 19 November 2008; accepted 28 November 2008;
advance access publication 9 January 2009)
Abstract — Aim:The aim of this study was to investigate the effect of an acute small ethanol (EtOH) dose (0.5 ml EtOH/kg fat-free mass, combined with carbohydrate) in a drink on endurance performance of trained cyclists. Methods: Thirteen well-trained male cyclists took part in this study. A 60-min cycling endurance performance test (time trial) was performed in a calorimetric chamber after drinking an EtOH (30± 1.8 ml) or a non-EtOH control (C) drink. Results: Overall, EtOH induced a significant decrease in the average cycling power output (PO) (EtOH: 233± 23 W versus C: 243 ± 24 W, P < 0.01). The time course of mechanical PO showed an early decrease during the EtOH trial as compared to C (P < 0.01). Due to the lower PO, oxygen consumption, carbon dioxide production and glucose oxidation were significantly lower (P < 0.05) as compared to C. Relative to PO, heart rate response and ratings of perceived exertion (RPE) were increased by EtOH as compared to C (P < 0.05). In contrast, EtOH did not influence gross work efficiency, glycaemia and blood lactate concentration. Conclusions: These results show that the acute low dose of EtOH decreased endurance performance. An increase of cardio-vascular strain and psychobiological mechanisms may explain this decrease of endurance performance.
INTRODUCTION
Alcohol is often part of an everyday diet in western coun-tries, represents 0–10% of the average daily energy intake and is mainly absorbed as ethanol (EtOH). Although it is not a nutrient, EtOH provides energy (∼7 kcal/g) and has multiple effects on metabolic function (El-Sayed et al., 2005; Maughan, 2006; Shirreffs and Maughan, 2006). Even though athletes are generally advised to refrain from consuming EtOH (American College of Sports Medicine, 1982), dietary surveys show that EtOH contributes 0–5% to the total daily energy intake of ath-letes (Maughan and Burke, 2002) and that their average daily intake of EtOH is similar to that of the general population (Gutgesell and Timmerman, 1998; Burke and Maughan, 2000). Moreover, athletes may be at a higher risk of hazardous EtOH consumption (O’Brien et al., 2005), with binge drinking being linked to athletic participation (Gutgesell et al., 1996; Nelson and Wechsler, 2001). Although EtOH is considered to be dele-terious to endurance performance, anecdotal observations and some reports indicate that some athletes seldom consume EtOH prior to training sessions and/or competition (Maughan, 2006). EtOH may be deleterious to high intensity endurance performance through different mechanisms. First, even at low levels, EtOH impairs psychomotor skills such as reaction time, hand–eye coordination, accuracy, balance and complex skilled tasks (Williams, 1991; Burke and Maughan, 2000). Also, and perhaps more importantly for endurance performance, EtOH has been shown to influence CHO metabolism: it inhibits liver glucose output during exercise (Jorfeldt and Juhlin-Dannfelt, 1977; Juhlin-Dannfelt et al., 1977a; Kendrick
et al., 1993; Heikkonen et al., 1998) and decreases muscle
glucose uptake (Jorfeldt and Juhlin-Dannfelt, 1978). Muscle glycogen breakdown is also increased at rest and its pattern of utilization is modified during exercise according to the muscle-fibre-type composition (Juhlin-Dannfelt et al., 1977b). Moreover, it inhibits the uptake of gluconeogenic precursors
(i.e. lactate (Jorfeldt and Juhlin-Dannfelt, 1978) and glycerol (Lundquist et al., 1965)) by the liver, which subsequently decreases gluconeogenesis. In addition, it has been shown that EtOH increases cardio-vascular strain during exercise by increasing the heart rate (HR) (Borg et al., 1990; Ferreira et al., 2004) but without modification of stroke volume (Blomqvist
et al., 1970). Also, a decrease of skeletal muscle strength may
be observed after acute EtOH consumption (Williams, 1991) and can be attributed to an alteration of nerve conduction, a modulation of membrane excitability and an impairment of muscle membrane transporter function (Nicolas et al., 1998).
In contrast, EtOH may in fact exert a small positive effect on exercise performance by decreasing pain and anxiety, which would in turn be beneficial to performance (Williams, 1991). Although it has been shown that acute doses of EtOH do not influence ratings of perception of effort (RPE) during short submaximal incremental exercise (Borg et al., 1990), its effects the perceptual response during high intensity more prolonged endurance performance are not known.
It has been shown that acute EtOH consumption decreases middle-distance running (McNaughton and Preece, 1986) and endurance (Kendrick et al., 1993) performance. In contrast, other studies did not show any effect of EtOH on the perfor-mance of runners (Bond et al., 1983; Houmard et al., 1987).
In this context, the aim of this study was to investigate the effect of an acute low dose of EtOH on the endurance perfor-mance of trained cyclists during a 1-h time trial (TT). It was hy-pothesized that EtOH would decrease endurance performance.
METHODS
Subjects
Thirteen male endurance-trained cyclists gave their informed consent to participate in this study, which was approved by the Ethics Committee of the Faculty of Biology and Medicine of
C
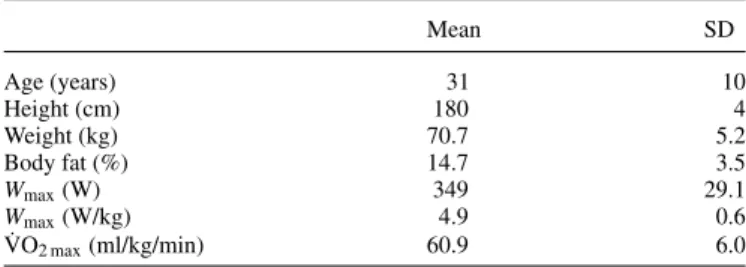
Table 1. Subjects’ characteristics Mean SD Age (years) 31 10 Height (cm) 180 4 Weight (kg) 70.7 5.2 Body fat (%) 14.7 3.5 Wmax(W) 349 29.1 Wmax(W/kg) 4.9 0.6 ˙ VO2 max(ml/kg/min) 60.9 6.0
Wmax: maximal aerobic work output; ˙VO2 max: maximal oxygen uptake.
the University of Lausanne (protocol no. 159/04). Their mean age, weight, height and maximal oxygen uptake ( ˙VO2 max) are
presented in Table 1. Subjects were irregular social alcohol drinkers or abstainers and had been involved in regular cycling training for at least 5–6 h per week for at least 3 years. The experimental sessions took place during the winter transition training season or the pre-competitive season. Subjects were fa-miliar with road and/or off-road cycle racing and high-intensity training.
Experimental design
The protocol consisted of four visits to the Department of Physiology. On the first visit, ˙VO2 max and maximal aerobic
power (Wmax) were measured using an incremental test
de-scribed below. The three subsequent visits were simulated TTs performed on a conventional road bike mounted on a magnetic resistance apparatus and which was equipped with a power measurement device. During each TT, subjects were asked to cycle as far as possible, or, in other words, to produce the high-est workload as possible in 60 min (Coyle et al., 1991; Bishop, 1997). All TTs were performed in a calorimetric chamber, in which room air temperature and humidity were controlled and maintained at 20◦C and 60%, respectively. Visit 2 was a fa-miliarization session to get accustomed to the cycling test and the general procedures. The experimental sessions (visits 3 and 4) were carried out in a semi-random order and in a bal-anced design. The exercise sessions were separated by∼7 days. Subjects ingested a solution containing either 0.5 ml of ethanol per kilogram of fat-free mass (FFM) and∼30 g of carbohydrate (CHO), or a control (C) solution of the same volume containing the same amount of CHO. The subjects were kept blind to the composition of the solution and were only asked after the last exercise session if they could distinguish the EtOH and C trials. For a given subject, all sessions occurred at the same time of the day and under standardized conditions when considering dietary intake and physical activity.
Visit 1
Subjects arrived at the lab 3–4 h after eating a light meal. They were asked to repeat the same meal before each sub-sequent visit. Subjects were asked to refrain from strenuous physical activity and from drinking alcohol and caffeine during the preceding 24 h. Height and weight were recorded, and body composition was estimated using a four-skinfold measurement technique. Immediately after, they performed the incremental test to determine Wmax and ˙VO2 max. The test was performed
on a cycle ergometer (Ergoline eBike, GE Medical Systems, Freiburg, Germany) equipped with the subjects’ own clipless
Fig. 1. Schematic representation of the experimental procedures. Following parameters were recorded at regular intervals, separated by 10 or 20 min: blood concentration of ethanol (EtOH), glucose (glc) and lactate (la). Oxygen consumption ( ˙VO2), carbon dioxide production ( ˙VCO2), heart rate (HR), power
and pedalling cadence (Cad) were recorded continuously. The greyed areas represent the experimental procedures performed in the calorimetric chamber.
pedals. Saddle and handlebar positions were individually ad-justed to the subjects’ preferences. The ˙VO2 max/Wmaxtest began
with a 5-min warm-up at an initial power of 95 W. Thereafter, power was increased by 35 W every 3 min until volitional ex-haustion. Wmaxwas determined as the last work rate completed
plus the fraction of time spent in the unfinished stage multiplied by the work rate increment. The HR was recorded continuously by an automated 12-way electrocardiogram (Corina, GE Med-ical Systems, Freiburg, Germany). Breath-by-breath gas ex-change measurements were recorded continuously during the test by an automated gas analysis system (Oxycon Pro, Jaeger, Hoechberg, Germany). The volume sensor was previously cal-ibrated with an integrated automated flow calibration system and gas analysers were calibrated using a gas mixture of known concentrations (16% O2, 5% CO2). Oxygen uptake ( ˙VO2) was
considered maximal when at least two of the following criteria were met: (a) a levelling off of ˙VO2with increasing workload
(i.e. an increase of <2 ml/min/kg); (b) a respiratory exchange ratio (RER) >1.05; (c) HR within 10 beats of the predicted maximal HR estimated by 220-age. ˙VO2 maxwas calculated as
the average oxygen uptake of the last 30 s of the stage eliciting the highest ˙VO2.
Visits 2–4
Subjects reported to the lab after a 3- to 4-h fast and having ab-stained from alcohol, caffeine and strenuous physical activity for 24 h. The experimental procedures are summarized in Fig. 1. Upon their arrival at the Department of Physiology, blood glu-cose was measured using a fingertip capillary blood sample (FreeStyle, TheraSense Inc., Alameda, CA, USA). Then, they were asked to drink within 3 min a refrigerated (4◦C) grapefruit juice solution containing 0.5 g CHO/kg of FFM and mixed with a commercially available ethanol-containing drink (Smirnoff Vodka 21, Smirnoff, Diageo, Switzerland) or the same volume of water. According to the manufacturer, the ethanol content of this drink was 40% vol. The amount of ingested EtOH was 0.5 ml/kg FFM, or 30± 1.8 ml. The CHO contained in the so-lution were glucose (40%), fructose (40%) and sucrose (20%). Subjects had to wear a nose clip and rinse their mouth with wa-ter afwa-ter ingestion in order to disguise the EtOH and C solution. Approximately one half of the subjects could distinguish both solutions, two inverted the treatments and the remainder were not able to distinguish them. Exactly 15 min after ingestion,
subjects seated on the bike (Cannondale SC800, Cannondale Bicycling Corp., Bethel, NJ, USA) fit to their own preferences (saddle and handlebar height and forward position) and placed on a stationary magnetic resistance apparatus (Tacx Swing, Tacx, The Netherlands). The magnetic resistance apparatus was set to the same position allowing subjects to choose gear ratios corresponding to their preferred pedalling cadence with a wide range of power outputs (PO) (i.e. 50–600 W). Immediately before cycling, the tire was inflated to 700 psi. At this mo-ment, the zero-power offset of the power measurement device (SRM ‘Professional’, Schoberer Rad Messtechnik, Welldorf, Germany) was set according to the manufacturer instructions and the handlebar unit of the SRM was set at a recording rate of 1 Hz. At this time, they warmed-up for 15 min at a light self-selected intensity. At the end of the warm-up period, the blood EtOH concentration was estimated in breath, by means of a portable breath analyser (Draeger 6510, Draeger Safety, Luebeck, Germany). At the same time, blood glucose and blood lactate concentrations (Accusport Lactate, Boeringer, Mannheim, Germany) in fingertip capillary blood were mea-sured. The TT simulation began immediately after the 15-min warm-up. At this time, the instruction was repeated: subjects were asked to produce the maximal average power in the given time (60 min) as previously described (Coyle et al., 1991; Bishop, 1997; Bishop et al., 1998). The procedure was slightly modified: the initial PO was not set during the first 8 min. How-ever, subjects were instructed to begin with the same gear ratio that was mainly used during the familiarization session. Dur-ing the TTs, the subjects were informed only of elapsed time by a countdown timer placed in front of them. HR, pedalling cadence, power and distance were hidden. During the entire session, water was available ad libitum.
Every 10 min, subjects were asked to rate their perceived exertion (RPE) according to the 6–20 Borg scale, and every 20 min, blood lactate and glucose concentrations in fingertip capillary blood samples were measured and blood EtOH in expired air was estimated.
At the end of the TTs, subjects performed a light active re-covery for 1 min, after which they rested in a seated position. After 15 min of passive recovery, blood glucose and lactate con-centrations were measured and the blood EtOH concentration was estimated.
The four TTs were performed in a calorimetric chamber, the characteristics of which have been previously published (Jequier and Schutz, 1983). The analysers of the chamber were calibrated with a gas of known concentrations. Minute ventila-tion was set at a rate of 110 l/min in order to maintain the CO2
concentration below 1%. ˙VO2and carbon dioxide production
( ˙VCO2) were continuously recorded and averaged over periods
of 15 min.
During all TTs, the same investigator remained in the calori-metric chamber close to the subject. During each trial, the investigator followed the same pattern of activity, remaining seated except for measurements of RPE, blood glucose, blood lactate and EtOH every 10 min. Furthermore, he did not interact with the subjects during the TTs.
To offset the effect of the investigator’s contribution to total ˙
VO2 and ˙VCO2, a pretest was performed with the
investiga-tor alone: ˙VO2and ˙VCO2were measured and averaged during
ten 15-min periods of a simulation of the investigators ac-tivity performed in the calorimetric chamber. These sessions
were carried out on a single day. Mean ˙VO2 and ˙VCO2 were
found to be 325± 43 and 271 ± 4 ml/min, respectively. These values were subsequently subtracted from the metabolic mea-surements obtained during the TTs. Considering the mean ˙VO2
and ˙VCO2 measured during the TTs, and considering a 10%
variability in the investigators’ ˙VO2and ˙VCO2, this would in
turn induce <1% variability in the subjects’ ˙VO2 and ˙VCO2,
which is lower than the accuracy of the indirect calorimeter used in the present study.
Calculations
From ˙VO2 (l/min) and ˙VCO2 (l/min) measures, glucose and
lipid oxidation rates (g/min) were calculated using the stoi-chiometric equations proposed by Frayn et al. (Frayn, 1983), with protein oxidation during exercise considered negligible. Thus, the following equations were used:
CHO oxidation (g/min): 4.55 ˙VCO2− 3.21 ˙VO2,
Lipid oxidation (g/min): 1.67 ˙VO2− 1.67 ˙VCO2.
When the RER equalled or was superior to 1.0 over a 15-min period, values of ˙VO2 and ˙VCO2 were not used for
the calculation of substrate oxidation.
Gross external cycling efficiency (GE) was calculated as the ratio between mechanical PO and metabolic energy expenditure (EE), as previously described (Moseley and Jeukendrup, 2001).
Statistical analysis
Data are reported as mean± standard deviation.
Performance and physiological parameters (mechanical power, pedalling cadence, HR) were averaged in six 10-min periods in order to evaluate the effect of time and condi-tion on these parameters and were then analysed by a two-way ANOVA with repeated measures. A Bonferroni post hoc test was applied when significant differences were found in means. Mean substrate oxidation rates over the TTs were com-pared using a Student’s paired t-test. Blood EtOH levels across time were compared using a one-way ANOVA. Statistical sig-nificance was set at P < 0.05. All calculations were per-formed using a computerized statistical software (SigmaStat for Windows, version 2.03, SPSS, Chicago, IL, USA).
RESULTS
Blood EtOH levels reached 0.18± 0.06‰ at the start of exer-cise (i.e. exactly 30 min after drinking the solution) and sub-sequently reached 0.20± 0.06, 0.18 ± 0.05, 0.16 ± 0.05 and 0.14± 0.04‰ after 20, 40 and 60 min of exercise and at the end of recovery, respectively. No significant difference was found throughout the test. Performance, assessed by the mean mechanical PO, was significantly lower under EtOH condition (233± 23 W) as compared to C (243 ± 24 W) (P < 0.01), repre-senting a decrease of 3.9% in performance over the EtOH trial. The mean ˙VO2were found to be 3640± 297 and 3513± 323
ml/min (P < 0.05) in C and EtOH, respectively. Accordingly, the mean ˙VCO2 were 3463± 305 and 3299 ± 393 ml/min
(P < 0.01). Therefore, subjects performed the TTs with an in-tensity corresponding to 83± 8 versus 80 ± 9% ˙VO2 maxin C
and EtOH, respectively (P < 0.05). The time course of PO was significantly different (time× condition) during the EtOH trial
Fig. 2. The time course of power output during the 60-min time trial after ingestion of ethanol (EtOH) or control (C). Open bars and black bars represent the C and EtOH trials, respectively.∗A significant difference (P < 0.05) with C; ‘a’ indicates a significant difference (P < 0.05) with the first 10-min period (0– 10) in EtOH; ‘b’ denotes a significant (P < 0.05) difference with 0–10 in C.
Fig. 3. The time course of the ratio between ratings of perceived exertion and work output (RPE/W) during the 60-min time trial after ingestion of ethanol (EtOH) or control (C). Open bars and black bars represent the C and EtOH trials, respectively.∗A significant difference (P < 0.05) with C; ‘a’ indicates a significant difference (P < 0.05) with the first 10-min period (0–10) in C; ‘b’
denotes a significant (P < 0.05) difference with 0–10 in EtOH.
(Fig. 2) and PO was significantly lower from the second 10-min period to the end (P < 0.05).
HR increased significantly over time from 158 bpm (end of the first 10-min period) and reached 171 bpm (last period). However, no significant difference was found between the two conditions. When normalized to the PO, the mean ratio between HR and PO was significantly higher during the EtOH trial (P < 0.05).
The mean RPE was not different between C and EtOH but increased significantly with time in both conditions from the fourth period of the TTs to the end (P < 0.01). No signifi-cant difference was found between conditions for RPE over time. However, the evolution of RPE normalized for work out-put (RPE/W) was significantly different during the EtOH trial compared to C: during the first three 10-min periods, RPE/W was significantly higher in EtOH as compared to C (P < 0.05) (Fig. 3).
Fig. 4. Evolution of the blood glucose concentration during both the control (C) and the ethanol (EtOH) trial.∗A significant difference with C (P < 0.05).
The mean blood glucose concentration was similar during both trials (5.1± 0.9 versus 4.8 ± 0.5 mmol/l in C and EtOH, respectively). However, a slight decrease was observed in the EtOH condition (Fig. 4) compared to C at 40 min of exercise and at the end of the recovery period (P < 0.05). Blood lactate concentrations were similar between conditions (5.1± 1.4 ver-sus 4.9± 1.1 mmol/l for C and EtOH, respectively) and over time.
Gross cycling efficiency was not different between both con-ditions (19.1± 1.1% versus 19.0 ± 1 in C and EtOH, respec-tively).
Glucose oxidation rate was significantly (P < 0.05) lower in the EtOH condition (3.1± 0.6 g/min (EtOH) versus 3.5 ± 0.5 g/ min (C)), whereas lipid oxidation rate tended to be greater (0.5± 0.1 g/min (EtOH) versus 0.4 ± 0.1 g/min (C)), although it did not reach statistical significance (P= 0.099).
DISCUSSION
Information on the effect of acute EtOH consumption on en-durance performance during cycling is almost non-existent, unlike running (McNaughton and Preece, 1986; Houmard
et al., 1987; Kendrick et al., 1993), although cycling and
run-ning can be compared in terms of intensity and duration of exercise and physiological requirements.
The results of the present study are consistent with a previous study (McNaughton and Preece, 1986) that showed a decrease in the performance of runners in short- and middle-distance events after ingestion of different EtOH doses, inducing blood alcohol concentrations similar to those measured in the present study. These running events were of a shorter duration (i.e. be-tween 11 s and 5 min) as compared with a 1-h TT, probably involving a larger contribution of the ‘anaerobic’ metabolism. Another study (Kendrick et al., 1993) reported a significant negative effect of EtOH on the ability of well-trained runners to complete a 60-min running event. Some variables associated with performance (i.e. blood glucose concentration, ˙VO2, HR)
were affected, but running performance was not measured. In contrast, other studies did not report any significant change in running performance after EtOH ingestion (Bond et al., 1983; Houmard et al., 1987), assessed by a TT protocol or an in-cremental test. The discrepancy between the different studies can be explained by the differences in the experimental designs
and the exercise duration, intensity and type of performance measured. Running may be considered as a complex motor skill, and the decrease in performance during running under EtOH influence may be partially attributed to the alteration of coordination skills (McNaughton and Preece, 1986). In con-trast, because cycling on an ergometer may not require high psychomotor or coordination skills, it seems reasonable that our results focus on the disturbances induced by EtOH on the metabolic aspects of performance. This is confirmed by the fact that our results show no difference in gross efficiency between the trials, which probably means that the coordination skills necessary to cycling ergometry were not altered after EtOH ingestion.
During the EtOH trial, time course of PO was significantly modified. A significant drop of PO occured after 20 minutes of exercise, whereas PO was maintained during the C trial at this time. Afterwards, PO was significantly decreased in both conditions as compared to the initial 10-min period but to a greater extent during the EtOH trial (P < 0.05). Overall, EtOH induced a 4% decrease in average PO. In terms of outdoor performance an early decrease of PO may lead to a greater decrease of TT performance, since pacing strategy is known to be an important factor for TT performance (Swain, 1997).
The early decrease of PO was not correlated to changes oc-curring in other metabolic parameters (i.e. blood glucose or lactate concentration) or the perceptual response (i.e. RPE). In fact, EtOH would induce psychobiological and/or metabolic effects that interfere with exercise performance but that were not measured in the present study. One explanation would be a cognitive effect of EtOH, inducing a misjudgement of the exercise capacity of the athletes, leading them to start exer-cise at a too high intensity. As a result, the athletes would fail to maintain the initial PO throughout the TTs. This may be linked with the comments of the subjects who generally reported a state of well-being at the beginning of the EtOH trials (per-sonal communication). However, in both conditions, subjects started the TT at the same PO, meaning that EtOH probably did not lead them to overestimate their endurance capacity but altered the metabolic aspects of endurance performance dis-cussed below.
Alcohol has previously been shown to induce an early ap-pearance of hypoglycaemia, through a decrease of the hepatic glucose production occurring within 1 h of light-to-moderate intensity exercise (Jorfeldt and Juhlin-Dannfelt, 1977, 1978; Juhlin-Dannfelt et al., 1977a; Kendrick et al., 1993). In con-trast, our results (Fig. 4) showed no differences in blood glucose concentrations throughout the trials. The small doses of EtOH used in our study and the small amount of CHOs contained in both the C and EtOH drink may explain the maintenance of euglycaemia throughout the TTs. As outlined by Jorfelt and Juhlin-Dannfelt (Jorfeldt and Juhlin-Dannfelt, 1978), the pre-requisite for an EtOH-induced hypoglycaemia during exer-cise would be a fasting state. In this study, our subjects per-formed the exercise several hours after eating their last meal, but not under fasting conditions. Moreover, since EtOH de-creases muscle glucose uptake during exercise (Juhlin-Dannfelt
et al., 1977a; Jorfeldt and Juhlin-Dannfelt, 1978), the
EtOH-induced decrease in hepatic glucose production may be counter-balanced by the former mechanism. Furthermore, Massicotte
et al. (1993) showed no effect of EtOH on endogenous
sub-strate oxidation during exercise. Taken together, this would
explain the maintenance of glycaemia throughout the trials. Our results also show that total CHO oxidation was signifi-cantly lower during EtOH than during C. Because POs were significantly lower during EtOH than during C, it is likely that the lower glucose oxidation during EtOH is the consequence of a lower exercise intensity and that CHO metabolism was not altered.
The mean blood lactate concentration during both trials was relatively high and above the so-called 4 mmol anaerobic threshold, confirming the high intensity at which the subjects performed the exercise trials. However, the values measured in this study are lower than those reported by Coyle et al. (1991) (i.e. 7.1–7.4 mmol/l) with elite cyclists. The higher relative intensity of exercise (86–90% ˙VO2 max) reported in the latter
study as compared to the present study may explain this differ-ence. In our experiment, the blood lactate concentrations were not different between conditions, although the exercise inten-sity was significantly lower during the EtOH condition. Under EtOH influence, lactate production and oxidation in both mus-cle and liver and its conversion into glucose by gluconeogenesis are modified (Jorfeldt and Dannfelt, 1977, 1978; Juhlin-Dannfelt et al., 1977a, 1977b). Although lactate fluxes were not measured in the present study, our results support previ-ous studies showing EtOH disturbances of lactate metabolism (Jorfeldt and Juhlin-Dannfelt, 1977, 1978; Juhlin-Dannfelt
et al., 1977a, 1977b).
Our results show no difference of mean HR and time course of HR during the trials between C and EtOH. Previ-ous studies showed that HR was elevated during exercise in response to EtOH ingestion, at least during submaximal exer-cise (Blomqvist et al., 1970; Juhlin-Dannfelt et al., 1977b; Borg
et al., 1990; Kendrick et al., 1993; Ferreira et al., 2004).
Dur-ing high-intensity exercise, however, HR was not influenced by EtOH (Blomqvist et al., 1970; Borg et al., 1990). In the present study, however, the ratio between HR and PO was increased by EtOH, which means that the HR response to a given ex-ercise intensity was elevated. As outlined by Blomqvist et al. (1970), the elevated HR response during exercise after EtOH ingestion may be due to a shift in blood flow towards other tis-sues, such as an increase of skin perfusion due to the cutaneous vasodilation effect of EtOH. In addition, this study reported no difference in stroke volume during exercise during an EtOH trial. It seems therefore that during high intensity but submax-imal exercise, EtOH increases cardio-vascular strain, which may account for the reduced performance measured in our study.
In contrast to previous work (Borg et al., 1990), the rela-tionship between RPE and exercise intensity was increased by EtOH. Considering that pacing strategy would partially depend on the actual RPE (Hampson et al., 2001), it is reasonable to postulate that the decrease of performance could be partly due to a change in the perception of effort and thus through a psy-chobiological mechanism. Interestingly, a recent study showed that a mouth rinse with glucose had a similar, but stimulat-ing, psychobiological effect on cycling performance (Carter
et al., 2004). Moreover, according to recent models of fatigue
during exercise, pacing strategy is regulated within the brain, which is directly influenced by peripheral feedbacks (Abbiss and Laursen, 2008). The elevated RPE response during the EtOH trial may have thus indirectly influenced pacing strategy and, as a consequence, performance.
In conclusion, acute consumption of EtOH decreased en-durance exercise performance as previously shown (American College of Sports Medicine, 1982; McNaughton and Preece, 1986; Kendrick et al., 1993). Its effects were not correlated with any modifications of the gross metabolic or physiologic variables measured in this study. Our results suggest that EtOH worsens cycling performance by a concomitant alteration of physiological and psychobiological mechanisms. In practice and as previously stated (American College of Sports Medicine, 1982), athletes should avoid drinking EtOH, even at low doses, before training sessions or competition.
Acknowledgements — This study was funded by the Swiss Foundation for Nutrition
Research.
REFERENCES
Abbiss CR, Laursen PB. (2008) Describing and understanding pac-ing strategies durpac-ing athletic competition. Sports Med 38:239– 52.
American College of Sports Medicine. (1982) Position stand: the use of alcohol in sports. Med Sci Sports Exerc 14:9–11.
Bishop D. (1997) Reliability of a 1-h endurance performance test in trained female cyclists. Med Sci Sports Exerc 29:554–9.
Bishop D, Jenkins DG, Mackinnon, LT. (1998) The relationship be-tween plasma lactate parameters, Wpeak and 1-h cycling perfor-mance in women. Med Sci Sports Exerc 30:1270–5.
Blomqvist G, Saltin B, Mitchell JH. (1970) Acute effects of ethanol ingestion on the response to submaximal and maximal exercise in man. Circulation 42:463–70.
Bond V, Franks BD, Howley ET. (1983) Effects of small and mod-erate doses of alcohol on submaximal cardiorespiratory function, perceived exertion and endurance performance in abstainers and moderate drinkers. J Sports Med Phys Fitness 23:221–8.
Borg G, Domserius M, and Kaijser L. (1990) Effect of alcohol on perceived exertion in relation to heart rate and blood lactate. Eur J Appl Physiol Occup Physiol 60: 382–4.
Burke LM, Maughan RJ. (2000) Alcohol in sport. In Maughan RJ (ed). Nutrition in Sport. Oxford: Blackwell, 405–14.
Carter JM, Jeukendrup AE, Jones DA. (2004) The effect of carbo-hydrate mouth rinse on 1-h cycle time trial performance. Med Sci Sports Exerc 36:2107–11.
Coyle EF, Feltner ME, Kautz SA et al. (1991) Physiological and biomechanical factors associated with elite endurance cycling per-formance. Med Sci Sports Exerc 23:93–107.
El-Sayed MS, Ali N, El-Sayed Ali Z. (2005) Interaction between al-cohol and exercise: physiological and haematological implications. Sports Med 35:257–69.
Ferreira SE, de Mello MT, Rossi MV et al. (2004) Does an energy drink modify the effects of alcohol in a maximal effort test? Alcohol Clin Exp Res 28:1408–12.
Frayn KN. (1983) Calculation of substrate oxidation rates in vivo from gaseous exchange. J Appl Physiol 55:628–34.
Gutgesell ME, Timmerman M, Keller A. (1996) Reported alcohol use and behavior in long-distance runners. Med Sci Sports Exerc
28:1063–70.
Gutgesell ME, Timmerman MG. (1998) Alcohol use and behaviors in women long-distance race participants reporting a history of bulimia and/or anorexia nervosa. J Sports Med Phys Fitness 38:142–8. Hampson DB, St Clair Gibson A, Lambert MI et al. (2001) The
influ-ence of sensory cues on the perception of exertion during exercise and central regulation of exercise performance. Sports Med 31:935– 52.
Heikkonen E, Ylikahri R, Roine R et al. (1998) Effect of alcohol on exercise-induced changes in serum glucose and serum free fatty acids. Alcohol Clin Exp Res 22:437–43.
Houmard JA, Langenfeld ME, Wiley RL et al. (1987) Effects of the acute ingestion of small amounts of alcohol upon 5-mile run times. J Sports Med Phys Fitness 27:253–7.
Jequier E, Schutz Y. (1983) Long-term measurements of energy ex-penditure in humans using a respiration chamber. Am J Clin Nutr
38:989–98.
Jorfeldt L, Juhlin-Dannfelt A. (1977) The influence of ethanol on human splanchnic and skeletal muscle metabolism during exercise. Scand J Clin Lab Invest 37:609–18.
Jorfeldt L, Juhlin-Dannfelt A. (1978) The influence of ethanol on splanchnic and skeletal muscle metabolism in man. Metabolism
27:97–106.
Juhlin-Dannfelt A, Ahlborg G, Hagenfeldt L et al. (1977a) In-fluence of ethanol on splanchnic and skeletal muscle substrate turnover during prolonged exercise in man. Am J Physiol 233:E195– 202.
Juhlin-Dannfelt A, Jorfeldt L, Hagenfeldt L et al. (1977b) Influence of ethanol on non-esterified fatty acid and carbohydrate metabolism during exercise in man. Clin Sci Mol Med 53:205–14.
Kendrick ZV, Affrime MB, Lowenthal DT. (1993) Effect of ethanol on metabolic responses to treadmill running in well-trained men. J Clin Pharmacol 33:136–9.
Lundquist F, Tygstrup N, Winkler K et al. (1965) Glycerol metabolism in the human liver: inhibition by ethanol. Science 150:616–7. Massicotte D, Provencher S, Adopo E et al. (1993) Oxidation of
ethanol at rest and during prolonged exercise in men. J Appl Physiol
75:329–33.
Maughan RJ. (2006) Alcohol and football. J Sports Sci 24:741–8. Maughan RJ, Burke LM. (2002) Alcohol and sport. In Maughan RJ,
Burke, LM (eds). Sports Nutrition. Malden: Blackwell, 64–70. McNaughton L, Preece D. (1986) Alcohol and its effects on sprint and
middle distance running. Br J Sports Med 20:56–9.
Moseley L, Jeukendrup AE. (2001) The reliability of cycling effi-ciency. Med Sci Sports Exerc 33:621–7.
Nelson TF, Wechsler H. (2001) Alcohol and college athletes. Med Sci Sports Exerc 33:43–7.
Nicolas JM, Antunez E, Thomas AP et al. (1998) Ethanol acutely decreases calcium transients in cultured human myotubes. Alcohol Clin Exp Res 22:1086–92.
O’Brien KS, Blackie JM, Hunter JA. (2005) Hazardous drinking in elite New Zealand sportspeople. Alcohol Alcohol 40:239–41. Shirreffs SM, Maughan RJ. (2006) The effect of alcohol on athletic
performance. Curr Sports Med Rep 5:192–6.
Swain DP. (1997) A model for optimizing cycling performance by varying power on hills and in wind. Med Sci Sports Exerc 29:1104– 8.
Williams MH. (1991) Alcohol, marijuana and beta blockers. In Lamb DR, Williams MH (eds). Perspectives in Exercise Science and Sports Medicine, Vol. 4: Ergogenics—Enhancement of Performance in Exercise and Sport, Carmel: Cooper Publishing Group, 331– 69.