HAL Id: hal-02351930
https://hal.archives-ouvertes.fr/hal-02351930
Submitted on 6 Nov 2019
HAL is a multi-disciplinary open access
archive for the deposit and dissemination of
sci-entific research documents, whether they are
pub-lished or not. The documents may come from
teaching and research institutions in France or
abroad, or from public or private research centers.
L’archive ouverte pluridisciplinaire HAL, est
destinée au dépôt et à la diffusion de documents
scientifiques de niveau recherche, publiés ou non,
émanant des établissements d’enseignement et de
recherche français ou étrangers, des laboratoires
publics ou privés.
Impact of non-uniform wettability in the condensation
and condensationliquid water intrusion regimes in the
cathode gas diffusion layer of proton exchange
membrane fuel cell
Pierre Carrere, Marc Prat
To cite this version:
Pierre Carrere, Marc Prat.
Impact of non-uniform wettability in the condensation and
con-densationliquid water intrusion regimes in the cathode gas diffusion layer of proton exchange
membrane fuel cell.
International Journal of Thermal Sciences, Elsevier, 2019, 145, pp.0.
OATAO is an open access repository that collects the work of Toulouse
researchers and makes it freely available over the web where possible
Any correspondence concerning this service should be sent
to the repository administrator:
tech-oatao@listes-diff.inp-toulouse.fr
This is an author’s version published in: http://oatao.univ-toulouse.fr/24639
To cite this version:
Carrere, Pierre
and Prat, Marc
Impact of non-uniform wettability in the
condensation and condensationliquid water intrusion regimes in the cathode
gas diffusion layer of proton exchange membrane fuel cell. (2019)
International Journal of Thermal Sciences, 145. ISSN 1290-0729
Official URL :
https://doi.org/10.1016/j.ijthermalsci.2019.106045
Impact of non-uniform wettability in the condensation and
condensation-liquid water intrusion regimes in the cathode gas di
ffusion layer of proton
exchange membrane fuel cell
Pierre Carrère
a, Marc Prat
a,*aInstitut de Mécanique des Fluides de Toulouse (IMFT), Université de Toulouse, CNRS, Toulouse, France
A B S T R A C T
The impact of variations in the wettability properties of the gas diffusion layer substrate on the liquid water distribution and the reactant gas access is studied from pore network simulations considering two main cases: a degradation case where the fraction of hydrophilic pores increases and a case where the spatial distribution of the hydrophobic agent is non-uniform with hydrophobic surfaces and a central region of mixed wettability. Contrary to previous works, this impact is assessed for various regimes of liquid water occurrence. The latter notably include the condensation regime and the mixed regime where the occurrence of liquid water in the gas diffusion layer results from both condensation under the rib and the ingress of liquid water from the catalyst layer or the microporous layer. The study shows that the wettability variation impact is highly dependent on the regime, i.e. on the operating conditions. Whereas this impact is minor when the conditions correspond to the occurrence of the pure condensation regime where the liquid water is confined in the region below the rib, it can be quite significant in the mixed regime when the conditions are such that liquid water is present also in the region below the channel.
1. Introduction
Water management and performance degradation are two major issues for the improvement of Proton exchange membrane (PEM) fuel cells [1]. In this context, the gas diffusion layer (GDL) is a key com-ponent as regards the gas access to the catalyst layer and the removal of the water produced as the result of the electrochemical reaction [2]. GDLs are typically composed of two distinct layers, a substrate of gra-phitized carbonfibers and a micro porous layer (MPL) coated onto one side. In this paper, we are interested in the substrate. Thus, GDL in what follows only refers to the substrate. Without treatment, the graphitized carbonfibres are hydrophilic with a static contact angle on the order of 80° [3]. GDLs are generally rendered hydrophobic by applying a polytetrafluoroethylene (PTFE) coating. The most commonly used technology [4,5] is to perform the coating by GDL immersion in an emulsion containing the hydrophobic agent, drying, and sintering at 350 °C. The contact angle on a PTFEflat surface is expected to be on the order of 110° [6]. However, it is difficult to obtain a homogeneous coating and it has been reported that the content in PTFE was often greater near the surfaces than in the interior of the GDL [7,8]. However, this depends on the drying conditions and more uniform distributions
are also possible [8,9]. It was reported in Ref. [10] that a more uniform distribution leads to better performance. In addition, loss of PTFE during mechanical compression cycles [11–13] or due to other de-gradation mechanisms [14–17] modifies the PTFE distribution and the GDL wettability properties. For this reason, the GDL is often considered as a system of mixed wettability rather than a purely hydrophobic fi-brous medium with various possible distributions of the hydrophilic and hydrophobic pores within the GDL pore space.
Various numerical studies have been developed in order to explore the impact of GDL wettability on the water transfer. In Ref. [6], it was shown that liquid water injected slowly at the inlet of a hydrophobic porous layer leads to capillaryfingering whereas a compact invasion pattern is obtained when the medium is hydrophilic. Capillaryfingering leaves many pores free of liquid and thus is more favourable for maintaining a good gas access whereas a compact regime is much more detrimental in this respect. The case of a mixed wettability wasfirst explored in Ref. [18]. The existence of an optimum hydrophilic fraction for the reduction of the mass transport losses was highlighted. The impact of the fraction of hydrophilic elements on the capillary pressure curves, relative permeability and effective diffusion coefficient was studied in Ref. [19]. It was shown that the impact is significant only for
*
Corresponding author.
E-mail address:mprat@imft.fr(M. Prat).
https://doi.org/10.1016/j.ijthermalsci.2019.106045
fractions of hydrophilic pores greater than a critical value corre-sponding to the percolation threshold of the network. Using data from Ref. [19], the impact of the hydrophobicity loss on the PEMFC per-formance was then studied in Ref. [20] in relation with the performance loss observed during long-term tests. The boundary condition used in these works was questioned in Ref. [21] where it was argued that considering multiple independent injection points is more re-presentative of the in-situ situation. The consideration of this type of boundary condition together with mixed wettability conditions in Ref. [22] also leads to the existence of a critical value in the fraction of hydrophilic elements above which the impact of the loss of hydro-phobicity is significant. The presence of rib and channel at the GDL outlet, an important feature of the in-situ situation, was considered in Ref. [23]. Here also, it was shown that increasing the fraction of hy-drophilic pores was not necessarily a problem provided that this frac-tion is sufficiently low. Whereas previous works consider situafrac-tion where the fraction of hydrophilic pores is distributed randomly, the case where this fraction is less in the central region of the GDL com-pared to the regions adjacent to the GDL inlet and outlet surfaces was also explored in Ref. [23]. All these numerical studies were based on pore network models (PNM). A few studies considering GDL of mixed wettability are based on direct simulations such as LBM simulations [24,25]. The focus in Ref. [24] was on the removal of a single droplet due to the gas flow induced in the GDL when the channels are
interdigitated, a quite particular configuration different from the ones considered in the previous studies. In Ref. [25], the focus was on the impact of PTFE distributions on the relative permeabilities and not on the in-situ situation. Another direct simulation technique, the volume of fluid (VOF) method, has also been used [26]. See also [27,28] for other applications of this method to the study of transport phenomena in GDL. In the latter work, the focus was to study the impact of PTFE distribution on the capillary pressure curve and thus it is not again the in-situ situation but an ex-situ configuration which was considered.
Although all these works are interesting, it must be noted that several recent works, i.e. [29–33] and references therein, have em-phasized the importance of liquid-vapour phase change phenomena, i.e. evaporation and condensation, on the liquid water occurrence and distribution in the GDL in an operating PEMFC (in-situ situation). The liquid–vapour phase change phenomena are completely ignored in the above-mentioned numerical works [18–27]. Since the water distribu-tion can actually be markedly different from the one considered in previous works, the impact of the mixed wettability must be explored in relation with the various regimes of porefilling.
In Refs. [33,34], two main liquid water formation regimes are identified depending on the relative humidity in the channel and the operating temperature. Thefirst regime is observed for sufficiently high temperature and in particular for temperatures close to the standard operating temperature (~80 °C). It is referred to as the pure List of variables
a cubic pore network lattice spacing [m] deq equivalent diameter [m]
dt// diameter of throats in the in-plane direction [m] ⊥
dt diameter of throats in the through-plane direction [m]
f fraction of hydrophilic elements [−] Hch channel depth [m]
i current density [A/cm2] Lch channel width [m]
Lr rib width [m]
Ly length of the computational domain in the y direction [m]
Nneighbours number of adjacent hydrophilic elements containing
li-quid water
Q water molarflux [mol/s/m2] −
qtot dry total molarflow rate in a dry GDL [mol/s]
−
qtot wet total molarflow rate in a wet GDL [mol/s]
RHch reactant gas relative humidity in the channel [−]
Tbp bipolar plate temperature [°C]
x reactant gas molar fraction [−] α density of injection points [−]
δc GDL thickness in the compressed region [m]
δuc GDL thickness in the uncompressed region [m]
ϕ invasion potential [−]
Φ heatflux [W]
τ ratio betweenqtot wet− andqtot dry− [−]
2. Pore network model 2.1. Pore network structure
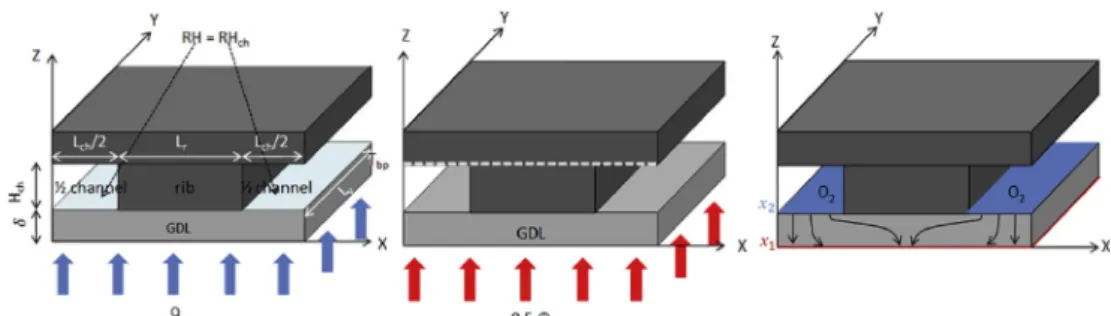
As sketched inFig. 2, PNM simulations are performed over a GDL unit cell located between the catalyst layer or MPL on one side (referred to as the inlet) and two half gas channels separated by a central rib on the other side (referred to as the outlet). Periodic boundary conditions are applied on the lateral sides of the unit cell. For the simulations conducted in this study, the rib width isLr = 960 μmand the channel
half-width isLch/2 = 480 μm. The length of the computational domain
in the y direction is Ly= 800μm. The GDL thickness is =δc 200 μmand
the channel depth Hch= 480 μm. Those values are representative of
real fuel cells [36]. One can also refer to Ref. [30] for detailed in-formation on how the properties of the network have been specified in relation with GDL properties reported in the literature. A 3D cubic pore network of cubic pores and throats of square cross-section is numeri-cally generated to represent the GDL unit cell. The lattice spacing a, which is the distance between two neighbour pores of the network, is the same in each direction witha = 40μm. This leads to represent the GDL unit cell by a 48 × 20 x 5 pore network. The throat sizes are randomly chosen in the range d[ t//,min, dt//,max] for in-plane aligned throats and[dt⊥,min,dt⊥,max]for through-plane aligned throats so as to
take into account the GDL anisotropy. Then, the fact that the GDL under the half channels is less compressed than under the central rib is taken into account. To this end, the throat sizes in the in-plane directions are increased by a factor δuc/δc in the uncompressed region, whereδucis
the thickness of the uncompressed GDL under the channel and δcis the
thickness of the compressed GDL under the rib. Finally, the pore sizes arefirst set equal to the biggest size among the adjacent throats. Then the pore sizes are uniformly modified so as to obtain the desired por-osity. The properties of the pore network generated for the present study are given inTable 1.
2.2. PNM algorithm
The following phenomena are taken into account: heat transfer, water vapour diffusion, liquid-vapour phase change, capillary con-trolled liquid displacement. The main features of the model can be listed as follows (one can refer to Refs. [33,34] for the details):
•
A fraction of the heat produced by the electrochemical reaction in the cathode catalyst layer is transferred toward the cathode GDL. For simplicity this fraction is constant and equal to half of the produced heat (0.5Φ). The bipolar plate temperatureTbpis imposedas sketched inFig. 2.
•
The molarflux of water Q entering at the GDL inlet is a fraction of the water produced by the electrochemical reaction Qtot withQ = 0.8Qtot. The relative humidity RHchof the reactant gas in the
channel is imposed as sketched inFig. 2.
•
If the computed local relative humidity in an element (pore or throat) is equal or greater than one, condensation happens,Fig. 2. Sketch of the GDL unit cell and schematics of water (left), heat (middle) and reactant gas (right) transfer problems.
condensation regime because pore filling by liquid water result only from the condensation of the water vapour entering the GDL at the inlet (the inlet corresponds to the interface between the MPL and the GDL or between the catalyst layer and the GDL in the absence of MPL). The second regime is referred to as the mixed liquid-vapour injection regime because the occupancy of the GDL pores by liquid water results from both the water entering the GDL in liquid phase and from the con-densation of the water vapour in the GDL. It is typically expected when the relatively humidity is very high in the channels. For sufficiently low operating temperatures, this regime is however close to the ones con-sidered in many previous works, i.e. water mainly enters in liquid form from the GDL inlet. The approximation, implicitly made in many pre-vious works, is to ignore the transfer in vapour phase and the possible pore filling by condensation. Since the regime corresponding to this approximation has been considered in many previous works, it is also considered in what follows. It is referred to as the regime of pure liquid injection without phase change, or simply the pure liquid injection regime. These three regimes are sketched in Fig. 1.
Since the effect of mixed wettability on phase distribution and gas access has not been investigated for the regimes where the liquid – vapour phase change phenomena are important, the objective of the paper is to fill this gap. Although somewhat less interesting since it is not representative of the standard operating temperatures, we also consider for comparison the pure liquid injection regime, which again was the only regime considered in all the above-mentioned numerical works [18–26] on the impact of the mixed wettability. In other words, simulations are performed for the three regimes sketched in Fig. 1. Regarding the distribution of hydrophilic and hydrophobic pores, we consider two main configurations based on the review of the literature presented above: 1) the configuration where the GDL is perfectly hy-drophobic initially and then becomes more and more hydrophilic, 2) the configuration where the distribution of hydrophobic pores is not uniform with hydrophobic pores near the surfaces and a fraction of hydrophilic pores in the interior of the GDL. Situation #1 is expected to be representative of degradation processes (progressive loss of hydro-phobicity) whereas situation #2 would correspond to the situation where the hydrophobic treatment leads to a non-uniform distribution of PTFE (PTFE near the surfaces and much less in the interior of the GDL).
The simulation tool is a wet-mixed PNM. It is based on the pore network model detailed in Ref. [33] with the correction regarding the heat transfer modelling discussed in Ref. [34]. However, the GDL considered in Refs. [33,34] was fully hydrophobic. For the present study, the model has been extended so as consider GDL of mixed wettability as well as fully hydrophobic or fully hydrophilic GDL. This model is summarized in the next section. Two main indicators are considered to measure the impact of the wettability variations. The first one is the saturation (over the whole network or over through-plane slices). As discussed in Ref. [35], the global saturation is, however, not sufficient to characterize the gas access. For this reason, we also com-pute, as second indicator, the diffusive flow rate of O2 through the GDL.
neglecting any kinetically based delay.
•
Depending on the operating conditions water can be injected at the inlet in both liquid and vapour phases. When there is liquid injec-tion, the liquid injection points are randomly chosen over the GDL inlet. The density of injection pointsαis a parameter of the model (see below).•
The liquid water displacement is controlled by capillary effect. A new feature of the model compared to Refs. [33,34] is that a fraction of the pores and throats can be hydrophobic whereas the com-plementary fraction is hydrophilic (only hydrophobic elements are considered in Refs. [33,34]). This has an impact on the local inva-sion rules as described below.2.3. Liquid water invasion rules
In hydrophobic regions, the classical invasion percolation rules [37] apply, i.e. the invasion is simply controlled by the sizes of the element. Asfirst shown in Ref. [38], the situation is more involved in hydrophilic regions where the invasion of a pore depends on the number of adjacent hydrophilic elements alreadyfilled by the liquid. This aspect can be taken into account by defining the invasion potential of each element (pore or throat) appropriately [22,39]. Accordingly, the rules for liquid water invasion are the following. Elements containing liquid water and linked together form a liquid cluster. A new element can be added to a liquid cluster only if all its elements are already fullyfilled with water. If it is not the case, the liquid water flow rate is evenly distributed between the non-alreadyfilled elements of the cluster. Only one new element at the periphery of the cluster can be invaded at a time. The element to be invaded is the neighbouring empty element of minimum invasion potential. The invasion potential ϕ is defined as follow for a hydrophilic pore [22,39]: = − + − ϕ a θ N d 2 cos( )[1 0.25( neighbours 1)] eq (1)
whereais the lattice spacing of the network, θ is the contact angle of the element,deqis the equivalent diameter of the element and Nneighbours
is the number of hydrophilic adjacent elements already containing water. The invasion potential is defined as follow for a hydrophilic throat or a hydrophobic element (pore or throat):
=−
ϕ θ
d
2acos( )
eq (2)
For the cubic poresdeqis equal to the width of the cube and for the
square cross-section throatsdeqis equal to the side length of the square
cross-section.
2.4. Wettability distributions
The wettability isfixed via the fraction of hydrophilic elements in the network. The parameter is denoted by f . Pores and throats have the same probability to be hydrophilic. The contact angle of a hydrophobic element is 110° while the value for a hydrophilic element is 80°. Such a wet-mixed pore network for f = 20% is represented inFig. 3a for the case where the position of the hydrophilic elements is randomly chosen. The case where only the central layers of the GDL are wet-mixed is illustrated inFig. 3b. In what follows, the latter situation is referred to as the non-uniform distribution of f whereas the situation illustrated in Fig. 3a is referred to as the random distribution of f .
In the case of the random distribution of f , the hydrophilic elements are randomly chosen among all the elements of the network and there are as many hydrophilic pores as hydrophilic throats in each direction. Five different wettability distributions are generated. The throat sizes are also randomly allocated. This introduces a second source of ran-domness. Five different throat size spatial allocations are generated. By combining the randomness in the locations of the hydrophilic pores and throats and the randomness in the throat sizes, each regime (see below) is simulated for 25 different realisations of the network. A given spatial distribution of throat and pore sizes is referred to as a geometrical realisation of the network whereas a given spatial distribution of hy-drophilic elements is referred to as a wettability realisation. A realisa-tion combining the two sources of randomness is referred to as a rea-lisation of the network. Simulations are performed for 6 different values of f , namely 0%, 20%, 40%, 60%, 80% and 100%.
In the case of the non-uniform distribution of f (Fig. 3b), a perfect hydrophobic treatment is imposed in the rows of elements adjacent to the GDL inlet and the outlet respectively (as illustrated inFig. 3b) and an imperfect treatment in the three rows in the middle where f is varied. Thus f characterizes the fraction of hydrophilic elements in the central region of the GDL for this configuration. There are five layers of pores in the through-plane direction in the network. The central region is thus made of the three internal layers.
2.5. Liquid water porefilling regimes
As mentioned in the introduction, three different pore (and throat) filling regimes are distinguished, namely the pure liquid invasion re-gime, the pure condensation regime and the mixed regime. The oper-ating conditions corresponding to these three regimes in our simula-tions are given inTable 2.
For the regimes with liquid water injection at the inlet, namely the mixed regime and the pure liquid invasion regime, the density of liquid injection pointsαmust be specified. All the simulations were performed forα=20%which is a reasonable value according to a previous study [33].
Table 1
Pore network geometrical properties. Subscripts //and┴ are for in-plane and through-plane properties, respectively. Subscript c and uc correspond to compressed (below the rib) and uncompressed (below the channel), respectively.
a[μm] dt//, min[μm] dt//, max[μm] dt ,min⊥ [μm] dt ,min⊥ [μm] δuc[μm] δc[μm]
40 10 18 14 22 230 200
Fig. 3. The two wettability configurations: a) random configuration: wet-mixed pore network with randomly distributed hydrophilic and hydrophobic elements (f = 20%), b) non-uniform configuration: pore network with wet-mixed central layers ( =f 20%), up and bottom layers only contain hydrophobic elements (hydrophilic elements in red and hydrophobic ones in grey). (For interpretation of the references to colour in thisfigure legend, the reader is referred to the Web version of this article.)
2.6. Gas access indicators
As mentioned in the introduction, the impact of the mixed wett-ability is assessed from the computation of the saturation (overall sa-turation and in–plane sasa-turation profiles) and also from the computa-tion of the oxygen diffusive molar flow rate in the gas phase through the GDL so as to characterize the impact of the liquid water presence on the reactant gas transport. This problem is solved using a pore network approach [40]. The O2molar fraction is set to x1at the catalyst layer
interface, x2 at the channel interface (with x2>x1) and a zero flux
condition is imposed at the rib interface together with spatially periodic conditions in the in-plane directions at the lateral boundaries of the computational domain. The problem is sketched in Fig. 2. From the numerical solution of this problem, the total molarflow rateqtot wet− of
O2crossing the GDL inlet for a given pore network and a given liquid
water distribution is computed. Then the ratio = − − τ q q tot wet tot dry (3)
where qtot dry− is the molar flow rate of O2 when the GDL is dry is
computed.τ is calculated for all the performed simulations. τ can be seen as a saturation dependent tortuosity coefficient.
3. Impact of the wettability spatial variations 3.1. Liquid water distribution patterns
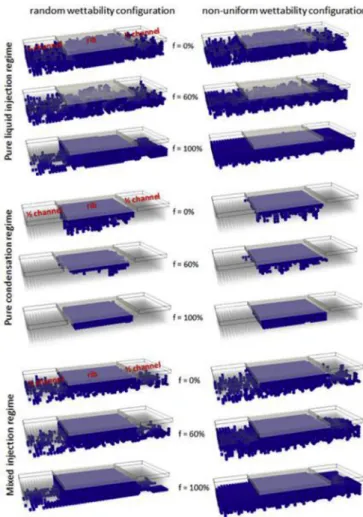
Typical liquid distribution patterns for the three regimes, the two wettability configurations and three values of f are depicted inFig. 4. As can be seen, the pure condensation regime leads to markedly dif-ferent patterns whatever the wettability conditions or configurations compared to the two other regimes. In the pure condensation regime, the liquid water is confined in the region of the GDL below the rib and the regions below the half-channels are free of liquid water. This has important consequence on the gas access as discussed later in the paper. Fig. 4also illustrates the impact of f on the liquid clusters. Capillary fingers are visible for intermediate and low values of f whereas the liquid water clusters are more compact when f is sufficiently high, i.e. when the network is sufficiently hydrophilic. This is typical con-sequence of cooperative phenomena between adjacent menisci in hy-drophilic pores, e.g. Refs. [6,18]. In addition, the anisotropy of the network favours the development of capillary fingers in the through-plane directions in hydrophobic regions and the in-through-plane invasion in hydrophilic ones. Interestingly, one can also notice differences between the two wettability configurations (Fig. 3). Compare for instance the patterns for the various regimes when f=100% (fully hydrophilic network in the case of the random configuration and fully hydrophilic central layers in the case of the non-uniform configuration).
For all regimes, there is clearly more liquid water in the GDL for the non-uniform wettability configuration than for the random wettability configuration. In the former, the fully hydrophobic layer of pores connected to the outlet acts as a capillary barrier. Combined with the preferential invasion in the in-plane directions in the hydrophilic re-gions and the fact that the layer of pores connected to the outlet is also fully hydrophobic, this leads to theflooding of the central region.
Also, regarding the comparison between the mixed regime and the
pure liquid injection regime, it is interesting to note that the capillary fingers are less developed in the through-plane directions in the mixed regime (as exemplified by the patterns for =f 0%). This is because of the evaporation taking place at the tip of the liquidfingers in the mixed regime, a phenomenon which is not considered in the simulation of the pure liquid injection regime.
3.2. Saturations
The variation of the overall saturation S with the fraction of hy-drophilic elements f for the various regimes and the two wettability configurations are depicted inFig. 5. Consistently with the patterns depicted inFig. 4, S is significantly lower in the pure condensation regime. Also, it can be noted that S is lower in the mixed regime compared to the pure liquid regime when f is sufficiently low. This is a consequence of the evaporation as discussed in relation with the pat-terns. By contrast, the values of S are comparable for sufficiently high values of f . The comparison between the random and non-uniform wettability configurations for the mixed and pure liquid injection re-gimes when f is sufficiently high confirms that more liquid is present with the non-uniform configuration. As discussed previously, this is due to theflooding of the central region in the non-uniform configuration. Both for the pure liquid invasion regime and the pure condensation regime, it can be seen that there exists an optimal range of f (~60–80%) minimizing the overall saturation. This clearly suggests that some loss of hydrophobicity is not necessarily detrimental and can Regime Operating conditions
Tbp[°C] i [A/cm2] RHch[%] Pure liquid injection with no phase change – – – Pure condensation 80 0.75 100
Mixed 40 0.5 100
Fig. 4. Typical liquid water (in blue) distributions forf=60%,f=100%for the three regimes and the two wettability configurations. (For interpretation of the references to colour in thisfigure legend, the reader is referred to the Web version of this article.)
Table 2
even be beneficial. In the case of the pure condensation regime, the presence of hydrophilic in-plane elements leads to the formation of more compact liquid clusters in the top layers of the network reaching the condensation–evaporation equilibrium before invading the lowest layers of pores of the network near the inlet. This is illustrated by the liquid water distributions shown in Fig. 4 for f=0%, f=60% and
=
f 100%. In other words, the presence of hydrophilic elements in the GDL helps reducing the global water saturation of the GDL in this re-gime as a result of the formation of more compact liquid clusters.
The case of the mixed regime is somewhat different. The impact of f is weak forf≤40%. For greater values, the saturation increases with f . Thus, there is no well-marked range of f minimizing S contrary to the two other regimes. This regime is characterized by the development of both liquid clusters originating from the inlet and condensation clusters developing below the rib with some merging in the region below the rib between the two types of cluster. This should explain why there is no clear optimum contrary to the pure liquid injection regime.
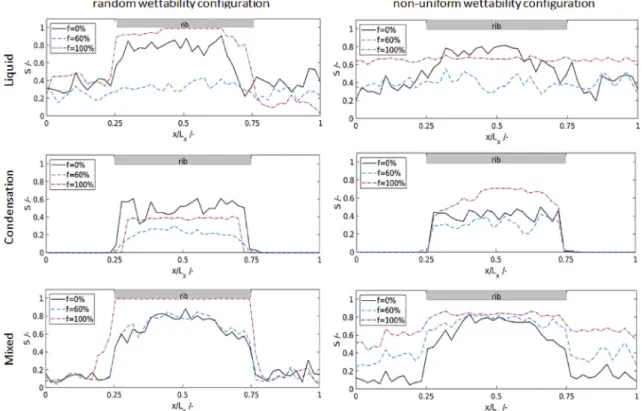
The impact of regimes and wettability configurations on the liquid
water is also illustrated inFig. 6showing saturation profiles in the in-plane direction. Each point on these profiles corresponds to the sa-turation in a vertical slice of thickness a along a direction parallel to the half-channels. The impact of the wettability configuration is well illu-strated by the comparison of the profiles for =f 100% in the mixed regime. The saturation is 100% below the rib in the random con fig-uration whereas the hydrophobic layer along the inlet prevents from reaching such a high value in the non-uniform configuration. The im-pact of the fully hydrophobic top and bottom layers in this con figura-tion is also visible in the mixed and pure liquid injecfigura-tion regimes in the regions below the two half-channels. For both regimes, the saturation in these regions is significantly higher than for the random configuration. In the pure liquid invasion regime, there is more liquid water in the region below the rib than in the regions below the half-channels when the network is purely hydrophobic ( =f 0%) or purely hydrophilic ( =f 100%) (as in the two other regimes) whereas the liquid water is much more evenly distributed when f is in the range minimizing the overall saturation ( =f 60% inFig. 5), at least for the wettability random
Fig. 5. Liquid water overall saturation S in the GDL for different fraction of hydrophilic elements f and the 25 different network realisations. Each circle corresponds to a given wettability realisation and a given geometrical realisation.
configuration. With the non-uniform wettability configuration, the li-quid water is still evenly distributed even for f=100%. To a lesser extent, this is also observed in the mixed regime.
3.3. Reactant gas access
For a given geometrical realisation, the variation of τ with the fraction of hydrophilic elements f is depicted inFig. 7. As it could have been inferred from the results on the liquid saturation and the patterns, the pure condensation regime is the one leading to the best reactant gas access. The difference with the two other regimes is quite significant sinceτ is actually quite close to one in the condensation regime for both wettability configurations whatever the value of f . This means that the total molarflow rateqtot wet− through a wet GDL is quite close to the total
molarflow rate through a dry GDL in this regime. In relation with the patterns shown inFig. 4, this highlights the fact that the presence of liquid water only in the region below the rib does not affect sig-nificantly the diffusive transport of reactant gas. This can be explained by the fact that the reactant gas poorly diffuses in this region even when the GDL is dry owing to the longer diffusion path compared to the
straight paths in the regions below the half-channels. In other words, the reactant gas transport predominantly occurs in the regions of the GDL below the channels and much less in the region below the rib. The significant lower values of τ for the two other regimes is thus a con-sequence of the liquid water presence in the regions below the two half channels in these two regimes.
Another striking observation is the impact of the wettability con-figuration as regards the pure liquid injection and mixed regimes. In the random configuration, the gas access is improved when f increases in the pure liquid injection regime. The impact is significant since there is about a factor 2 between the lower values ofτ (f ~20%) and the greater values ( f ~80%). As can be seen fromFigs. 5 and 7, the variation ofτ with f is well correlated with the variation of the overall liquid water saturation. When the saturation increases with f , thenτ decreases with
f and conversely. However, it can be seen thatτ is higher for =f 100% than forf=0% while the overall saturations are close (Fig. 5). This is fully consistent with the impact of f on the pattern depicted inFig. 4. Thus, the loss of hydrophobicity for this regime and this wettability configuration is globally more beneficial than detrimental. The con-clusion is exactly opposite for this regime with the non-uniform
Fig. 6. Typical in-plane liquid water saturation profiles for three different values of the fraction of hydrophilic elements =f 0% (solid black line),f=60%(dashed blue line) andf=100% (dash-dot redline). (For interpretation of the references to colour in thisfigure legend, the reader is referred to the Web version of this article.)
Fig. 7. Variation ofτ with the fraction of hydrophilic elements f for a given geome-trical realisation and both wettability con-figurations.
4. Conclusions
The impact of the wettability properties of the GDL substrate was studied from pore network simulations. Two situations were con-sidered. Thefirst situation is characterized by changes in the wettability properties at the pore scale occurring randomly everywhere within the GDL. This situation might mimic the progressive loss of hydrophobicity of the GDL during the PEMFC operation. In the second situation, the GDL is perfectly hydrophobic near the surfaces but can contain hy-drophilic elements in the interior. This case mimics the situation where the hydrophobic treatment is imperfect with a good PFTE coating in the vicinity of the GDL surfaces and a less good or poor PTFE coating inside the GDL. Then, the main novelty was to distinguish three main oper-ating regimes. These regimes depend on the operoper-ating conditions, namely on the current density, operating temperature and relative humidity in the channels. The mixed regime and the pure condensation regime are however the most interesting since there are the most re-presentative of an operating fuel cell [33].
Afirst major result is that the impact of the wettability variations on the gas transport through the GDL is highly regime dependent. This is so because the liquid water distribution is markedly different depending on the regime. The liquid water is found only in the region below the rib in the pure condensation regime whereas it is present both in the region below the rib and in the region below the channel in the pure liquid injection regime and the mixed regime. The fact that the region below the channel is free of liquid water in the pure condensation regime allows maintaining a quite good gas access through the GDL.
As in some previous works (where it is recalled that only the pure liquid injection regime was considered), it is often found that increasing the fraction of hydrophilic elements is not necessarily detrimental. On the contrary, this can improve the gas access. This is due to the fact that increasing the fraction of hydrophilic elements leads to more compact liquid clusters and also favours some in-plane invasions owing to the anisotropy of the GDL pore network. This is also an indication that considering the wettability properties of the GDL as an optimisation tool for improving the fuel cell performances can be a good idea, e.g. Refs. [41,42]. However, the present study makes clear that this possi-bility is also regime dependent. For the operating conditions leading to the pure condensation regime, no significant improvement should be expected.
The second major result is the impact of the wettability con figura-tion (random loss of hydrophobicity everywhere or only in the interior of the GDL) for the pure liquid injection and mixed regimes. The gas access can be greatly affected when the fraction of hydrophilic pores is sufficiently high in the non-uniform configuration whereas increasing the fraction of hydrophilic elements has little impact (mixed regime) or even improve the reactant gas access (pure liquid injection regime) in the random configuration. For the wettability non-uniform configura-tion, our results suggest that only moderate defects in the PTFE coating can be tolerated in the interior of the GDL. If too many pores are not hydrophobic, then the performance of the fuel cell should be sig-nificantly affected for these two operating regimes. In other words, our study strongly suggests that a uniform wettability distribution must be sought, unless the condensation regime is the only expected regime in the considered application.
The study might also help understand why the wettability properties
have sometimes a significant impact on the PEMFC performance and sometimes no noticeable impact in tests since the impact depends on the prevailing operating regime and on the initial distribution of PTFE within the GDL.
Acknowledgements
This research was supported by the Project“PEMFC – SUDOE” – SOE1/P1/E0293 which is co-financed by the European Regional Development Fund in the framework of the Interreg Sudoe programme. Appendix A. Supplementary data
Supplementary data to this article can be found online athttps:// doi.org/10.1016/j.ijthermalsci.2019.106045.
References
[1] Y. Wang, K.S. Chen, J. Mishler, S.C. Cho, X.C. Adroher, A review of polymer elec-trolyte membrane fuel cells: technology, applications, and needs on fundamental research, Appl. Energy 88 (4) (2011) 981https://doi.org/10.1016/j.apenergy. 2010.09.030.
[2] Y. Wang, K.S. Chen, S.C. Cho, PEM Fuel Cells: Thermal and Water Management Fundamentals, Momentum Press, 2013,https://doi.org/10.5643/9781606502471. [3] D.L. Wood, C. Rulison, R.L. Borup, Surface properties of PEMFC gas diffusion layers,
J. Electrochem. Soc. 157 (2) (2010) 195https://doi.org/10.1149/1.3261850. [4] L. Giorgi, E. Antolini, A. Pozio, E. Passalacqua, Influence of the PTFE content in the
diffusion layer of low-Pt loading electrodes for polymer electrolyte fuel cells, Electrochim, Acta 43 (24) (1998) 3675https://doi.org/10.1016/S0013-4686(98) 00125-X.
[5] G.G. Park, Y.J. Sohn, T.H. Yang, Y.G. Yoon, W.Y. Lee, C.S. Kim, Effect of PTFE contents in the gas diffusion media on the performance of PEMFC, J. Power Sources 131 (1) (2004) 182https://doi.org/10.1016/j.jpowsour.2003.12.037.
[6] O. Chapuis, M. Prat, M. Quintard, E. Chane-Kane, O. Guillot, N. Mayer, Two-phase flow and evaporation in model fibrous media: application to the gas diffusion layer of PEM fuel cells, J. Power Sources 178 (2008) 258https://doi.org/10.1016/j. jpowsour.2007.12.011.
[7] A. Rofaiel, J.S. Ellis, P.R. Challa, A. Bazylak, Heterogeneous through-plane dis-tributions of polytetrafluoroethylene in polymer electrolyte membrane fuel cell gas diffusion layers, J. Power Sources 201 (2012) 219https://doi.org/10.1016/j. jpowsour.2011.11.005.
[8] H. Ito, K. Abe, M. Ishida, A. Nakano, T. Maeda, T. Munakata, H. Nakajima, T. Kitahara, Effect of through-plane distribution of polytetrafluoroethylene in carbon paper on in-plane gas permeability, J. Power Sources 248 (2014) 822 https://doi.org/10.1016/j.jpowsour.2013.10.009.
[9] G. Inoue, N. Ishibe, Y. Matsukuma, M. Minemoto, Understanding mechanism of PTFE distribution infibrous porous media, ECS Trans 50 (2) (2013) 461https://doi. org/10.1149/05002.0461ecst.
[10] H. Ito, T. Iwamura, S. Someya, T. Munakata, A. Nakano, Y. Heo, M. Ishida, H. Nakajima, T. Kitahara, Effect of through-plane polytetrafluoroethylene dis-tribution in gas diffusion layers on performance of proton exchange membrane fuel cells, J. Power Sources 306 (2016) 289https://doi.org/10.1016/j.jpowsour.2015. 12.020.
[11] D. Qiu, H. Janßen, L. Peng, P. Irmscher, X. Lai, W. Lehnert, Electrical resistance and microstructure of typical gas diffusion layers for proton exchange membrane fuel cell under compression, Appl. Energy 231 (2018) 127https://doi.org/10.1016/j. apenergy.2018.09.117.
[12] A. Bazylak, D. Sinton, Z.S. Liu, N. Djilali, Effect of compression on liquid water transport and microstructure of PEMFC gas diffusion layers, J. Power Sources 163 (2) (2007) 784https://doi.org/10.1016/j.jpowsour.2006.09.045.
[13] V. Radhakrishnan, P. Haridoss, Effect of cyclic compression on structure and properties of a Gas Diffusion Layer used in PEM fuel cells, Int. J. Hydrogen Energy 35 (20) (2010) 11107https://doi.org/10.1016/j.ijhydene.2010.07.009. [14] J. Wu, J.J. Martin, F.P. Orfino, H. Wang, C. Legzdins, X.Z. Yuan, C. Sun, In situ
accelerated degradation of gas diffusion layer in proton exchange membrane fuel cell Part I: effect of elevated temperature and flow rate, J. Power Sources 195 (7) (2010) 1888https://doi.org/10.1016/j.jpowsour.2009.10.022.
[15] S.G. Kandlikar, M.L. Garofalo, Z. Lu, Water management in A PEMFC: water transport mechanism and material degradation in gas diffusion layers, Fuel Cells 11 (6) (2011) 814https://doi.org/10.1002/fuce.201000172.
[16] S. Yu, X. Li, J. Li, S. Liu, W. Lu, Z. Shao, B. Yi, Study on hydrophobicity degradation of gas diffusion layer in proton exchange membrane fuel cells, Energy Convers. Manag. 76 (2013) 301https://doi.org/10.1016/j.enconman.2013.07.034. [17] J. Park, H. Oh, T. Ha, Y.I. Lee, K. Min, A review of the gas diffusion layer in proton
exchange membrane fuel cells: durability and degradation, Appl. Energy 155 (2015) 866https://doi.org/10.1016/j.apenergy.2015.06.068.
[18] P.K. Sinha, C.Y. Wang, Liquid water transport in a mixed-wet gas diffusion layer of a polymer electrolyte fuel cell, Chem. Eng. Sci. 63 (4) (2008) 1081https://doi.org/ 10.1016/j.ces.2007.11.007.
[19] S.P. Kuttanikkad, M. Prat, J. Pauchet, Pore-network simulations of two-phaseflow wettability configuration. This is a consequence of the flooding of the
central region in this case which severely limits the gas access when f is sufficiently high. Although the impact of f in the random wettability configuration is less clear for the mixed regime, the conclusion re-garding the impact of the wettability configuration for this regime is somewhat similar since again the reactant gas access is severely af-fected when f is sufficiently high in the non-uniform wettability con-figuration. This highlights the fact that the impact of the wettability variations can be subtle.
in a thin porous layer of mixed wettability: application to water transport in gas diffusion layers of proton exchange membrane fuel cells, J. Power Sources 196 (3) (2011) 1145https://doi.org/10.1016/j.jpowsour.2010.09.029.
[20] J. Pauchet, M. Prat, P. Schott, S.P. Kuttanikkad, Performance loss of proton ex-change membrane fuel cell due to hydrophobicity loss in gas diffusion layer: ana-lysis by multiscale approach combining pore network and performance modelling, Int. J. Hydrogen Energy 37 (2) (2012) 1628https://doi.org/10.1016/j.ijhydene. 2011.09.127.
[21] L. Ceballos, M. Prat, Invasion percolation with inlet multiple injections and the water management problem in proton exchange membrane fuel cells, J. Power Sources 195 (3) (2010) 825https://doi.org/10.1016/j.jpowsour.2009.08.029. [22] L. Ceballos, M. Prat, Slow invasion of afluid from multiple inlet sources in a thin
porous layer: influence of trapping and wettability, Phys. Rev. E Stat. Nonlin. Soft Matter Phys. 87 (4) (2013) 43005https://doi.org/10.1103/PhysRevE.87.043005. [23] R. Wu, Q. Liao, X. Zhu, H. Wang, Impacts of the mixed wettability on liquid water
and reactant gas transport through the gas diffusion layer of proton exchange membrane fuel cells, Int. J. Heat Mass Transf. 55 (9) (2012) 2581https://doi.org/ 10.1016/j.ijheatmasstransfer.2012.01.002.
[24] G.R. Molaeimanesh, M.H. Akbari, Impact of PTFE distribution on the removal of liquid water from a PEMFC electrode by lattice Boltzmann method, Int. J. Hydrogen Energy 39 (16) (2014) 8401https://doi.org/10.1016/j.ijhydene.2014.03.089. [25] W. Chen, F. Jiang, Impact of PTFE content and distribution on liquid–gas flow in
PEMFC carbon paper gas distribution layer: 3D lattice Boltzmann simulations, Int. J. Hydrogen Energy 41 (20) (2016) 8550https://doi.org/10.1016/j.ijhydene.2016. 02.159.
[26] Z. Niu, Z. Bao, J. Wu, Y. Wang, K. Jiao, Two-phaseflow in the mixed-wettability gas diffusion layer of proton exchange membrane fuel cells, Appl. Energy 232 (2018) 443https://doi.org/10.1016/j.apenergy.2018.09.209.
[27] Z. Niu, Y. Wang, K. Jiao, Z.J. Wu, Two-phaseflow dynamics in the gas diffusion layer of proton exchange membrane fuel cells: volume offluid modeling and comparison with experiment, J. Electrochem. Soc. 165 (9) (2018) F613–F620 https//doi.org/10.1149/2.0261809jes.
[28] Z. Niu, J. Wu, Y. Wang, K. Jiao, Investigating the in-/through-plane effective dif-fusivities of dry and partially-saturated gas diffusion layers, J. Electrochem. Soc. 165 (11) (2018) F986–F993https://doi.org/10.1149/2.1191811jes.
[29] B. Straubhaar, J. Pauchet, M. Prat, Water transport in gas diffusion layer of a polymer electrolyte fuel cell in the presence of a temperature gradient. Phase change effect, Int. J. Hydrogen Energy 40 (35) (2015) 11668https://doi.org/10. 1016/j.ijhydene.2015.04.027.
[30] B. Straubhaar, J. Pauchet, M. Prat, Pore network modelling of condensation in gas diffusion layers of proton exchange membrane fuel cells, Int. J. Heat Mass Transf. 102 (2016) 891https://doi.org/10.1016/j.ijheatmasstransfer.2016.06.078.
[31] N. Belgacem, M. Prat, J. Pauchet, Coupled continuum and condensation–evapora-tion pore network model of the cathode in polymer-electrolyte fuel cell, Int. J. Hydrogen Energy 42 (12) (2017) 8150https://doi.org/10.1016/j.ijhydene.2017. 01.184.
[32] M. Aghighi, J. Gostick, Pore network modeling of phase change in PEM fuel cell fibrous cathode, J. Appl. Electrochem. 47 (12) (2017) 1323https://doi.org/10. 1007/s10800-017-1126-6.
[33] P. Carrere, M. Prat, Liquid water in cathode gas diffusion layers of PEM fuel cells: identification of various pore filling regimes from pore network simulations, Int. J. Heat Mass Transf 129 (2019) 1043https://doi.org/10.1016/j.ijheatmasstransfer. 2018.10.004.
[34] P. Carrere, M. Prat, Corrigendum to“Liquid water in cathode Gas Diffusion Layers of PEM fuel cells: identification of various pore filling regimes from pore network simulations”, Int.J. Heat Mass Transfer 129 (2019) 1043–1056.
[35] P.A. García-Salaberri, G. Hwang, M. Vera, A.Z. Weber, J.T. Gostick, Effective dif-fusivity in partially-saturated carbon-fiber gas diffusion layers: effect of through-plane saturation distribution, Int. J. Heat Mass Transf 86 (2015) 319https://doi. org/10.1016/j.ijheatmasstransfer.2015.02.073.
[36] S. Park, J.-W. Lee, B.N. Popov, A review of gas diffusion layer in PEM fuel cells: materials and designs, Int. J. of Hydrogen Energy 37 (Issue 7) (2012) 5850–5865 https://doi.org/10.1016/j.ijhydene.2011.12.148.
[37] D. Wilkinson, J.F. Willemsen, Invasion percolation: a new form of percolation theory, J. Phys. Math. Gen. 16 (14) (1983) 3365 https://doi.org/10.1088/0305-4470/16/14/028.
[38] R. Lenormand, C. Zarcone, Role of roughness and edges during imbibition in square capillaries, SPE Annual Technical Conference and Exhibition, 1984https://doi.org/ 10.2118/13264-MS.
[39] V. Mani, K. Mohanty, Effect of pore-space spatial correlations on two-phase flow in porous media, J. Pet. Sci. Eng. 23 (3,4) (1999) 173 https://doi.org/10.1016/S0920-4105(99)00015-7.
[40] J.T. Gostick, M.A. Ioannidis, M.W. Fowler, M.D. Pritzker, Pore network modeling of fibrous gas diffusion layers for polymer electrolyte membrane fuel cells, J. Power Sources 173 (2007) 277https://doi.org/10.1016/j.jpowsour.2007.04.059. [41] A. Forner-Cuenca, J. Biesdorf, V. Manzi-Orezzoli, L. Gubler, T.J. Schmidt, P. Boillat,
Advanced water management in PEFCs: diffusion layers with patterned wettability III. Operando characterization with neutron imaging, J. Electrochem. Soc. 163 (13) (2016) 1389https://doi.org/10.1149/2.0891613jes.
[42] J. Dujc, A. Forner-Cuenca, P. Marmet, M. Cochet, R. Vetter, J.O. Schumacher, P. Boillat, Modeling the effects of using gas diffusion layers with patterned wett-ability for advanced water management in proton exchange membrane fuel cells, J. Electrochem. Energy Convers. Storage 15 (2) (2018) 21001https://doi.org/10. 1115/1.4038626.