Buyouts as Resiliency Planning in New York City
After Hurricane Sandy
by
Sonja K. Boet-Whitaker B.A. in Urban Studies Brown University, 2011
Submitted to the Department of Urban Studies and Planning in Partial Fulfillment of the Requirements for the Degree of
MASTER IN CITY PLANNING at the
MASSACHUSETTS INSTITUTE OF TECHNOLOGY JUNE 2017
@ 2017 Sonja K. Boet-Whitaker. All rights reserved.
The author hereby grants to MIT permission to reproduce and to distribute publicly paper and electronic copies of this thesis document in whole or in part in any medium now
known or hereafter created.
Signature of Author:
-Signature
redacted
Sonja K. Boet-Whitaker Department of Urban Studies and Planning May 24, 2017 Certified by: xx Accepted by: !MASSACHUSETTS INSTITTF OF TECHNOLOGY
JUN 14 2011
Signature redacted
1 Lawr nce Susskind Ford Professor of Urban and Environm tal Planning Thesis Supervisor
Signature redacted
LU=
V P. Christopher Zegras
Associate Professor of Urban Studies and Planning Chair, Master in City Planning Committee
Buyouts as Resiliency Planning in New York City
After Hurricane Sandy
by
Sonja K. Boet-Whitaker
Submitted to the Department of Urban Studies and Planning on June 24, 2017 in Partial Fulfillment of the Requirements for the Degree of Master in City Planning
ABSTRACT
Land buyout programs may be used to significantly improve climate resilience by creating a protective ecological buffer area to protect land at high risk of flooding. This thesis assesses the success of the New York State land buyout on the East Shore of Staten Island in achieving this resilient outcome. The New York State buyout program was created after Hurricane Sandy in October 2012 in response to pressure from
landowners who had been flooded in the storm. New York City declined to participate in a buyout in response to Sandy but offered to acquire storm-damaged homes in other areas where the New York State buyout was not offered. Through the New York City program, acquired properties would be resold to private entities at auction. In contrast, the New York State program, which purchased 37 acres of land within the 100-year floodplain, was legally bound to hold the properties bought through their program as open space in perpetuity. The state was able to promise former residents that their land would become a buffer for inland areas, increasing resilience along this vulnerable coastline. I analyze the success of the state program in achieving this goal by assessing participation and attrition rates within designated buyout areas, as well as reasons for attrition. I find that the lack of coordinated goals and agreed-upon tools prevented New York Rising from successfully achieving the highest measure of resilience: creating a coastal buffer area to protect residents from sea level rise and future flooding.
Thesis Supervisor: Lawrence Susskind
Buyouts as Resiliency Planning in New York City
After Hurricane Sandy
Sonja Boet-Whitaker
Acknowledgements
A project like this was always going to be a challenge for me. This year, it was set against
a background of real political turmoil, as well as a good share of personal struggle with health and with loss. That there is a complete product at all is thanks to the patience of my advisor, Larry Susskind, the enthusiasm of my reader, Gabriella Carolini, and the support of my family, friends, family who are also friends, and, most importantly, my partner, Ezra Fischer.
Thanks also to my classmate Dennis Harvey, who discovered the hidden data that made this analysis possible.
Acronyms
BMP CDBG-DR CMP DCP DEP DPR FEMA FIRMs FMV GOSR HCR HPD HUD IPCC LDGMA NACCS NFIP NPCC NYC NYS ORR pFIRMs SIRR USACEBest Management Practices
Community Development Block Grant -Disaster Recovery
Coastal Management Plan
New York City Department of City Planning
New York City Department of Environmental Protection
(also "Parks") New York City Department of Parks and Recreation Federal Emergency Management Agency
Federal Insurance Rate Maps Fair Market Value
New York State Governor's Office of Storm Recovery
New York State Department of Homes and Community Renewal New York City Department of Housing Preservation and Development United States Department of Housing and Urban Development
Intergovernmental Panel on Climate Change Low-Density Growth Management Area North Atlantic Coast Comprehensive Study National Flood Insurance Program
New York City Panel on Climate Change New York City
New York State
New York City Mayor's Office of Recovery and Resiliency Preliminary Flood Insurance Rate Maps
Special Initiative for Rebuilding and Resiliency United States Army Corps of Engineers
Table of Contents
CHAPTER 1: INTRODUCTION ... 11
CHAPTER 2: BACKGROUND ... 13
NEW YORK CITY CONTEXT...14
Clim ate Change Effects in New York City ... 18
New York City Clim ate Planning 2007-2012 ... 20
NYC Clim ate Planning after Hurricane Sandy ... 21
State and Federal Clim ate Planning... 22
HURRICANE SANDY ... 25
BUYOUTS: RETREAT FROM THE COAST ... 27
ASSESSING RESILIENT OUTCOMES ... 32
CHAPTER 3: DATA AND ANALYSIS... 34
STATE BUYOUTS THROUGH LOCAL ACTIVISM... 35
Selection of Buyout Areas ... 38
Checkerboarding and Attrition ... 41
CONFLICT BETW EEN STATE AND CITY PROGRAMS ... 49
THE CITY ALTERNATIVE ... 55
Future Buyout Options at the City Level ... 58
CREATING RESILIENT OUTCOMES ... 59
CHAPTER 4: DISCUSSION AND CONCLUSION ... 60
CITY USE OF BUYOUTS...62
CREATING A COMPREHENSIVE COASTAL STRATEGY... 64
INTERVIEW S ... 67
Chapter 1: Introduction
In this thesis, I pursue the question of whether buyout and acquisition programs in post-Hurricane Sandy New York City have created progress towards climate resilience in the targeted areas. After Hurricane Sandy made landfall in New Jersey on October 29, 2012, residents whose homes were completely destroyed in the storm or whose loved ones had drowned were eager to leave the area and start again somewhere new. These residents also hoped to ensure that their land would never again be used for housing, and that their
efforts would create long-term resilience improvements in this low-lying coastal area. On the East Shore of Staten Island, residents organized to create a buyout program that would ensure these effects. Before using this program as an example from which to build
future coastal resiliency programs, it is important to understand its effectiveness in increasing resilience in these areas. Ideally, taking a critical look at existing programs will help to shape future use of buyouts as a tool for resilience planning, both in New
York and elsewhere.
In assessing the outcome of this case, I use a scale of incremental resilience in which the most resilient outcome is the creation of a coastal buffer zone that is constructed to
protect inland areas from flooding, is under the long-term management of a government entity, and is contiguous and large enough to have a significant effect. Steps towards this goal, whether physical or organizational, are improvements in the area's resilience. The three factors I consider are 1) the fair treatment of residents in providing a "way out" if
and when they choose to leave, 2) consolidation of the land into an ecological buffer area, and 3) long-term management of the land that is coordinated across levels of government in the interest of providing protection from coastal flooding.
NY Rising was able to make progress on the first two of these goals, but despite nearly five years of work on this effort, has not publicly demonstrated progress towards a long-term maintenance and management plan for the bought-out land. The program, which has purchased 37 of 209 acres in designated buyout areas, is rapidly demolishing buildings on these parcels and has committed to maintaining the land in the short term. However, the program was not intended to manage the land long-term, and attempting to develop a plan for disposition of the acquired properties. Through this analysis, I find that NY Rising, while it has been successful in providing financial support to flood victims in targeted areas, has been unable to serve all interested residents and has suffered from attrition, which has led to "checkerboarding" of acquired land. As a result, the land acquired through NY Rising does not form an effective buffer area to protect inland residents. The City of New York has coordinated with federal agencies to develop projects that enhance coastal resiliency within the NY Rising targeted acquisition areas but the city appears to have worked around the state acquisition project and, in doing so, has undermined the success of that program. This lack of coordination across levels of government sets the program back on its progress towards a resilient outcome for the East Shore of Staten Island.
Chapter 2: Background
When Hurricane Sandy made landfall on October 29, 2012, it threw into sharp relief the inadequacy of coastal climate adaptation in New York City, a comparatively wealthy, progressive city, which had already been under the leadership of a climate-conscious mayor, Mayor Michael Bloomberg, for over ten years. With a robust sustainability program under the umbrella of PlaNYC, first published in 2007, the city had been planting trees, supporting active transportation like walking and biking, promoting green and blue roofs, and was slowly expanding permeable pavement and stormwater retention programs. Despite all of these sustainability efforts, the city was revealed to be
inadequately prepared to protect the coast from storms or flooding due to sea level rise. When Hurricane Sandy' occurred, dozens of people died and critical infrastructure was crippled. Recovery from the storm is still ongoing, nearly five years later. Hurricane Sandy pivoted the city's long-term planning from a "sustainability" framework, in which the city's contribution to greenhouse gas emissions would be minimized, to "resiliency," in which the damage due to climate change effects would be minimized. (Pirani &
Tolkoff 2014) Robust planning efforts have been launched by agencies at every level of government and by non-governmental organizations in reaction to the storm.
Implementation of these plans and formulation of a unified vision of coastal protection are still not complete. The case of overlapping city and state climate adaptation programs
I Hurricane Sandy was not technically a hurricane when it made landfall, but a
within the city limits provides a rich illustration of what happens when resiliency efforts at different levels of government are not well coordinated.
New York City Context
New York City is a low-lying and densely populated coastal city, but its main population centers are protected from storm surge by relatively low-density outlying areas, including the area in question on Staten Island's East Shore, as well as Coney Island and the
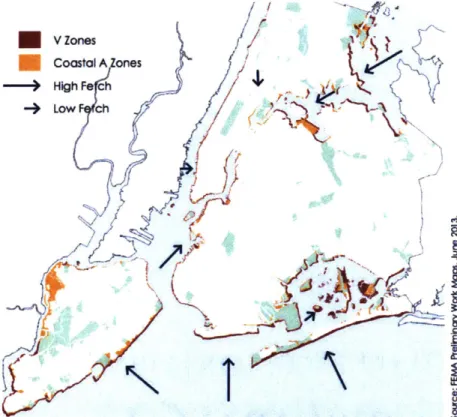
Rockaways. While many of the 520 miles of shoreline in the city have been built up with hard edges like seawalls and bulkheads, the areas that are most exposed to wave action
(i.e. which have a large "fetch," or distance to the nearest shoreline) are generally unprotected by hardening. (City of New York 2013a) These sandy, gently sloping
shorelines that face the most extreme wave force have a history of flooding and are all formally identified as at-risk areas through FEMA's National Flood Insurance Program
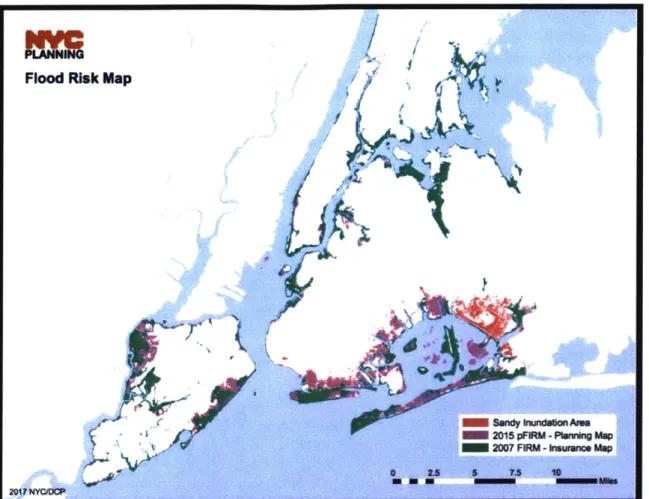
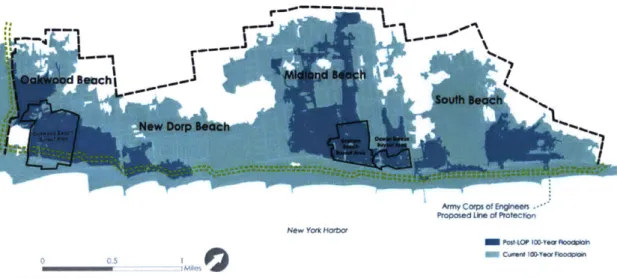
(NFIP). Flooding in many instances has exceeded the 100-year floodplain (the area that
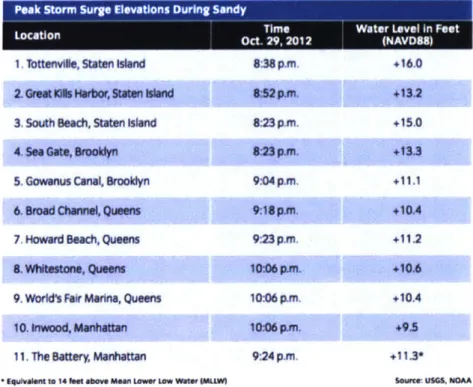
has a 1% chance of being flooded in a given year) as indicated by the NFIP maps, shown in Figure 4. Not only did flooding occur farther inland than expected, these vulnerable areas experienced some of the highest storm surge levels in the whole city. (See Figure
V Zones Coastal A ones -- High Fe ch
-4 Low ch,
Figure 1: Exposure to Wave Force, Source: City of New York 2013 Urban Waterfront Adaptive Strategies Report, pg 17
NATURAL -. Sandy -""" Marshy Rocky Undefind HARDENED -"" Bead I1v
Figure 2: Shoreline Condition, Source: City of New York 2013 Urban Waterfront Adaptive Strategies Report, pg 17
V
F--a
0 Ui
S6One of the primary tools for communicating flood risk to residents of flood-prone areas is through flood insurance rates. (Freudenberg 2016) The National Flood Insurance
Program (NFIP), created in 1968, ensures that all homeowners in the 100-year floodplain carry flood insurance. FEMA develops formal maps identifying vulnerable areas, called Flood Insurance Rate Maps (FIRMs), that form the basis of this program. FIRMs are intended to be updated regularly, but before Hurricane Sandy, they had only been
incrementally updated - not significantly updated - since 1983. As a result, the maps
underestimated the impact of flooding from Hurricane Sandy. (City of New York n.d.) At
Peak Storm Surge Elevations During Sandy
LocationTime Water Level In Feet
LocaionOct. 29, 2012 (NAVD88)
I Tottenville. Staten island 8:38 p.m. +16,0
2. blti~ rbr Stlwn Wiand Spm. +.i.
3. South Beach, Staten land 823 p.m. +15.0
4.Sea Gate, Brooldyn 823 p.m +13.3
5. Gowanus Canai, Brooldyn 9:04 p.m. +11.1
6.Broad Channel.Queens 9:18p.m. +10.A
7. Howard Beach, Queons 9:23 pm. +11.2
8. Whltestone, Queens 10:06 pm. +10.6
9. World's Fair Marina, Queens 10:06 p.m. +10.4
10. Inwood, Manhattan 10:06 pim. +9.5
11, The Battery, Manhattan 9:24 p.m. +11.3*
Equivalweent to 14 bent above Mean Lewer Low weer IMI kee~s, seU.
Note This cat jcacoms AS elevfa In stng the natlonal relsince szandM r bnOwn a hAvDe, which O sN& bles a cOnsentW base
easiurment pomn frwY which elevatons &e dtermnwwd nt osher loca rwencas w sea level Press accouts wr othr sourcas are knoWn to be repOrted usg flfay feeence sW "daess sd rOQstt cOvsrtin lie. CIhW 2 lIOYet A0"iiSi)
Figure 3: Peak Storm Surge Elevations Source: City of New York, 2013 Special Initiative for Rebuilding and Resiliency Report
Flood Risk Map
2OIVNYcJocA
Sandy knundion Area
2015 PFRM - Phmnni*gLisp
2007 FIRM -knmxanoe Map
0 s
1.5
1
00 200 NR -Is Wnc a
Figure 4: Updated FIRMs and Sandy Inundation, Source: City of New York
the time of Hurricane Sandy, flood estimates were based on the 2007 Effective FIRMs, which had been incrementally updated based on existing conditions but did not take into account projected future conditions, including sea level rise and subsidence.
(Freudenberg 2016) In 2015, FEMA underwent a remapping process after Hurricane Sandy and released updated preliminary FIRMs (pFIRMs). The City of New York filed a technical disagreement with the new maps, arguing that FEMA's analysis caused them to overestimate at-risk areas. (ORR, 2015) The city is currently working with FEMA to issue new FIRMs. (City of New York n.d.)
In New York City, many coastal areas, including the East Shore of Staten Island, my study area, were already "down-zoned" before Hurricane Sandy hit, although this was not
intended to protect residents from climate-related threats, but rather to maintain the character of the neighborhoods and prevent additional development. (Laskow 2014) This zoning tool created Lower Density Growth Management Areas (LDGMA), in which development is limited, parking requirements are relatively high, and front, back, and side yards are mandated. Staten Island was designated a LDGMA when the text of this zoning amendment was approved on January 18, 2011. (DCP n.d.)
On the East Shore of Staten Island, the character of the neighborhoods was primarily small single family beach bungalows on very small lots. These buildings had been converted into year-round residences over time but were still vulnerable due to their low elevation and materials that are not compliant with current building standards. After Hurricane Sandy, the city developed new zoning for flood-hazard areas, and homes rebuilt through the city program were required to be rebuilt to these standards.
Climate Change Effects in New York City
The city has already experienced measurable climate change effects since 1900. In that time period, sea level, mean annual precipitation, and mean annual temperature have all risen:
Measure Time Period Total Average
Increase Increase
by Decade
Mean annual 1900-2013 3.40 F 0.30 F
temperature
Mean annual 1900-2013 8 inches 0.8 inches
precipitation
Sea level 1900-2015 1.1 ft 1.2 inches
Sea level rise in the New York City area is greater than the global average because of land subsidence and local water temperature. Future sea level rise in the NYC area is projected to continue to be higher than the global average, and is very likely to accelerate over time. Timeframe Low Estimate High Estimate 2050s 11 in 21 in 2080s 18in 28in 2100 -- 72in
Note: These estimates use a base sea level of 2000-2004. (Source: Horton 2015)
When it comes to projecting future flooding, both sea level rise and storm intensity are important. The NPCC 2015 Executive Summary states that "projected changes in the frequency and intensity of coastal storms are uncertain at local scales." The authors also
assert that, "It is virtually SIRR Sea Level Rise Analysis
certain that sea level rise alone will lead to an increased frequency and intensity of coastal flooding as the century progresses." (Rosenzweig & Solecki
2015, 11) il
Only a few neighborhoods of the city are projected to
- .t r it - -!s*
W# TW U nMS dMM %Cm 0
Figure 5: High Tide Inundation Projections, Staten Island. Source: SIRR Chp 3,2013
endure daily flooding at high tides by 2050, but these areas include the Oakwood Beach buyout area, as well as parts of Edgemere, in the Rockaways. (City of New York, 2013)
If these areas experience daily flooding, they will become uninhabitable.
New York City Climate Planning 2007-2012
Michael Bloomberg, former Mayor of New York City, undertook an extensive sustainability-focused planning effort behind his signature package of sustainability programs, PlaNYC, which was published in 2007. (Rosenzweig et al. 2011) PlaNYC was a forward-thinking plan for an American city, one of the "first generation" of municipal climate change plans. (Wheeler 2008) New York City's sustainability efforts with regards to city infrastructure were praised for being comprehensive and scientifically-based: "New York City's climate change adaptation efforts are similar to the efforts in other cities, but they offer a comprehensive set of specific contributions including the design of a multi-jurisdictional stakeholder-scientist process." (Rosenzweig et al. 2010) However, PlaNYC focused on sustainability efforts like reducing the city's carbon footprint, and it only began to set in motion plans for coastal climate change adaptation. Although it set progressive sustainability and emissions targets, PlaNYC did not include a complete coastal adaptation plan. Instead, the administration committed to developing a coastal plan and convened the Climate Change Adaptation Task Force to lead that initiative. (Bassett & Shandas 2010)
The New York City Panel on Climate Change (NPCC) was created alongside the Adaptation Task Force by then-Mayor Bloomberg in 2007. Since then, NPCC research has formed the scientific basis for climate change policy in the city, supporting global
projections from the Intergovernmental Panel on Climate Change (IPCC). The NPCC has continued to conduct important and impactful research across mayoral administrations.
NYC Climate Planning after Hurricane Sandy
After Hurricane Sandy, the city kick-started a long-term strategy for climate change adaptation for the areas that experienced damage during the storm. That strategy was published in 2013 as the Special Initiative for Rebuilding and Resiliency (SIRR) Report. That report was the city's first comprehensive adaptation plan for its coastline. (City of New York 2013)
SIRR introduced a robust program of resiliency improvements in the city, from economic and social resiliency to infrastructure resiliency. In terms of coastal protection, the report promised to raise coastal elevations, improve the city's process for managing coastal infrastructure, and introduced a broad spectrum of coastal protection projects. It included a "full build" option which incorporated an enormous seawall across the entire New York harbor. The report did not include buyouts or coastal retreat in any form. Mayor
Bloomberg ended his introductory letter to the SIRR with this mandate: "We are a coastal city-and we cannot, and will not, abandon our waterfront." (City of New York 2013, 3)
With the change of mayoral administration from Bloomberg to de Blasio in 2014, government priorities shifted from infrastructure-focused to resident-focused. The
Mayor's Office debuted OneNYC, a plan to replace PlaNYC, and published the details in a report called One New York: The Plan for a Strong and Just City in April of that year. OneNYC continued several of the programs started through PlaNYC and added sections on coastal protection and resiliency. In April of 2014, the de Blasio administration also
created the Mayor's Office of Recovery and Resiliency to streamline post-Sandy work and promote future plans for resiliency. (City of New York, 2014)
The Mayor's Office of Recovery and Resiliency (ORR), along with the Department of City Planning (DCP) continue to push for more resiliency planning in the city, and have introduced new sections of zoning code to encourage improved resiliency for buildings in the 1 00-year floodplain. In at-risk areas, these regulations relax some of the height
restrictions to allow for elevation of buildings, and they limit the amount of dwelling space allowed at or below the design flood elevations. (See Figure 6.)
along with the city's Department of Housing Preservation and
Development (HPD), Height Access
must recognize elevation need for stairs/ramps requires
have also launched a requirements in flood zones Imaginative solutions
variety of resiliency planning efforts, including one called
Parkin Ground Floor Uso
may not be possible below buildings may be allowed only
DCP and ORR,
Mechanical Systems must allow relocation out of flood-prone areas
71
Streetscape limit negative effect of blank
Resilient Neighborhoods, ground limited use of ground floors walls on streetscape
Figure 6: Changes to Zoning in Flood-Risk Areas. Source: NYC DCP Climate
spearheaded by DCP, Resiliency 2013
which considers the needs of individual at-risk neighborhoods and has begun working with local stakeholders to develop targeted plans. (City of New York 2017)
State and Federal Climate Planning
At the federal level, the primary driver of coastal adaptation planning is the Coastal Zone Management Act of 1972. (Siders 2013, 22) This act designated coastal zones and
required participating states to develop coastal management plans (CMP). Once these are in hand, states have the power to certify or deny certification of CMP compliance to federal-level programs, which give the state considerable power over their coastlines and a tool to push back against federal regulations that affect coastal areas. New York State's CMP was completed and submitted in 1982. (New York Dept. of State 1982) New York State's climate planning until Hurricane Sandy was mainly focused on emissions
reduction, not coastal issues. In 2009, then-Governor Paterson signed Executive Order 24, which set a goal of reducing emissions 80% below 1990 levels by 2050 and mandated the development of a Climate Action Plan. (Dept. of Environmental Conservation 2009) An interim report was issued in November of that year, focusing on emissions reduction, but progress slowed once the gubernatorial administration changed, and Governor Cuomo's office was reported in 2015 to say that finalizing the Climate Action Plan was not a priority. (Crean 2015)
The shift from sustainability planning to resiliency planning at the New York State level also began after Hurricane Sandy. Governor Cuomo created the NYS2100 Commission on November 15, 2012 to assess the state's resiliency and to issue recommendations for improvements to infrastructure resiliency. (NYS2100 Commission 2013) Co-chaired by Judith Rodin, President of the Rockefeller Foundation, the Commission issued a report that included a set of broad recommendations, including improvements to coastal
infrastructure such as tide gates and encouraged building back damaged infrastructure in a more resilient way. The recommendations did not specifically lay out a plan for coastal areas and did not mention retreat.
New York State's planning for climate resiliency has mainly been expressed through guidance provided to local governments so that climate resiliency may be incorporated into local rulemaking. For example, Governor Cuomo signed into law the Community Risk and Resiliency Act in September of 2014, which required sea level rise projections to be incorporated into siting and permitting for infrastructure projects that would be approved by state agencies. The law also directed state agencies to develop guidance for local lawmakers to encourage them to incorporate climate change into their local
legislation. (New York State n.d.) The first public stakeholder meeting associated with this work was held on November 16, 2015. The state website documenting the current status of this work still asserts that the completed documents will be circulated in 2016 or
2017 but does not show further work on the issue aside from the initial stakeholder
meeting.
On a separate track, New York State published New York State Climate Smart
Communities: Climate Smart Resiliency Planning in October 2014, which was modeled
on the New Jersey Department of Environmental Protection Coastal Management
Office's report called Getting to Resilience: A Coastal Community Resilience Evaluation
Tool. Like the intended outcome of the Community Risk and Resiliency Act, this report
was intended for use by municipal decision makers and was a guide for making local planning more resiliency-focused. (New York State 2014, 4) In general, state-level climate planning in New York is more directed towards clean energy and emissions reduction, and coastal planning for climate change is devolved to municipal levels.
In addition to climate planning led by municipal governments, the United States Army Corps of Engineers (USACE) has maintained a significant presence in recovery and
rebuilding efforts after Hurricane Sandy. On the East Shore of Staten Island, this work has included a temporary seawall along the coast and plans for a "Line of Protection," which integrates beach nourishment, a berm, and public space along the coast. While this protective barrier provides some protection from flooding, hundreds of households are projected to remain in the 100-year floodplain even after it is built, and assuming full participation in the state buyout program. (Dept. of City Planning 2017)
Hurricane Sandy
Hurricane Sandy, after swirling northwards along the east coast of the United States, carved a right-angle turn and made a direct hit on the coast of New Jersey the night of
October 29, 2012. In preparation for the storm, the city shut down public transportation and all major bridges, a rare and striking measure in "the city that never sleeps." The
storm surge peaked almost exactly at the highest high tide of the month, causing a larger storm surge than would typically be generated by a storm of this intensity. (City of New York 2013, 12) The damage caused by this surge was vast. Forty-three people were killed
by the storm within city limits, of which twenty-three deaths were on Staten Island.
Seventeen percent of New York City's total land area flooded, exceeding the 100-year floodplain by 53%. This land area included 300,000 units of housing, many hospitals, power plants, and other pieces of critical city infrastructure. (Ibid., 13) Sandy destroyed thousands of homes, left two million people without power, and caused approximately
$19 billion in damage. (Ibid., 11) The storm indelibly changed the lives of hundreds of
thousands of New Yorkers.
In the immediate aftermath of the storm, city officials were focused on life safety issues, inspecting bridges and responding to distress calls. Residents organized to provide food
and water to elderly and disabled neighbors who found themselves trapped at the top of
tall residential buildings.2 The protest movement Occupy Wall Street quickly deployed a
task force to help the most damaged areas and stayed there even when FEMA field offices and local fire stations closed due to bad weather, as more storms moved through the area in the week after Sandy. (Feuer 2012) City officials moved thousands of
residents into emergency housing within days of the storm, and repair programs began to roll out immediately.
Shortly after Hurricane Sandy made landfall, on October 30, 2012, President Obama
declared a state of disaster in New York, New Jersey, and Connecticut.3 (FEMA n.d.)
This cleared the way for an appropriation of federal funding for disaster relief and
recovery, which was signed into law on January 29, 2013. (United States Congress 2013) At the same time, President Obama signed into law the Sandy Recovery Improvement Act of 2013, which streamlined some processes and diverted some of this funding from rebuild-in-kind programs to pilot hazard mitigation grant programs. (FEMA 2015) While emergency crews from all levels of government repaired bulkheads, roads, and other critical infrastructure, plans for long-term recovery began to come together. In total, recovery activities in New York City have received $15.4 billion, of which $13 billion were administered by the city itself. (City of New York 2017)
2 The best of these stories may be that of "the Sherpa who speaks Yiddish," Chhapte
Sherpa, who hauled heavy bags of supplies up twenty-four floors between shifts of slicing lox at Russ and Daughters on Manhattan's Lower East Side. (Kilgannon 2012)
3 Several days later, this area was expanded to include Massachusetts, Washington D.C.,
Buyouts: Retreat from the Coast
Buyouts occur when a government entity purchases vulnerable land from private landowners in order to reduce the number of residential units in the most vulnerable areas. Typically, buyouts are conducted in response to a major storm or flooding event when federal disaster relief funds are made available. As expressed in the Lincoln Institute for Land Policy's report Buy-Infor Buyouts, while there are many methods for reducing risk to flood-vulnerable populations, relocation out of the floodplain is the only method to dramatically and permanently reduce that risk. (Freudenberg et al. 2016) Buyouts are part of a strategy called "managed retreat" which not only seeks to relocate residents out of vulnerable areas, but also seeks to block new development in areas that rely on coastal armament for protection from floods, as armament is considered to provide only short-term protection. (Siders 2013, iii) Among post-Sandy programs in mid-Atlantic states, "acquisition" is used to describe properties that are acquired in order to be auctioned back to a private entity and rebuilt to new, stricter flood-proofed design
requirements. "Buyout" is used in this environment to describe properties that are purchased and required to remain open space in perpetuity.
Buyouts are primarily conducted in response to storm events that precipitate damaging floods, either due to riverine or coastal flooding. Because funding for buyouts is primarily tied to emergency situations, the resulting programs are inevitably shaped by this emergency environment, with the details being worked out simultaneously with program implementation and long-term plans largely not considered in the immediacy of providing relief for displaced residents. Buyouts are fairly new tools in the United States, and lack consistent implementation. This may increase fear of political unpopularity, in
addition to the short lead-time possible for programs funded only immediately after a disaster. Until buyouts are established as part of the toolbox of resiliency strategies and made easily available to people who would like to leave their land, they will remain limited in their usefulness.
The history and trajectory of buyout programs in the United States can perhaps most easily be understood through their sources of funding. In most cases, buyouts are funded through FEMA-backed disaster relief programs, although they can also be funded through Community Development Block Grants for Disaster Recovery (CDBG-DR). In either case, there is no source of funds until after a disaster declaration is made, and the amount of funds is not set until a Congressional appropriation is made. In the case of Hurricane Sandy, disaster relief funds were made available several months after the storm, in January 2013. (Pirani & Tolkoff 2014) By that time, residents who had been displaced from their homes after the storm were desperate, temporary housing was scarce, and residents had begun to organize towards a buyout.
An early example of Federal buyouts in the United States is the response to historic Mississippi River flooding in the Midwest during 1993. In July of 1993, after months of flooding, President Clinton issued a disaster declaration that encompassed the entire state of Iowa. The scale of the disaster prompted a change to the government's approach, a "shift away from six decades of thinking that all floods can be controlled by ever more extensive construction projects." Instead, the government instituted buyouts, which were "a recognition that in many cases the most sensible way to manage high-risk floodplains is to let them be floodplains." (Conrad et al 1998, 29) During this Midwest Flood, some parts of the Mississippi River reached their 500-year flood level (a flood which has a
0.2% chance of happening in a given year). Although FEMA had buyout authority beginning with the establishment of the Hazard Mitigation Grant Program in 1988, the buyout aspect of this program had not been implemented at a large scale until the 1993 Midwest Flood. (Conrad et al 1998) The state of Iowa organized its relief effort into ten Housing Recovery Zones that created and administered buyout programs independently. The areas whose programs were widely considered to be more effective were programs that integrated long-term land management plans and community support for the
relocation effort. In the Lincoln Land Institute's accounting of these programs, they assert that, "the Iowa buyout programs demonstrate the great value of designing integrated programs that consider more than property acquisition. Successful programs must also address the function of acquired land and retain community residents." (Freudenberg
2016, 25)
In 1998, the National Wildlife Federation published a report on voluntary buyout
programs called Higher Ground: A Report on Voluntary Property Buyouts in the Nation's
Floodplains, A Common Ground Solution Serving People at Risk, Taxpayers, and the Environment. Unlike the title of the report, it provided simple documentation of disaster
spending to date and straightforwardly condemned past responses to flooding while promoting buyouts as a method of habitat protection. As the report points out, it is much simpler and therefore tempting to build a levee to keep out the water than to deal with the complications of a buyout program. However, the benefits of the more challenging option is that, in its most complete form, it creates the possibility of permanently and
dramatically reducing flood risk. Levees, on the other hand, incentivize development in vulnerable areas and can be overwhelmed by floodwater in a particularly large storm or
after maintenance failures. The report also emphasizes that the process of instituting a buyout could be streamlined by working with the community before a disaster occurs, but because Federal funding for buyouts is only made available in the aftermath of a disaster,
opportunities for early coordination are limited. (Conrad et al 1998, 35) Financial
accounting after the 1993 buyouts estimated that the benefit-cost ratio of future insurance claims because of the buyout programs was 2:1. (Ibid, 39) By the end of May 1998, this
FEMA program was expected to have purchased land from 17,000 landowners.
Individual disasters that precipitate buyouts typically include hundreds, if not thousands, of landowners. (Ibid, 45) Coordination of efforts like these is an immense undertaking, particularly after a disaster, when former residents may be scattered and living in temporary housing.
In some buyouts, the coordination effort is much simpler. Whereas a municipality
typically coordinates with hundreds of landowners to reclaim vulnerable residential land, the Spruces Mobile Home Park, a rental community of low-income older adults in Massachusetts, was owned by a single owner who agreed to a buyout after devastating floods. The Spruces was destroyed in August 2011 by Hurricane Irene, during which the nearby Hoosic River overtopped its banks and swamped the area. (Lombard & Bent
2015) In response to these floods, a buyback and relocation project was undertaken by
Williamstown, MA, and Williams College, which donated land for new low-income housing to be built. (Damon 2014) The Spruces was officially closed in February 2016. (Shanks 2016) In some ways, this was a simple, efficient model for buyout program implementation, as government entities only needed to coordinate with one land owner. Because all residents were renters, this was not a voluntary buyout program for any of the
residents.4 Even in the case of The Spruces, when negotiations only had to take place
between one landowner and the local government, the process from storm event to real estate close still took four and a half years.
In the United States, there has been at least one buyout that is not linked to an acute disaster, but to slow, progressive inundation. Isle de Jean Charles is an island off of the coast of Louisiana that has been identified as among the United States' most vulnerable to sea-level rise. (Hasemeyer 2016) Since 1955, it has lost 98% of its land (only 320 of 22,400 acres remain) due to nine inches of sea-level rise and erosion due to nearby drilling. (Davenport & Robinson 2016) In January 2016, the Department of Housing and Urban Development awarded Louisiana a federal grant of $48 million to resettle the residents of Isle de Jean Charles. (HUD 2016) This is not the first time that these residents and federal agencies have explored the possibility of relocation, but previous efforts failed. One particular challenge to this relocation is the makeup of the resident population, many of whom are Native Americans who have a deep distrust of the
government and whose culture is inextricably linked to the land. (Davenport & Robinson
2016) As the first federally-funded relocation effort due to sea level rise, it will be closely
watched as a test case for adaptation strategies that involve resettlement.
Buyouts that are not thoughtfully conceived can fail in many ways, reducing overall progress toward resiliency. These programs may insufficiently compensate homeowners
4 In New York City, all plans that mention buyouts or acquisition are very careful to
clarify that the city has no plans to do anything other than voluntary buyouts, and that eminent domain will never be used for these purposes.
or provide insufficient relocation support, particularly for renters. They may have high rates of attrition that result in disconnected empty lots that do not provide a true coastal buffer. Although most buyout programs are voluntary, residents in buyout areas who
choose not to participate are still negatively impacted by the program, as nearby homes are first left vacant and then demolished. (City of New York 2013a) Buyouts may also kick-start development and function as a tool of gentrification and discrimination. All of these have been true of buyout programs and other acquisition tools used by
governments. Liz Koslov, a doctoral student at New York University who is studying
these buyouts from an anti-displacement perspective was surprised to find very few
-perhaps no - Staten Island residents whose homes were flooded in Sandy and who did
not want to participate in the buyout. Although long-time residents certainly had mixed reactions to the prospect of leaving home, they were interested in the program as a way to survive financially and gain closure. Notably, Koslov indicated that these buyouts would not have been received warmly if they had been perceived to be initiated by the
government. Instead, the buyout program was a product of intense advocacy on the part of local landowners, led by Joe Tirone, who owned an investment property in the Oakwood Beach area. Without his effort, there may have been no buyouts at all within the boundaries of New York City, demonstrating the essential role of a local, trusted agent in the success of buyouts.
Assessing Resilient Outcomes
The immediate reaction from city government to Hurricane Sandy was to rebuild, but coastal residents who had already suffered several major floods were ready to leave. Without a coastal zone strategy that recognized withdrawal as a possibility, each level of
government responded differently to pressure from advocacy groups, leading to a
critically constrained effort that was not situated within a long-term plan. In the following chapter, I attempt to the identify areas of conflict and assess the outcomes of these efforts to enhance resiliency in New York City.
Chapter 3: Data and Analysis
The key factors in determining a successful resilient outcome for buyout and acquisition
programs are (1) the protection of sufficient - and sufficiently contiguous - land in order
to provide a buffer area; (2) the adoption of plans for long-term management and maintenance of the land as open space; and (3) in resource-constrained environments, targeted acquisition in the most highly vulnerable areas. The programs launched in the wake of Hurricane Sandy, NY Rising and NYC Build It Back do not, as yet, meet these goals. Moreover, in some instances they conflict with other existing resiliency projects, like NYC DEP's Mid-Island Bluebelt. Although the NY Rising program still has the potential to realize some measure of resilience, NYC Build It Back was never intended to protect open space for floodplain management and quickly resold the properties it
acquired to private parties. It was intended not to reduce the total number of residential units in the floodplain, but to rebuild those residences into less-vulnerable structures. NY Rising, on the other hand, mandated that newly-acquired land be maintained as open space in perpetuity. However, it did not prepare a local partner to take on this
responsibility, nor did it set aside funding for this effort before launching the program, cutting short its ability to achieve a fully resilient outcome. As a result, NY Rising, even five years after the storm, is still searching for a local partner. Some former residents see the program as a success because it provided financial relief to homeowners. While discussions of the theoretical threats posed by climate change almost always turn to managed retreat, this program can provide insight into what actually works under real conditions. The most important lesson is that buyout programs developed quickly in the wake of a specific disaster and without regard for a long-term multi-scale implementation plans are very likely to fall short.
State Buyouts Through Local Activism
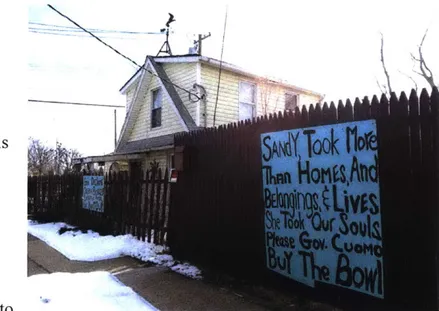
Local landowners representing some of the most-damaged areas along the coast of Staten Island formed a strong coalition led by Joe Tirone to petition their local government to acquire their land and ensure that it would not be used for future development. These residents had emotional and
compelling stories to tell about their losses.
Nevertheless, elected officials
ook
in city government rebuffed
buyout advocates. After city o
officials turned down their requests, the group was able to
Figure 7: Neighborhood Activism for Buyouts, Image from Nick Green via
gain an audience with Flickr, "She Took Our Souls" 2014.
Governor Cuomo, who launched the NY Rising buyout program to address their concerns. The state buyout program was fundamentally structured as a response to resident needs and was not implemented as part of a long-term regional resiliency plan. The state buyout program conflicted from the beginning with municipal efforts, both in its "creation story" and in the funding source it ultimately used: not FEMA's Hazard Mitigation Grant Program (HMGP), which must be administered through a municipality, but HUD's Community Development Block Grant Disaster Recovery (CDBG-DR) program, which the state could administer directly. In order to maintain complete
CDBG-DR grant, which would normally be borne by the municipality. (Freudenberg et al 2016, 28) In this way, the state was able to avoid financial coordination with the city.
Governor Cuomo, in his 2013 State of the State Address, described the State buyout program as follows:
There are some places where people may choose not to build back. I've talked to home owners who have dealt with serious floods three, four, five times over the past few years. Many of them are saying I don't want to have to do it again. I'd rather buy out the parcel and move on. There are some parcels that Mother Nature owns. She may only visit once every few years, but she owns the parcel and when she comes to visit, she visits. (Cuomo, 2013)
Not only did the Governor use the language of managed retreat in launching the program, the state legislature also codified this intent into law, first in 2013-14 when it required land procured through this program to be transferred into the "custody and control of the office of parks, recreation and historic preservation for use pursuant to the parks,
recreation and historic preservation law." (New York State Assembly, 2014). It went further in 2015-16, requiring: "All such land shall be dedicated and maintained in
perpetuity as open space for the conservation of natural floodplain functions." (New York State Assembly, 2015) The relevant legislation goes on to specify the few types of
buildings allowed to remain, including public bathrooms and other amenities typical of parkland. However, the program is fundamentally constrained by having no local partner to participate in the long-term management of the relevant properties. In March of 2017,
the state was still in negotiations with local government entities and non-profits to find a long-term owner and manager of the lands that were purchased.
The failure of the state to create a long-term plan for the management of acquired lands is primarily the result of the circumstances under which the program was developed. It was a short-term response to pressure from affected residents. In many cases, the same
residents had suffered substantial flooding in earlier storms, including in 1992. They had begun to organize into a Flood Victims Committee long before Hurricane Sandy. (Rush 2015) These residents were looking for closure on this traumatic experience. Their willingness to move was characterized as a sacrifice for the greater good of the community and for the safety of inland residents. (Koslov 2014)
In addition to wishing to protect future Staten Island residents from experiencing the emotional impact of losses like these, part of the reason to advocate for this program was to find financial relief. Tirone found that residents who had taken the buyout earlier were better off financially because they were able to benefit from the housing market
rebounding after the 2008 crash. The sooner people bought new property, the more they were able to benefit from the buyout program.
5 From an interview with Rachel Wieder, Director of the Governor's Office of Storm
Selection of Buyout Areas
In order to assemble a sufficiently large and compact tract of land to develop a coastal buffer, the state needed to ensure that a high enough proportion of landowners in each block would commit to a buyout. Although many homeowners in the affected areas
formally expressed interest in the program, the state ultimately designated three small areas within the boundaries of New York City to be eligible for buyouts: Oakwood
Beach, Ocean Breeze, and Graham Beach.6 These areas are very small in comparison to
the 1 00-year floodplain (the area that has a 1% chance of flooding in a given year) on the coast of Staten Island. The buyout areas would not provide a sufficient buffer even if all the eligible households in these three areas took the buyout. As it was, far fewer property
AftchI
44
Now Yourk Harbor
South Beac# %.
AryCtsof EV~nem
PrpsdLie of Protection
M Po-LCP 100-Y.a 0obb
Fft~ ".,d1cft*!"0"C1W'~o~
Figure 8: State Enhanced Buyout Areas Compared to 100-Year Floodplain, from NYC DCP Resilient Neighborhoods East Shore Report, 2017
6 NY Rising also implemented buyout and acquisition programs outside the boundaries of
owners chose to participate than were eligible: 40% in Graham Beach, 85% in Oakwood Beach, 59% in Ocean Breeze.
The reasons these neighborhoods were selected are not clear, and even precise boundaries
of the final buyout areas have not been made public.7 In the course of my research, I
encountered three different explanations for why no additional neighborhoods were included. The first is that these were the only blocks that met contiguousness
requirements. The second is that the state did not have enough money to purchase more land. The third is that city officials intervened to stop the state program from expanding. As officially documented in the NY Rising Buyout and Acquisition Program Policy Manual, the requirements for an area to qualify as an enhanced buyout area are as
follows:
" A history of flooding and damage to due storms;
* Multiple contiguous parcels in the floodplain that exhibit similar damage and whose owners have formally expressed interest in a buyout;
" The State and municipal officials have "a mutual understanding of the benefit of
permanently removing residents/homes from the floodplain permanently [sic], and converting the site to a coastal buffer zone." (GOSR 2016, 13-14)
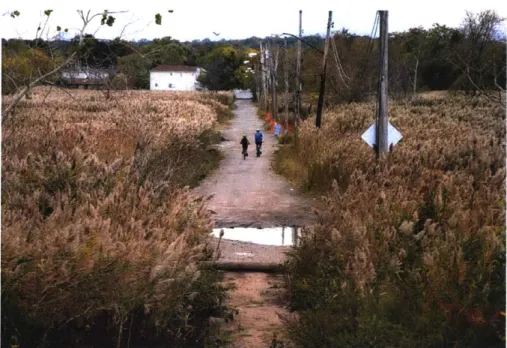
The initial version of the program guidance document included a much broader definition of buyout eligibility: Properties within the 100-year or 500-year floodplain in Richmond County (i.e. Staten Island), having been substantially damaged (defined as >50% of Fair
Figure 9: Kissam Avenue, Oakwood Beach. Source: SIRR
Market Value (FMV)) in Hurricanes Sandy or Irene, were all eligible.8 Location within
an Enhanced Buyout Area was not required at all, but it qualified the owner for an additional 10% of pre-storm FMV. (GOSR 2014, 23-4)
Although residents of many other communities (Rich, 2014) documented their
willingness to be bought out, only the three areas advocated for were deemed eligible. The buyout-eligible neighborhoods are still termed "Enhanced Buyout Areas," indicating that landowners would be eligible to receive an additional 10% over pre-storm FMV,
although the state program no longer offered buyouts elsewhere in New York City.9
GOSR reported that 99% of property owners in the Oakwood Beach buyout area
8 Hurricane Irene occurred in 2011 and caused major damage due to stillwater and
riverine flooding, which impacts different areas than the storm surge caused by Sandy. Although the worst damage from Irene was in New England, some Mid-Atlantic areas were also affected.
9 The distinction holds in areas outside of New York City, where the state is offering both
submitted applications to the program. (GOSR 2015, referenced in Lincoln Inst. 2016,
28) As the programs evolved, however, many applicants withdrew. This left a patchwork
of properties to be acquired by the state, reducing possible gains towards resilience. Additionally, because every block included in the program retains at least one private land owner, city agencies will still be required to maintain roads and other public infrastructure within designated buyout areas. Remaining residents have a right to be served, although per capita infrastructure costs will increase. This "checkerboarding" of now-vacant properties further limits the ability of any entity, city or state, to effectively use this land for adaptive infrastructure.
Checkerboarding and Attrition
To more fully understand the nature of this ownership patchwork, I have tried to determine the reasons that people chose to withdraw from the buyout program. As of April 4, 2017, the total land successfully acquired by NY Rising within their Staten Island buyout areas is 37.1 acres.
NY Rising Completed Acquisitions, Area (Acres) by Phase
Percent of
NY Rising Closing Disposition Disposition Grand
Buyout Area Complete in Progress Complete Total Total
Graham Beach 2.32 6.90 0.00 9.22 25% Oakwood Beach 6.01 16.19 0.00 22.20 60% Ocean Breeze 5.62 0.05 0.00 5.67 15% Total 13.95 23.14 0.00 37.10 Percent of Grand Total 38% 62% 0%
Of the total land area in the program, 96% has completed closing, and another 4%, or 1.61 acres, are active in the program but have not yet reached this milestone. Note that no
properties in this program have completed disposition to an entity that will maintain the land long-term, although that process has begun for 62% of the active area.
NY Rising Buyout Areas, Area (Acres) by Phase
NY Rising Buyout Area Verifi- Offer cation Accepted Ready for Closing Closing Complete Disp. in Progress Disp. Complete Grand Total Graham 0.09 0.17 0.07 2.32 6.90 0.00 9.56 Beach Oakwood 0.00 0.59 0.00 6.01 16.19 0.00 22.79 Beach Ocean 0.00 0.69 0.00 5.62 0.05 0.00 6.37 Breeze 0.09 1.45 0.07 13.95 23.14 0.00
Data from the New York State Department of Homes and Community Renewal (HCR) also describe several categories of applicants who subsequently withdrew from the
program. 10 The table below shows the number of parcels in each inactive category.
NY Rising Buyout Areas, Number of Lots Inactive by Status
Not
NY Rising Cancel Eligible
Buyout Area Aplication Inactive Letter Sent On Hold Withdrawn Total
Graham Beach 160 4 1 33 198
Oakwood
Beach 69 18 22 55 164
Ocean Breeze 27 1 24 52
256 22 1 23 112 4j4
10 This information was initially redacted from HCR's FOIA response but was still
retrievable.
Total 38.71
Together, these 414 parcels represent all inactive applications, or 43% of all lots included in the HCR database. I represent these 414 parcels as "Inactive" in the following charts and maps.
NY Rising Buyout Areas, Percent of Total Lots Ever Active
NY Rising Buyout Area Graham Beach Oakwood Beach Ocean Breeze Total
Active Lots Inactive Lots
40% 60%
67% 33%
66% 34%
57% 43%
Another category to consider are lots within buyout-designated blocks that were never entered into the buyout database. Because the exact limits of the buyout areas are poorly defined, for the purposes of this analysis, I have defined buyout areas as blocks in which at least one lot is represented in the HCR database. Lots within these blocks that are not represented in the database I refer to as "Never Active".
NY Rising Buyout Areas, Percent of Total Lots in Buyout Areas
NY Rising Never Active Total
Buyout Area Active Lots Inactive Lots Lots Lots
Graham Beach 31% 46% 23% 100% Oakwood Beach 63% 32% 5% 100% Ocean Breeze 55% 28% 17% 100% Total 50% 37% 14% 100% Total Lots 100% 100% 100% 100%
The size of these parcels varies widely. Many are very small: 143 parcels in the Enhanced Buyout Areas are less than 1555 square feet in area (0.036 acres)." The picture is quite
different - and more helpful for understanding future land use - when represented by area
instead of by lot.
NY Rising Buyout Areas, Active Status by Area (Acre), Percent of Total
NY Rising Never Active Total
_Buyout Area Active Area Inactive Area Area
Graham Beach 24% 48% 28% 100%
Oakwood Beach 15% 30% 55% 100%
Ocean Breeze 50% 27% 23% 100%
Percent of Total 19% 34% 48% 100%
Several large parcels in Oakwood Beach were never active, and substantially change the proportion of the inactive area when compared to the proportion of inactive lots.12 The four largest never-active parcels total 83.5 acres. These are zoned as parks, and are owned by the NYC Department of Parks and Recreation. The buyout areas are
surrounded by parkland and, in the case of Oakwood Beach, are primarily made up of city-owned land zoned as parkland. As a result, it seems reasonable to assume that Parks would receive the land through the state's disposition process. However, although GOSR is in the midst of negotiations over long-term ownership of this land, they are yet to find a
" Perhaps because of these very small lots, many property owners own more than one lot. Note that these tables count each lot separately.
12 Within the Oakwood Beach area, 36 other parcels zoned as parkland and owned (since
at least 2012) by Parks are listed as cancelled applications in the NYC HCR data. This raises a question for further study: whether Parks and other City agencies initially pursued buyouts through the State program.
city agency or an acceptable non-government actor such as a non-profit organization willing to commit to long-term ownership and maintenance of this land.
These buyout areas currently have quite low participation rates, and as a result only 19% of the eligible area is being acquired through the state buyout program. This incomplete buyout lowers the value of the state's resulting asset for use as a coastal buffer.
NY Rising Buyout Areas, Consolidated Table of Area by Active Status (Acre)
% Active %
NY Rising Total of Total Acti
Buyout Never Ever Grand Ever of G
Area Active Inactive Active Active Total Active Tota
Graham Beach 9.56 19.32 11.30 28.88 40.18 33% 24% ve rand 1 Oakwood Beach 22.79 47.42 85.79 70.21 156.00 32% 15% Ocean Breeze 6.37 3.41 2.88 9.78 12.66 65% 50% Total 38.71 70.16 99.97 108.87 1208.83 136% 19%
These totals are surprisingly low for a program that was committed to targeting only
highly consolidated and committed areas, and which reported applications from 99% of
landowners in the Oakwood Beach area. (GOSR 2015, referenced in Freudenberg et al
2016, 28) In only one block (Block ID 4746) did all properties that applied for buyout
remain in the program through the closing complete milestone, and even that block retained some private property owners.
Some attrition, although it is difficult to determine how much, is due to "underwater" mortgages. In instances where owners owed more on their property than its FMV, the state was only able to pay the pre-storm FMV plus a small bonus for resettling within
New York City limits. This is a well-known issue in the buyout literature, and the challenge exists even for foreclosed properties, for which banks may be unwilling to
receive less than the amount owed on the property, rather than its present - or even
pre-storm - worth. (Freudenberg 2016, 31) Although other buyout administrators have been
able to negotiate with banks to forgive such debt, but New York State has not been able
to reach a similar agreement.'3 In this way, the compactness and contiguousness of the
state's acquisition - the program's ability to create a resilient outcome - was undermined
by the specific financial circumstances of private property owners. Initial plans for the
program and the selection of buyout-eligible areas appears not to have taken this issue into account.14
13 As indicated in an interview with Rachel Wieder, Director of the GOSR Buyout and
Acquisition Programs.
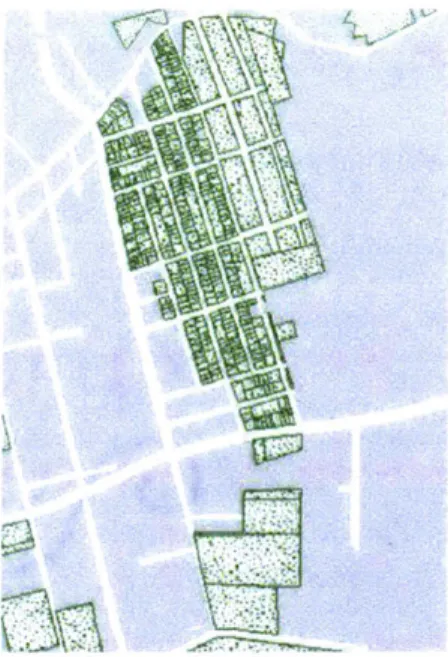
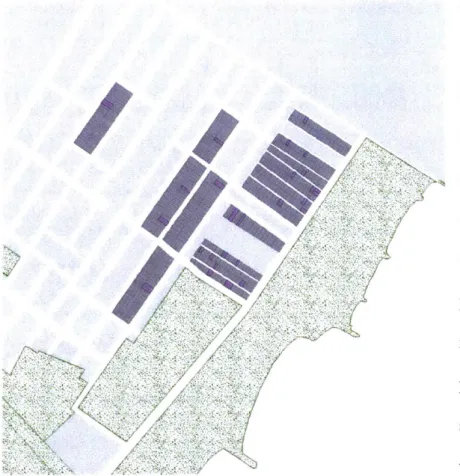
Maps of NY Rising Enhanced Buyout Areas
[iZ] zoned as Parkand DEP Owned
NYC Build It Back Acquisition Lots NY Rising Buyout Lots
Blocks Containing Buyout Lots
Oakwood Beach
Bimycut Arm
- -- .-
000
-;-
-I
Conflict Between State and City Programs
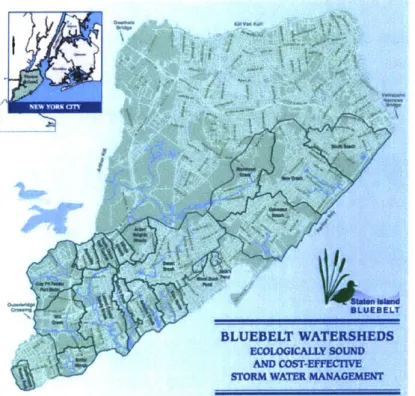
Another reason for attrition of eligible households is apparent interference by New York City's Department of Environmental Protection (DEP). DEP has long been developing an inland drainage network that addresses stormwater flooding (not specifically coastal flooding) in southern and eastern Staten Island. In addition to installing sewers in areas that were formerly unsewered, the Department has installed many constructed wetlands and other natural filtering and water retention areas under the heading of Best
Management Practices (BMPs). Installation of BMPs was much faster in southern Staten Island than elsewhere, and by January 2011 DEP had completed fifty sites and had begun work on another forty-two, all
within the southern
watersheds. Work on the Mid-Island section of the Bluebelt has progressed more slowly.
On September 30, 2010, DEP 40
produced a final scope of
work for this area. Bluebelt SLUEBELT
BLUEBELT WATERSHEDS
watersheds called Oakwood ECOLOICAMY SOUND
AND COST-EFfERn STORM WATER MANAGEWMET
Beach and New Creek
Figure 10: NYC DEP Bluebelt Watersheds, from a NYC DEP pamphlet,
substantially overlap with
what would become NY Rising buyout areas. These plans, published two years before Hurricane Sandy, included a real estate plan outlining some successful acquisifions, as well as continuing acquisition plans. (DEP, 2010) Progress on the Mid-Island section of