Publisher’s version / Version de l'éditeur:
Vous avez des questions? Nous pouvons vous aider. Pour communiquer directement avec un auteur, consultez la première page de la revue dans laquelle son article a été publié afin de trouver ses coordonnées. Si vous n’arrivez pas à les repérer, communiquez avec nous à [email protected].
Questions? Contact the NRC Publications Archive team at
[email protected]. If you wish to email the authors directly, please see the first page of the publication for their contact information.
https://publications-cnrc.canada.ca/fra/droits
L’accès à ce site Web et l’utilisation de son contenu sont assujettis aux conditions présentées dans le site LISEZ CES CONDITIONS ATTENTIVEMENT AVANT D’UTILISER CE SITE WEB.
Internal Report (National Research Council of Canada. Institute for Research in
Construction), 2002-01-07
READ THESE TERMS AND CONDITIONS CAREFULLY BEFORE USING THIS WEBSITE.
https://nrc-publications.canada.ca/eng/copyright
NRC Publications Archive Record / Notice des Archives des publications du CNRC :
https://nrc-publications.canada.ca/eng/view/object/?id=4cc893fc-1eb9-4657-b36f-20296f01d6a0
https://publications-cnrc.canada.ca/fra/voir/objet/?id=4cc893fc-1eb9-4657-b36f-20296f01d6a0
NRC Publications Archive
Archives des publications du CNRC
For the publisher’s version, please access the DOI link below./ Pour consulter la version de l’éditeur, utilisez le lien DOI ci-dessous.
https://doi.org/10.4224/20378973
Access and use of this website and the material on it are subject to the Terms and Conditions set forth at
Voice and background noise levels measured in open offices
National Research Council Canada
Conseil national de recherches Canada
Voice and Background Noise
Levels Measured in Open Offices
by
A.C.C. Warnock
&
W. T. Chu
IRC Internal Report IR-837
January 2002
Published by
Institute for
INTRODUCTION
INTRODUCTION
A key variable for predicting speech privacy in open offices is the loudness of speech in such spaces. It is known that the environment influences how loudly we speak. Thus speech levels need to be measured in typical open office situations so they can be used to calculate expected speech privacy more accurately.
This report describes measurements of voice levels normally used in face-to-face conversation in open office environments. The
measurements were made in nine open offices in the Ottawa/Hull Area on behalf of Public Works and Government Services Canada (PWGSC). A companion report1 presents measurements of sound propagation made in the same offices. Background information on open office acoustics can be found in a third report.2
The report also includes measurements of background noise levels made during working hours in the offices.
The measurement team comprised, Keith Lay, Brian Fitzpatrick, Scott Norcross, Wing Chu and Alf Warnock of the Institute for Research in Construction, National Research Council of Canada (NRC).
The report begins with a review of available information about human speech as it pertains to open office acoustics. The following sections describe the measurement procedures and discuss the results obtained. A summary of the background noise measurements is followed by suggestions for future work.
REVIEW OF ACOUSTICAL PROPERTIES OF HUMAN SPEAKERS
REVIEW OF ACOUSTICAL PROPERTIES OF HUMAN SPEAKERS
In most previous studies of human speech levels, subjects usually used “normal conversational speech”. Specifically, speakers were asked to read, at a normal voice level, from stories containing large proportions of conversation, or to repeat a specific phrase continuously. Few subjects were used in these studies except in that by Pearsons and his
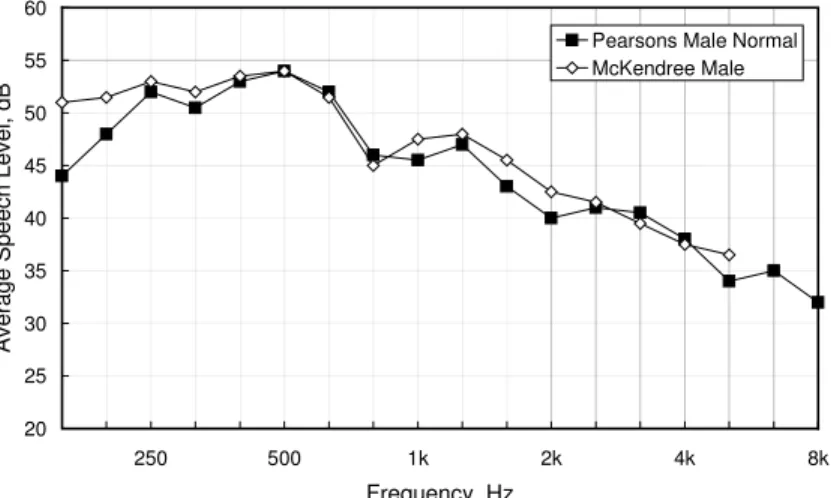
colleagues.3 The laboratory portion of their study was conducted in an anechoic chamber using approximately 100 subjects and the results have been adopted by the ASTM standard 4 for estimating speech privacy in open plan offices. A more recent study by McKendree 5 was also conducted in an anechoic chamber using 56 subjects and provided additional information on the directivity of human speakers. Both the Pearsons and the McKendree results were derived from measurements in which the subjects were asked to recite repeatedly a phrase or a passage of text. Figure 1 and Figure 2 show good agreement of the voice spectra for both the male and female subjects from the two references. 20 25 30 35 40 45 50 55 60 250 500 1k 2k 4k 8k Frequency, Hz Av erage Speec h Lev el, dB
Pearsons Male Normal McKendree Male
Figure 1: Normal male voice spectra at 0.9 m from the subjects’ mouths as reported by Pearsons and McKendree. The overall level is 57.4 dB(A) for Pearsons’ and 58.0 dB(A) for McKendree’s results respectively.
REVIEW OF ACOUSTICAL PROPERTIES OF HUMAN SPEAKERS 20 25 30 35 40 45 50 55 60 250 500 1k 2k 4k 8k Frequency, Hz Av erage Speec h Lev el, dB
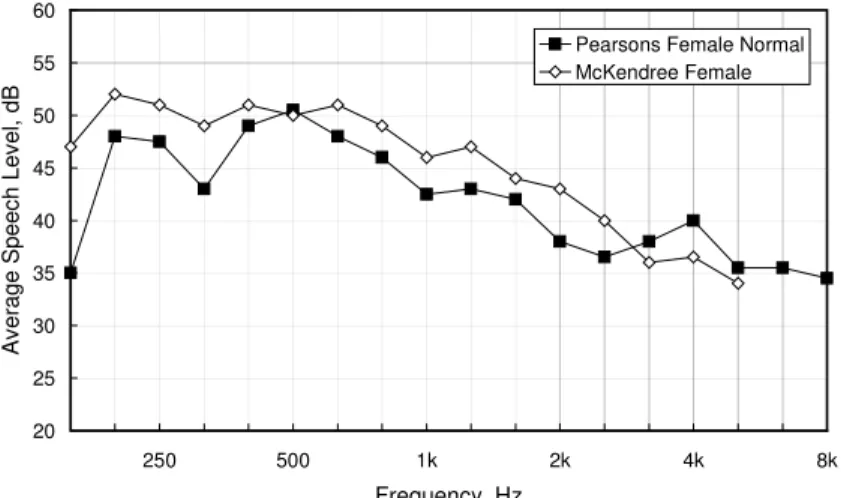
Pearsons Female Normal McKendree Female
Figure 2: Normal female voice spectra at 0.9 m from the subjects’ mouths as reported by Pearsons and McKendree. The overall level is 54.4 dB(A) for Pearsons’ and 56.7 dB(A) for McKendree’s results respectively.
The normal male voice spectrum of Pearsons is currently specified for use as a normal voice by the ASTM E1130 standard. However, a different normal spectrum is provided in the ANSI S3.5 6 standard. The two spectra are shown in Figure 3.
20 25 30 35 40 45 50 55 60 250 500 1k 2k 4k 8k Frequency, Hz Av erage Speec h Lev el, dB ANSI S3.5 1997 ASTM E1130
Figure 3: Spectrum for normal speech defined in ANSI S3.5 (overall level 59.2 dB(A)). Also shown is the Pearsons spectrum adopted by ASTM E1130 (overall level 57.4 dB(A)).
REVIEW OF ACOUSTICAL PROPERTIES OF HUMAN SPEAKERS
Directivity
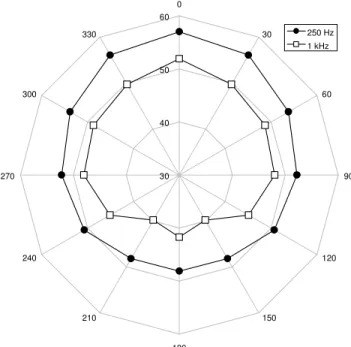
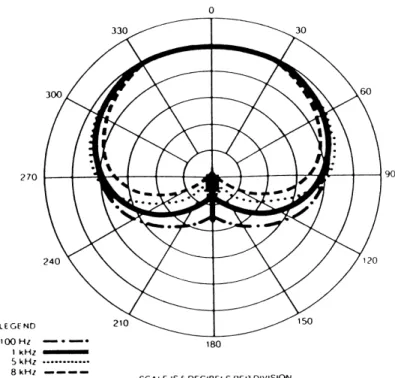
Human talkers do not radiate speech uniformly in all directions. More sound energy is radiated forward than to the rear. Thus it is easier to understand speech when the speaker faces the listener than when the speaker is turned away. To illustrate, Figure 4 shows one measurement of directivity for male talkers for the 250 and 1000 Hz octave bands. Levels directly behind the speaker are about 10 dB below those measured directly in front. Levels to the side are about 5 dB below the frontal levels. This factor can be utilized when planning office layouts.
30 40 50 60 0 30 60 90 120 150 180 210 240 270 300 330 250 Hz 1 kHz
Figure 4: Directivity measured for male talkers for the 250 and 1000 Hz octave bands.
While the directivity of the human head is an important factor, this report deals only with sound levels typical of face-to-face conversations.
MEASUREMENT PROCEDURES
MEASUREMENT PROCEDURES
Nine offices were visited and speech from 118 subjects recorded. Thirteen subjects spoke in French, the rest were in English. The following table provides a listing of the sites, the number of participants at each site, and the primary function of the personnel at each site.
Site No. Office Type Function Subjects
1 team concept with large open spaces
management/administrative;
interior design and planning 8(M),5(F) 2 team concept with large
open spaces
management, administrative &
clerical 3(M),6(F) 3 cubicles assets/facilities management 2(M),5(F) 4 team concept management and administrative 7(M),11(F) 5 team concept with large
open spaces
management and administrative
duties 7(M),9(F) 6 cubicles management and administrative 8(M),8(F) 7 team concept engineering research & design +
project management 9(M),6(F) 8 team concept client service unit (CSU) on
management and administrative 7(M),10(F) 9 team concept management and administrative 2(M), 5(F)
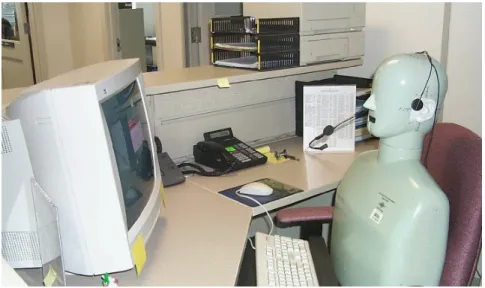
Normally voice levels are provided for a position 0.9 m in front of a talker. These are the levels used in speech privacy calculations. The presence of computer equipment and the infinite variety of reflections from furniture made the use of a microphone 0.9 m from the subject’s mouth impractical in real offices. Instead, a close position recording using a headset microphone (Figure 5) was selected. Levels at 0.9 m were derived from the close microphone levels by a calibration procedure.
MEASUREMENT PROCEDURES
Figure 5: Arrangement of the headset microphone for speech recording. In actual tests, a pop filter was added to the microphone.
Recordings were made for 1 minute with the subject wearing the headset microphone and seated normally at the workstation. The tape recorder was a Panasonic model SV-255 portable digital audio tape recorder that has a dynamic range of more than 87 dB and a flat
frequency response from 10 Hz to 22 kHz. A calibration signal generated by the B&K 4231 Sound Level Calibrator on the headset microphone was recorded both before and after each recording session at a site. This allowed calculation of the absolute speech levels.
Subjects were asked to speak as naturally and freely as they normally would in their workstation to a person sitting next to them (the
interviewer). The speech was to last for 1 minute without interruption from anyone. Any topic could be chosen. To help with making a choice, four suggestions were provided: their job, their last holiday, the town they grew up in, or the route they take to work in the morning. The monologue could be in French or English. The same interviewer was used at each site. The recorded voices were later analyzed in the laboratory using a 1/3 octave-band real time analyzer.
Characteristics of the headset microphone
The headset microphone used in this study was the Audio-Technica ATM73a model. It is a miniature condenser microphone with a cardioid
MEASUREMENT PROCEDURES
response, well suited for speech level measurements. Its cardioid directional response minimized the influence of reflections and
background noise on the speech recordings. It has a useful frequency range from 60 to 15,000 Hz. The cardioid polar pattern of this
microphone is shown in Figure 6. As purchased, the microphone was positioned quite close to the mouth of the wearer. To reduce the effect of any variations in distance between the microphone and the mouth of the talker, the microphone support was modified to hold the microphone further from the mouth of the talker.
Figure 6: Cardioid polar pattern of the headset microphone.
Distance and frequency response correction procedure
Speech level measurements obtained with the headset microphone had to be adjusted to the corresponding levels at a distance of 0.9 m in front of the talker’s lips. This distance from the source is invariably used as a reference point in open office measurements. To obtain corrections for the non-flat response of the headset microphone and distance, a single correction measurement was carried out in the anechoic room. Several subjects were asked to talk in their normal voice wearing the headset microphone in the usual position. At the same time, their voices were
MEASUREMENT PROCEDURES
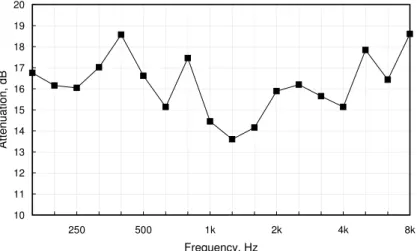
also measured with a ½” B&K microphone placed 0.9 m in front of the speaker. A correction spectrum in 1/3 octave bands was obtained from the average of the several speakers and is shown in Figure 7. The irregularity of the attenuation curve reflects the frequency response of the headset microphone when used in the recording position in front of a talker. 10 11 12 13 14 15 16 17 18 19 20 250 500 1k 2k 4k 8k Frequency, Hz At tenuat ion, dB
Figure 7: Level corrections for both attenuation and the frequency response of the Headset microphone in the actual measurement condition.
Analysis
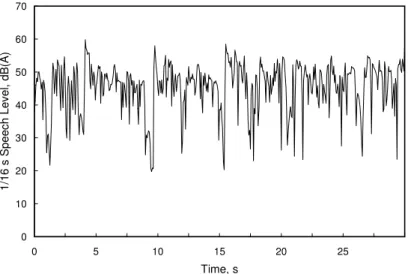
On playback, the best 30 seconds of continuous speech was selected from the one-minute recording of each subject. The speech signal was analyzed in 1/3-octave bands using a B&K 2144 real time frequency analyzer. Using an integration time of 1/16 s, a total of 480 samples were obtained for each 1/3-octave band from 160 Hz to 8 kHz. The data were then transferred to an Excel spreadsheet for further analyses and plotting.
When the speech recordings were analyzed, care was taken to avoid using data that had long periods of dead time. Figure 8 shows a typical time history plot of the short-term A-weighted levels for a subject. Because of the selection procedure, it was not necessary to exclude any dead time periods in the statistical analysis.
MEASUREMENT PROCEDURES 0 10 20 30 40 50 60 70 0 5 10 15 20 25 Time, s 1/ 16 s Speec h Lev el, dB(A)
RESULTS & DISCUSSIONS
RESULTS & DISCUSSIONS
Average speech spectra for different sites
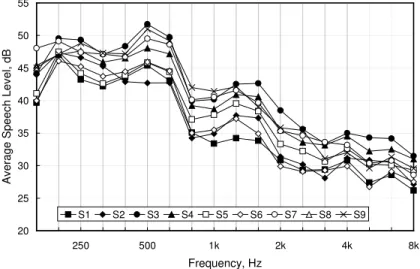
Figure 9 and Figure 10 compare the mean average speech spectra obtained from the male and female subjects at the different sites.
20 25 30 35 40 45 50 55 250 500 1k 2k 4k 8k Frequency, Hz Av erage Speec h Lev el, dB S1 S2 S3 S4 S5 S6 S7 S8 S9
Figure 9: Comparison of the mean average speech spectra obtained from the male subjects at different sites
20 25 30 35 40 45 50 55 250 500 1k 2k 4k 8k Frequency, Hz Av erage Speec h Lev el, dB S1 S2 S3 S4 S5 S6 S7 S8 S9
Figure 10: Comparison of the mean average speech spectra obtained from the female subjects at different sites
Although there are significant variations in the levels of the mean average spectra, the shapes of these spectra are quite similar. Results also show that the variation between sites was more pronounced for the
RESULTS & DISCUSSIONS
male group than for the female group. It is clear from Figure 9 and Figure 10 that the subjects from Site 1 tended to speak more softly than subjects from other sites. Site 1 is distinctively different physically from the others. It has a very high ceiling with few tiles in place and larger open spaces. This is the only site tested where the primary function of the subjects is design and planning.
Distribution of A-weighted L
eqlevels
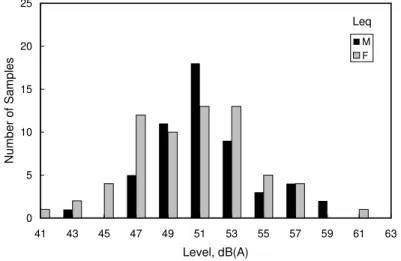
The distribution of average A-weighted sound pressure level for each subject measured in the nine office sites is shown as a histogram in the Figure 11. There is a definite peak at 51dB(A) for the male group, whereas the dominant levels for the female group spread from 47 to 53 dB(A). For all sites, the average male and female voice levels were 51.3 dB(A) and 50.6 dB(A) respectively.
Leq 0 5 10 15 20 25 41 43 45 47 49 51 53 55 57 59 61 63 Level, dB(A) Num ber of S a m p les M F
Figure 11: Distribution of A-weighted speech levels, dB(A), in the nine open plan offices.
RESULTS & DISCUSSIONS
The mean A-weighted Leq values of the speech levels for each site is
given in the following table.
Table 1: Average A-weighted voice levels at each site.
Mean Leq, dB(A)
Site Male Female
1 48.7 47.7 2 48.8 52.4 3 54.7 49.3 4 52.5 52.4 5 50.2 51.2 6 49.7 51.9 7 53.6 50.4 8 51.9 49.1 9 53.8 49.3
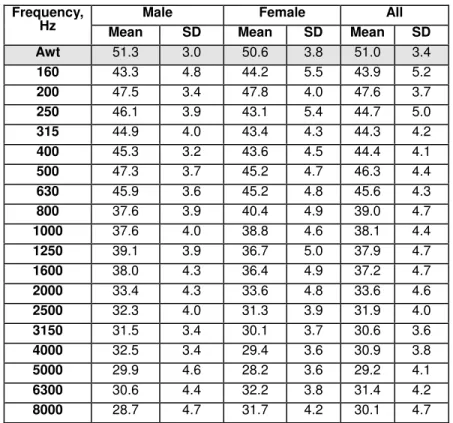
The overall mean spectra and standard deviation for males and females are listed in Table 2. There are significant variations in levels among the different subjects as indicated by the standard deviation shown in the table and plotted in Figure 12. The graph shows that variations among the male talkers were less than those among the female talkers. Table 2: Mean voice spectra and standard deviation (SD) for males and females and all subjects. Average over all sites.
Male Female All
Frequency,
Hz Mean SD Mean SD Mean SD
Awt 51.3 3.0 50.6 3.8 51.0 3.4 160 43.3 4.8 44.2 5.5 43.9 5.2 200 47.5 3.4 47.8 4.0 47.6 3.7 250 46.1 3.9 43.1 5.4 44.7 5.0 315 44.9 4.0 43.4 4.3 44.3 4.2 400 45.3 3.2 43.6 4.5 44.4 4.1 500 47.3 3.7 45.2 4.7 46.3 4.4 630 45.9 3.6 45.2 4.8 45.6 4.3 800 37.6 3.9 40.4 4.9 39.0 4.7 1000 37.6 4.0 38.8 4.6 38.1 4.4 1250 39.1 3.9 36.7 5.0 37.9 4.7 1600 38.0 4.3 36.4 4.9 37.2 4.7 2000 33.4 4.3 33.6 4.8 33.6 4.6 2500 32.3 4.0 31.3 3.9 31.9 4.0 3150 31.5 3.4 30.1 3.7 30.6 3.6 4000 32.5 3.4 29.4 3.6 30.9 3.8 5000 29.9 4.6 28.2 3.6 29.2 4.1 6300 30.6 4.4 32.2 3.8 31.4 4.2 8000 28.7 4.7 31.7 4.2 30.1 4.7
RESULTS & DISCUSSIONS 1 2 3 4 5 6 7 250 500 1k 2k 4k 8k Frequency, Hz St andard D e v iat ion, dB Sigma(Avg)M Sigma(Avg)F
Figure 12: Standard deviations of the average 1/3 octave-band speech levels among the male and female groups
Comparison of the average speech spectra with published standards
Figure 13 compares the mean long-term average 1/3 octave-band speech levels from all 118 subjects with the spectra given by the ANSI and ASTM standards. Results from the current study were significantly lower than those presented by the ANSI or ASTM standards. A possible explanation is that the current study used entirely casual type of
conversational speeches whereas the ASTM standard and possibly the ANSI standard used levels based on reciting fixed texts. In fact,
Pearsons’ results1 have shown that levels from conversational type speech were lower than the levels from reciting texts at normal reading effort. Also shown in Figure 13 are Pearsons’ results for casual
RESULTS & DISCUSSIONS 20 25 30 35 40 45 50 55 60 250 500 1k 2k 4k 8k Frequency, Hz Av erage Speec h Lev el, dB
All field subjects Pearsons Casual ANSI S3.5 1997 ASTM E1130
Figure 13: Comparison of the mean average 1/3 octave-band speech levels.
Figure 14 and Figure 15 compare separately the male and female results with those obtained by Pearsons1. Also plotted in Figure 15 are the mean conversational type speech levels from 4 male subjects measured in the NRC anechoic chamber. Agreement is good.
20 25 30 35 40 45 50 55 60 250 500 1k 2k 4k 8k Frequency, Hz Av erage Speec h Lev el, dB
All male subjects NRC-Anechoic(M) Pearsons-casual(M)
Figure 14: Comparison of the mean average 1/3 octave-band male speech levels.
RESULTS & DISCUSSIONS 20 25 30 35 40 45 50 55 60 250 500 1k 2k 4k 8k Frequency, Hz Av erage Speec h Lev el, dB
All female subjects Pearsons-casual(F)
Figure 15: Comparison of the mean average 1/3 octave-band female speech levels.
Comparison of peak and average speech spectra
ASTM E1130 gives the difference between the peak and the average speech levels in each band as 12 dB. Results from the current study are shown in Figure 16. With the exception of a few low-frequency bands, all the differences are significantly greater than 12 dB although the A-weighted differences are close to 12.
0 5 10 15 20 250 500 1k 2k 4k 8k Frequency, Hz Male Female
Figure 16: Comparison of the mean average levels and the mean peak levels for the male and female groups. The difference between the mean Leq and the mean A-weighted peak values was 12.3 dB(A) for males and 12.2 dB(A) for females.
DAYTIME NOISE LEVELS
DAYTIME NOISE LEVELS
Limited measurements of normal background and activity noise were made at a number of locations in each office during working hours. A short recording was made at each location and 1/3 octave band Leq
levels measured later. The average spectrum measured in each office is tabulated below. A plot of these background noise values is shown in Figure 17. Site number Frequency, Hz 1 2 3 4 5 6 7 8 9 Awt 52 48 46 47 48 41 46 45 44 160 47 48 48 49 40 46 45 41 46 200 46 46 45 48 44 42 44 43 45 250 46 44 42 46 44 39 43 40 43 315 46 41 42 44 42 37 41 40 40 400 46 43 41 42 42 36 41 39 38 500 46 44 41 41 42 35 41 37 40 630 44 41 39 40 41 33 38 36 35 800 44 36 36 38 39 30 37 35 31 1000 41 34 35 38 38 28 36 35 31 1250 40 33 32 35 37 27 35 34 31 1600 40 33 31 33 36 26 32 32 30 2000 38 32 30 33 36 24 31 31 27 2500 36 31 28 31 36 23 30 30 25 3150 35 30 26 28 34 20 27 29 22 4000 32 27 24 25 32 19 26 28 20 5000 30 27 21 23 30 16 24 28 19 6300 28 26 20 19 29 13 22 28 17 8000 25 24 19 19 27 13 20 26 15
These levels combine mechanical noises with noise of human activities. The variability inherent in office activities means that the values
measured in any short space of time are of limited usefulness. They represent only the mean levels measured on one particular day for a few specific periods in a few specific places. A thorough study of activity noise would require long sampling over several days at several positions on each site. The average of the nine average levels measured is 46 dB(A).
DAYTIME NOISE LEVELS 0 10 20 30 40 50 60 250 500 1k 2k 4k 8k Frequency, Hz Lev el, dB S1 S2 S3 S4 S5 S6 S7 S8 S9
Figure 17: Daytime background noise spectra at the nine sites investigated.
During measurements of sound propagation after working hours, background noise levels were measured in some locations. Table 3 lists A-weighted daytime and evening levels for each site.
Table 3: A-weighted daytime and evening noise levels measured in the nine sites.
Daytime Levels Evening
Site Mean Maximum Minimum Range Mean
1 51.7 60.1 47.0 13.1 44.0 2 48.3 51.0 45.6 5.5 45.0 3 46.0 50.7 41.6 9.0 46.4 4 47.4 50.2 45.2 4.9 46.5 5 48.5 51.2 47.7 3.5 47.0 6 40.9 43.7 37.3 6.4 47.4 7 45.8 48.3 41.4 6.9 47.0 8 44.6 49.5 42.0 7.6 47.0 9 43.9 45.2 42.9 2.3 43.0 Mean 46.3 50.0 43.4 45.9
Even this very limited set of data shows that background noise in these offices exhibits considerable spatial and temporal variation. In some cases, the minimum value measured during the day is less than the evening levels. This is because evening levels were only measured for particularly noisy locations where it was thought that the ambient noise might interfere with propagation measurements. Reducing the spatial and temporal variation of background noise is one benefit of a masking
DAYTIME NOISE LEVELS
sound system. Some of the minimum levels measured are significantly below the 45 to 48 dB(A) level usually recommended for a masking system. Thus there would be an increase in privacy if a masking system were introduced. Only one of the offices visited had an operating masking system.
REMARKS
REMARKS
The speech levels were measured when the subjects were speaking to an interviewer sitting less than 1 metre away. They are not appropriate for conversations with co-workers at distances of 3 or 4 metres. It is thought that average voice levels used during telephone conversations are not likely to be very different from those measured in this project but further measurements would be needed to verify this assumption.
The orientation of the speaker can have a significant effect on speech intelligibility. The distribution of sound energy around human heads will be investigated in future work. Data available in the literature on this subject are not sufficiently precise.
Observations in the offices during the recordings verified common experience that the voice level used depends strongly on factors such as the distance between the talker and the listener and the subject of the conversation. Office etiquette can also be a factor. If there is continual pressure from co-workers to speak quietly, then one can expect voice levels to be lower, just as they are in a library setting. Such factors belong in the field of psycho-acoustics.
REFERENCES
REFERENCES
1
"Measurements of Sound Propagation in Open Offices", A.C.C. Warnock and W.T. Chu. Report B3144.2 prepared for PWGSC. August 2000
2
"Guide To Open Office Acoustics", A.C.C. Warnock. Report B3144.1 prepared for PWGSC. August 2000.
3
Pearsons, K.S., Bennett, R.L., and Fidel, S., ‘Speech Levels in Various Noise Environments,’ EPA-6001-77-025, U. S. Environmental Protection Agency, May 1977, p. 39. Available from National Technical Information Services as No. PB-270 053.
4
ASTM E1130 Standard test method for objective measurement of speech privacy in open offices using articulation index.
5
McKendree, F.S., ‘Directivity indices of human talkers in English speech,’ Proceedings of Inter-Noise 86, pp. 911-916, July 21-23, 1986.
6
ANSI S3.5 . American National Standard Methods for the Calculation of the Speech Intelligibility Index.