Can Cable TV Network Boost Broadband Competition in Turkey? Developing Policy Implications for Turkey
by Serdar Ozcan
MACHUSE
I
S MASSACHUSETTS INSTITUTE OF TECHNOL0LGYMAY 2
6
2015
LIBRARIES
B.S. Electrical and Electronics Engineering, Middle East Technical University, 2007Submitted to the Engineering Systems Division in partial fulfillment of the requirements for the degree of
Master of Science in Technology and Policy at the
MASSACHUSETTS INSTITUTE OF TECHNOLOGY June 2015
Massachusetts Institute of Technology 2015. All rights reserved.
Signature redacted
May 8, 2015 Engineering Systems Division
Certified by:
S ignature redacted
David Clark Senior Research Scientist
Accepted by:.
Computer Science and Artificial Intelligence Thesis
Laboratory Supervisor
____Signature redacted_
_
Dava Newman Professor of Aeronautics and stronautics and Engineering Systems Di ector, Technology and Policy Program
Can Cable TV Network Boost Broadband Competition in Turkey? Developing Policy Implications for Turkey
by Serdar Ozcan
Submitted to the Engineering Systems Division in partial fulfillment of the requirements for the degree of
Master of Science in Technology and Policy Abstract
Turkey is one of the most important emerging markets in the world. Considering its young educated population prone to use computer technologies, Turkey can make more benefit from broadband services. Compared with OECD countries, however, current broadband access penetration in Turkey, particularly for fixed broadband service, is quite low. Furthermore, there is a limited competition in Turkish fixed broadband market, which is highly dominated by a single incumbent network.
Different than many developed countries, cable TV infrastructure, which is an important part of facility based competition in fixed broadband market, has not been developed much and it is still owned and governed by the state company called Torksat which is established primarily responsible for national satellite operations. In October 2014, Finance Minister Mehmet 5imsek has announced Turkish government's new privatization agenda covering cable TV operations of Turksat. In this thesis, it is focused on possible effects of the privatization of cable TV network on the competition dynamics of Turkish fixed broadband market and developing policy implications for Turkey to enhance sustainable broadband ecosystem.
The research findings, based on the interviews conducted with experts from Turkish telecommunication and media sector, affirms the government's privatization decision that privatization of cable TV platform is needed because of uncompetitive company behavior and lack of private sector motivations in management under the ownership of state. Moreover, privatization is high likely to enhance consumer welfare.
Although, the service coverage area of the cable platform is low, it has a potential, to make a significant impact on competition with follow up coverage investments. There are economic incentives, complementarily, to invest in network roll out in Turkey. However, there are challenges mainly rising from municipals' attitude toward new infrastructure deployment. Therefore, developing policies triggering investment incentives for network roll out and eliminating the reluctance of municipals toward telecommunication infrastructure development would be the key policy implications to increase the attractiveness of the cable platform auction and to sustain competitive environment after the privatization
Thesis Supervisor: David Clark, Title: Senior Research Scientist
Acknowledgement
First of all, I would like to express my very great appreciation to my thesis supervisor
PhD. David Clark for his support, guidance and valuable suggestions while selecting the research topic and developing the research work.
I would like to extend my thanks all of the TPP family for their support and encouragement during my studies at MIT.
I am particularly grateful for the experts accepted to participate in my research study for their valuable views and suggestions.
I would like to offer my special thanks to my wife Sefika and my son Mahir and my parents Esat and Nursen Ozcan for their great support, encouragement, patience and indulgence during my studies.
Table of Contents
1
Introduction ... 82 Broadband concepts ... 10
2.1 W hatis broadband? ... ... ... ... .. ... . . 10
2.2 Broadband as an economic driver ... 11
2.3 Broadband as an ecosystem ... 13
2.4 Broadband networks... 16
2.4.1 Fixed broadband networks:... 16
2.4.2 W ireless broadband networks... 21
2.4.3 Other broadband technologies... 23
2.5 Broadband com petition... 23
2.5.1 Facility based com petition... 24
2.5.2 Service based com petition ... 24
3 Turkish telecom m unication m arket... 26
3.1 Introduction... 26
3.2 Brief Turkish telecom m unication history ... 26
3.3 Turkish telecom m unication m arket figures ... 28
3.3.1 M arket overview ... 28
3.3.2 Fixed telephony m arket... 30
3.3.3 Mobile m arket ... 32
3.3.4 Broadband m arket ... 34
3.3.5 Digital satellite platforms ... 38
3.5.1 Regulatory institutions... 44
3.5.2 Regulatory regime... 46
4 Country cases ... 51
4.1 UK cable market ... 51
4.1.1 Brief history of cable TV network ... 51
4.1.2 Market figures ... 52
4.2 German cable market ... 62
4.2.1 Brief history of cable TV network ... 62
4.2.2 Market figures: ... 63
4.3 France cable market... 69
4.3.1 Brief history of cable TV network ... 69
4.3.2 Market figures ... 70
4.4 Lessons learned from country cases ... 74
5 Research design and findings... 76
5.1 Research design... 76
5.2 Research findings... 78
5.2.1 Current competitiveness and management of cable TV platform:... 78
5.2.2 Possible effects of cable TV platform privatization to consumer welfare8l 5.2.3 How the cable TV platform should be privatized: fragmented or geographically consolidated?... .. ... ... ... .. ... . . 82
5.2.4 Service coverage area of cable TV platform ... 84
5.2.5 Investment incentives to roll out cable TV network ... 85
5.2.6 Embedding policy objectives into privatization process ... 86
5.2.7 Future of triple play and the existence of killer content ... 88
5.2.8 Implications for current government policies and regulatory actions... 90
6 Conclusion and policy implications... 92
List of Figures
Figure 2-1. Broadband economic impact ... 12
Figure 2-2. Broadband ecosystem... 13
Figure 2-3. Forces shaping the broadband ecosystem in the United States... 14
Figure 2-4. Basic DSL architecture... 17
Figure 2-5. A basic HFC (Hybrid Optical Fiber Coaxial Cable) network architecture. 18 Figure 2-6. FTTX architectures... 20
Figure 2-7 Generations of mobile communication systems ... 22
Figure 3-1. Annual voice traffic volume, billion minutes... 29
Figure 3-2. Fixed-line subscribers and penetration rate ... 30
Figure 3-3. FTS and TT comparison for local calls ... 31
Figure 3-4. FTS and TT comparison for national calls ... 31
Figure 3-5. Breakdown of annual fixed revenues of TOrk Telekom, % ... 31
Figure 3-6. Breakdown of quarterly fixed revenues of Turk Telekom, % ... 32
Figure 3-7. Number of mobile subscribers and penetration rate... 32
Figure 3-8. Market shares according to # of subscribers, %... 33
Figure 3-9. Breakdown of mobile revenues, %... 33
Figure 3-10. Mobile Internet Usage, Tbyte ... 35
Figure 3-11. OECD Fixed (wired) broadband subscriptions per 100 inhabitants, by technology, June 2014... 35
Figure 3-12. OECD Fixed (wired) broadband subscriptions, by technology, June 2014 ... 3 6 Figure 3-13. Distribution of fixed broadband subscribers according to technology and o p e rato r, % ... 37
Figure 3-14. Connection speeds for fixed broadband, 2014 03 ... 38
Figure 3-16. Number of cable internet subscribers... 41
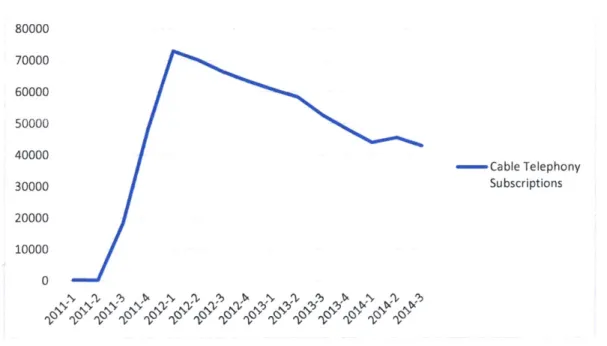
Figure 3-17. Cable telephony subscriptions... 42
Figure 3-18. Cable TV network capacity... 43
Figure 3-19. OECD, availability of cable modem services (%), 2008 ... 43
Figure 4-4. Average broadband speed evolution in UK ... 55
Figure 4-5. UK total broadband penetration (2006-2011)... 55
Figure 4-6. UK Fixed Conncetions: ADSL vs Cable ... 56
Figure 4-7. Retail residential and SME fixed broadband market shares... 57
Figure 4-8. Fixed broadband connections by technology ... 57
Figure 4-9. Virgin Mobile cable broadband and cable TV subscribers... 58
Figure 4-10. Number of broadcast HD homes: BSkyB, Virgin Media, Freesat and F re eview ... 59
Figure 4-11. Number of triple play customer, Sky, Virgin Media, BT ... 59
Figure 4-12. UK broadband penetration and Sky broadband customers... 60
Figure 4-13. Cable broadband coverage and population density map of UK ... 61
Figure 4-14. Broadband connections in fixed networks, Germany ... 63
Figure 4-15. Breakdown of DSL connections ... 64
Figure 4-16. Cable broadband subscriptions... 64
Figure 4-17. Fixed broadband market shares, 2012 Q2 ... 65
Figure 4-18. Kabel Deutschland cable TV network development ... 66
Figure 4-19. Kabel Deutschland subscribers ... 67
Figure 4-20. Unitymedia KabelBW cable TV network development and subscriptions ... 6 8 Figure 4-21. French cable TV subscribers by operator, million... 69
Figure 4-22. Overview of cable mergers, 2004-2006... 70
Figure 4-23. Market share by technology in fixed broadband services, 2013... 70
Figure 4-24. France ISP market shares, 2013 Q4... 71
Figure 4-25. Households eligible for superfast access, by technology ... 72
Figure 4-26. Market share in ultra-fast broadband services, 2013 01... 72
Figure 4-27. Average download speed (kbits/sec), as of 19 April 2012... 73
Figure 4-28. Numericable cable network development, 2009-2014... 74
List of Tables
Table 2.1. Policy actions of three selected countries to enhance broadband
eco syste m ... 15
Table 3.1. Net sales of Thrk Telekom and mobile operators, (Turkish Lira) ... 28
Table 3.2. Net sales of other operators, (Turkish Lira) ... 29
Table 3.3. Number of internet subscriptions by technology ... 34
Table 3.4. ISP market shares*... 37
1 Introduction
In an increasingly globalized world, the Internet has emerged as a crucial technology for communication, commerce, and development (Jensen, 2009). The internet economy brings an enormous opportunity for the governments struggling to find new sources of growth, creating jobs and enhancing the well being of their citizens (OECD, 2013). As it contributes to enhance skills, productivity and innovation, broadband internet access is regarding as a driver of economic growth. From this perspective, development of the national internet infrastructures and attaining higher levels of Internet penetration rates are high in the agenda of most of the countries. Turkey, one of the most important emerging countries in the world, has the opportunity to get more benefit from the internet because of its emerging economic position and youthful demographic profile (McKinsey, 2012), however the current broadband access, particularly fixed broadband, penetration level of Turkey is still quite low compared with the OECD countries.
Telecommunication industry is one of the well known examples of oligopolistic market structure and the lack of competition. High sunk investment costs, scope and scale economies and the network externalities are the main features and the competition barriers of the telecommunication industry. Particularly, Turkish fixed broadband market faces the same lack of competition. It is highly dominated by a single incumbent network operator. Moreover, currently most of the alternative operators' competitive strategy in Turkish fixed broadband market is a form of service based competition in which competitors of the incumbent network operator provide their service over the
facilities of the incumbent network operator.
Cable TV infrastructure, which is an important part of facility based competition in fixed broadband market, different than many developed countries, in Turkey, is still owned and governed by a state company called Turksat. In October 2014, Turkish government announced to privatize its cable TV network facility which also provides high speed broadband access to its customer within some cities of the country. In this study, it is focused on whether the privatization of the cable TV network could boost the competition in fixed broadband in Turkey significantly and to develop policy implications for Turkey to enhance sustainable broadband ecosystem.
In the second chapter of this thesis general concepts of broadband, including broadband networks and broadband competition methodologies, have been examined. Afterwards, in the third chapter Turkish telecommunication market, including market figures, description of regulatory regime and the development of the cable platform, has been studied.
In the fourth chapter, in order to deepen the knowledge about the development of cable TV networks and the understanding of investment and the competition dynamics of cable platforms, brief cable TV network development histories and the market figures relevant with the cable TV business of the selected three countries have been examined in this study too. These countries are United Kingdom, Germany and France. The reasons to select these country cases can be listed as, first, in these countries cable platforms are in the challenging position to the incumbent fixed network operator, secondly, similar with the Turkey, the early stages of the cable platforms have been developed through regional operators, and third, these countries, across Europe, are the comparable countries with Turkey in terms of population.
Research design and research findings are located in the fifth chapter. The research methodology anticipated in this study is expert interviews. Experts are selected from the professionals of the Turkish telecommunication industry, who have extensive experience in regulation, public policy and government relations, as the aim of this study is to develop policy implications. Moreover, to ensure multi-stakeholder approach and to minimize biases, it is intended to reach different parties of the telecommunication industry as much as possible. These stakeholders can be listed as incumbent network operator, alternative network operators, mobile network operators, digital satellite operators and telecommunication associations. The research results mainly based on the answers of the experts during the interview to the predefined questions.
In the sixth and last chapter, based on the research findings, conclusion remarks and policy implications regarding how to boost sustainable broadband competition in Turkey via the privatization of cable TV network have been stated.
2 Broadband concepts
2.1 What is broadband?
The early marketing of residential internet access was started with the narrowband dial-up internet access which serves limited internet access speed over the Public Switched Telephony Network (PSTN). With the advance of new internet access technologies using higher frequency data bands, higher internet access speeds have been reached. Most of the broadband definitions explains this transition from narrowband dial up internet to higher speed internet access. On the other hand, some organizations define broadband as a specific internet access speed level for the practical usage of comparisons and evaluations. Some of the broadband definitions are stated as follows:
According to Federal Communications Commission (FCC):
"Broadband or high-speed Internet access allows users to access the Internet and Internet-related services at significantly higher speeds than those available through "dial-up" services"
According to national regulatory authority of UK, OFCOM (2013), broadband is: "A service or connection generally defined as being 'always on', providing a
bandwidth greater than narrowband."
According to International Telecommunication Union (ITU, 2010), broadband Internet refers to,
"high-speed access to the public Internet (a TCP/IP connection), at downstream speeds equal to, or greater than, 256 kbit/s."
Similar with the ITU, Organisation for Economic Co-operation and Development (OECD, 2009) considers,
"broadband as a service providing Internet access at speeds higher than 256 Kbps,"
Thanks to the rapid development of broadband internet access technologies, contemporary broadband internet access speed standards have become much higher
than the speed level defined as 256 Kbps. Today, many countries set higher minimum broadband access speed targets in line of their policy targets and generates new definitions to monitor the developments. For instance, OFCOM addition to broadband figures monitors high speed broadband access services under a generic name of Superfast broadband. OFCOM (2014) defines superfast broadband as follows:
"Sometimes known as next-generation broadband, super-fast broadband delivers headline download speeds of at least 30Mbit/s"
FCC, a different example, in January 2015 has updated broadband speed benchmark to 25 Mbps for download and 3 Mbits for upload. Additionally, Germany, in its national broadband plan, sets an ambitious target of minimum 50 Mbps broadband access speed. Likewise, many other countries putting broadband access speed targets where a change in the understanding of broadband definition arises.
2.2 Broadband as an economic driver
Broadband services, particularly internet, have become an integral part of human life. It has many aspects and positive impacts on daily life, some of them are studied and some of the others are waiting to be studied. From all of the aspects, the foremost positive impact of broadband is on the economy, which also the main factor stimulating the interest of policy makers.
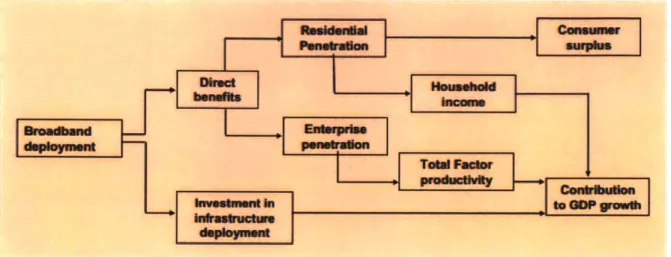
From an economical point of view, broadband can be classified like with other infrastructure services such as electricity, roads and railways, which lead an important transformative impact on nations as they are facilitating new activities (Qiang et al, 2009). These kind of infrastructures leading a substantial change in economic activities are called general purpose technologies (GPT). Information and communication technologies, specifically broadband internet access, are the most remarkable GPT of the twenty first century enabling spill overs all over the economy (OECD, 2008). According to ITU, (2012) economic impact of the broadband networks emerges more than one way. The first impact arises from the direct investment in infrastructure deployment. The second positive impact of broadband networks emerges from the external benefits of broadband usage through consumers and enterprises. The
contributing to economic growth. Although it is not demonstrated in GDP studies, the the consumer surplus arises from the difference between actual broadband service price and the highest price willing to pay by consumer can be regarded as another economic benefit of broadband services (Figure 2-1).
Figure 2-1. Broadband economic impact
Source: ITU, 2012
There are many researches show correlation between broadband deployment and the economic growth from different sub-economic aspects such as employment, business productivity and organizational developments. In a US level econometric study covering the years between 1998 and 2002, researchers have found that the areas having mass broadband access shows higher performance in economical growth in employment, information technology concentrated businesses, and the overall number of business (Lehr et al, 2006). In another US oriented study regarding the economic impact of broadband adoption on the rural areas between the years 2001 and 2010, it is pointed out that broadband adoption in rural areas has positive effects on economic growth on household income and employment levels (Whitacre et al, 2014). In a different macroeconomic level study conducted by Koutroumpis (2009) about the effect of broadband penetration on economic growth regarding 22 OECD countries for the period between 2002 and 2007, it is found out that "there are increasing returns to broadband telecommunications investments, which are consistent with the persistence of network effects".
2.3 Broadband as an ecosystem
Rather than the accustomed static definitions based on minimum internet connection speed and network connectivity type, a different concept regarding broadband has put forward as an evolving ecosystem which is formed by four sub-components namely
networks, services, applications, and users (Kim et al, 2010). Figure 2-2. Broadband ecosystem
S
High-speed
demndW
networksA
aServices
Dl
Applications
Source: (Kim et al, 2010)
As illustrated in the above figure, the broadband ecosystem is a circular convention of the networks, services, applications and users. Networks are the the main supply of the broadband ecosystem, and the network reach outs are driven by the investments of investors, which can be either by public or private, and the demand of the users. Developments in the high speed networks increase the availability of better-quality services for the users and the accessibility of applications to the users. Such an improvement in the service part makes broadband services more affordable and enable the application providers to provide more relevant services from the perspective of users. These advancements on the side of user lead a growth in demand and boost
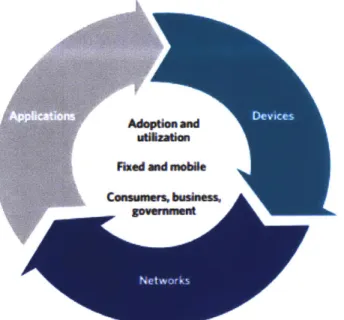
Ecosystem approach to broadband is also anticipated by FCC in its national broadband plan. Different than above structure, FCC defines acting forces on the broadband ecosystem of United States under three parts, namely networks, devices and applications (Figure 2-3).
Figure 2-3. Forces shaping the broadband ecosystem in the United States
Commoms.b~nes
Similar to the previous figure, FCC's broadband ecosystem approach is illustrated as a reinforcing cycle. However, it is distinct from the former by including devices as an important driver of ecosystem and not specifying the services separately. The logic behind the FCC's (2010) broadband ecosystem can be described as follows: when the networks are become speedier, reliable and broadly accessible, firms strive to develop and produce more capable network devices compatible with the networks. These high capable new devices embolden innovators and application providers to develop and innovate attractive applications and the content which is expected to retain current broadband users and stimulate the non-users to subscribe in broadband services. Such an increase in subscription increases the incentives for the internet service providers to upgrade and enlarge their networks.
Broadband ecosystem approach is embraced by policy makers and the scholars for national policy evaluations. That is mainly because that is both covering demand and the supply side of the market for broadband adaptation (Kim et al, 2010). Moreover, its
systematic approach and divided structure enables it to develop tailored policy implications for the needs of each sub-part of the broadband ecosystem. The table given prepared by Torres and Beltran (2011) for a comparative national broadband policy evaluation, can be an example of how the national broadband policies could be classified with broadband ecosystem approach.
Table 2.1. Policy actions of three selected countries to enhance broadband ecosystem
Country Networks Services Applications Users Korea -Public-private - Broadband as a -e-Government, e- - Internet
partnerships to support the value added service commerce, e- education broadband network rollout and a facilities-based learning, e-working programs (backbone and rural service policies -IT training connectivity ) and low -Regulation and -Industrial ICT programs interest for network rollout competition policies policies (R&D, tax -Free access in rural areas (price regulation, and rent reductions; internet and
-Cyber building certification facilitating access to to promote ICT in access in
- Standards for spectrum, universal traditional industries schools interconnectivity and service, VolP such as agriculture)
interoperability regulation, network -Security systems
- Broadband convergence access regulation, in networks
network QoS) - Content promotion
-Subsidized services and applications for to access broadband people with
networks disabilities
Netherlands -Interoperability and - ICT as a solution to -e-Government -e-Skills to standards solve energy and policies particular
* Support ICT research environment -safety/security to groups
networks problems exchange (minorities,
* Municipalities support the -Promote information and unskilled develop fiber networks, infrastructure protecting people workers, civil
* Market players are competition -develop servants, etc.)
expected to invest in applications to - Consumer
broadband infrastructure SMEs protection
-Market intervention is -Stimulate research
through private-public in broadband
partnerships. technology
innovation
New -Public-private -Promote the -Awareness of -Promote
Zealand partnerships to support the reduction of carbon online safety, digital literacy broadband network rollout emissions and security and privacy - Promote in the country: the ultrafast sustainable resource issues digital careers broadband network (UFB) use -Support new digital and ICT skills and the rural broadband -Subsidies for businesses and to strengthen initiative (RBI) computers and business models the workforce
-Allocate spectrum for Internet access * Promote research in ICT industry
wireless broadband access -e-government
- Consultations on NGN policies
2.4 Broadband networks
Broadband networks are classified according to their access technology to the premises or end-users. Generally, broadband networks are divided under two main categories namely fixed and mobile broadband networks. The usage of the term "fixed" expresses the meaning of physical wired connection between the network provider and the end user premises or location, on the other hand the term "wireless" express that network provider access to the end user through air interface via electromagnetic waves (Corning, 2005).
2.4.1 Fixed broadband networks:
Among the fixed broadband access technologies the most widely used are can be listed as DSL, cable and fiber networks. As follows, these three broadband network platforms will be described.
2.4.1.1 DSL networks
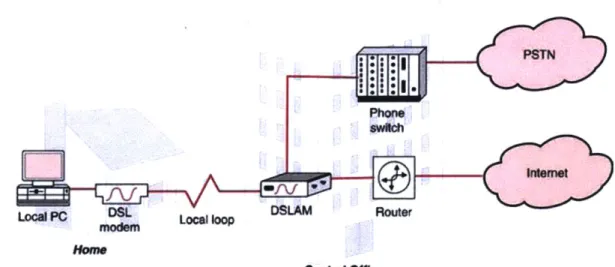
DSL is the most widely used internet access technology in the world; at the end of 2012 more than 57% of the world's fixed broadband subscribers were connecting to internet via DSL connection (Johnson, 2013). Digital subscriber line (DSL), developed by Bellcore in 1989, is the broadband access technology developed on the top of the existing twisted copper lines of PSTN. DSL technologies work over the twisted copper line between the premises and the local exchange point, known as central office, where this operation length is also called as local loop or last mile (Figure 2-4). The length of the loop and other characteristics such as line type and line quality have crucial importance on the quality, speed and availability of the DSL broadband service (Littman, 2002).
Figure 2-4. Basic DSL architecture
Horn.w
cufrmr ome.
Source: MSJC Computer Information Systems.
Local loop, also known as last mile, has another importance from the point of economics. As it is the last mile of the telecommunication network, implying the deployment of twisted lines to each premises in the country, it is the most capital and labor intensive part of the network. Therefore, local loop is not easy to be replicated and regarded as the bottle neck of the telecommunications network. The company holding the ownership of the local loop of the telecommunication infrastructure, called the incumbent operator, has an important and deterrent competitive advantage over its competitors. According to this rationale, many governments have regulated this part of the network to enforce incumbent operator to open its competitors with reasonable conditions. This is also know as Local Loop Unbundling (LLU) or Unbundling of Local
Loop (ULL)
DSL is also a generic name of a standard family of xDSL. Some of them can be listed
as ADSL (Asymmetric DSL), SHDSL (Symmetric High-Bit Rate DSL or G.shdsl), VDSL (Very High-Speed DSL) (Littman, 2002). Asymmetrical digital subscriber line (ADSL) technology is designed for typical residential users who are mostly downloading data
such as internet surfing but uploading lesser. The term "asymmetric" refers to the differentiation of access speeds between downstream and upstream which is higher
for downstream. Symmetrical digital subscriber line (SDSL) provides higher broadband rates both for upload and download, which is appropriate for two way high speed
users. VDSL provides a maximum data download rates between 51 and 55 Mbps for the premises having short length of actual twisted copper lines (Cisco, 2012). VDSL broadband service provision is primarily available for the premises close to the central office, nevertheless, for the premises far from the central office, a new investment is needed to bring network device closer to the street cabinet which will be evaluated in fiber access section in more detail.
2.4.1.2 Cable broadband networks
According to Point Topic (2013) world broadband statistics, as of first quarter of 2013, cable broadband market share is 19%, coming after from copper and fiber broadband subscribers. Cable is not the prevailing platform for broadband services in most of the countries, however, across the OECD countries, United States is the largest exception where cable broadband has the highest market share (OECD, 2014).
First cable TV installation started in United States for backing up the Community Antenna TV. Mainly, it was deployed to re-transmit the broadcast television signals over coaxial cable to the premises having difficulty receiving the air signals. Later on, in 1950s, the first television programing, in 1970s, satellite broadcasts and pay per view content was introduced over cable platforms. One of the important technological upgrade of the cable TV network started from the beginning of 1980s. This is mainly the development of coaxial cable with fiber infrastructure called Hybrid Optical Fiber Coaxial Cable (HFC) which helps to increase the total program carriage capacity of the platform and the signal quality (Littman, 2002).Today, Hybrid fiber Coaxial Cable network architecture is the most common technology used in cable platforms. (OECD, 2014).
Figure 2-5. A basic HFC (Hybrid Optical Fiber Coaxial Cable) network architecture.
TC313
f iber r amnpl.
CATV AN
co"x
node
coaxial copper cable
tap
Source: Shami et al, 2009In HFC architecture fiber network is connected to a mini-coax node, where the transformation between optic signals of fiber and electronic signals of cable conduit occurs. After this node, users are served over a shared coaxial network. Since, in coaxial network users have to share the feeder cable, a closer fiber deployment is needed to reduce the number of users fed from the same coaxial cable, so to increase available data capacity per user. Similar with the logic of Asymmetric DSL, the available data band for downstream is allocated significantly higher than the upstream. (Shami et al, 2009). For the standardization and interoperability purposes, a protocol called DOCSIS (Data-Over-Cable Service Interface Specification) is develop by CableLabs, which is an organization founded by various cable network operators. Specifically, DOCSIS standardizes the physical and MAC layer of the network protocol for service provisioning and management practices (Gorshe et al, 2014). DOCSIS protocols evolved with the versions namely DOCSIS 1.0, DOCSIS 2.0 and DOCSIS 3.0. With DOCSIS 3.0 compatible cable modems, it has been reached to more than
160 Mbps downstream data speed (Cisco, 2010).
Upgrading the one-way cable network, cable TV operator to user, to two way digital communication networking, including the broadband internet access service, needs higher investment than enabling basic DSL service over the twisted copper. Nevertheless, cable networks have higher capacity to provide higher broadband speeds than the twisted copper networks. This is mainly because of the superiority of cable, which is thicker bundles of copper wires enabling higher capacity, over twisted pairs (OECD, 2014)
2.4.1.3 Fiber networks
Fiber optic technology enables the conversion of the electrical data signals to light and the conveyance of the light in a very thin transparent glass fibers (FCC, n.d.). Fiber-optic technology has very high capacity. Even in some sources, it is pointed out that fiber has no bandwidth limit. However, mainly the electro-optical equipment, which has practical limits under the given budget, designate the data speeds of the network (Shami et al, 2009). In laboratory conditions, researches proved that fiber optic medium allows data transmission up to 255 Tbps (Gold, 2014). With the new modulation
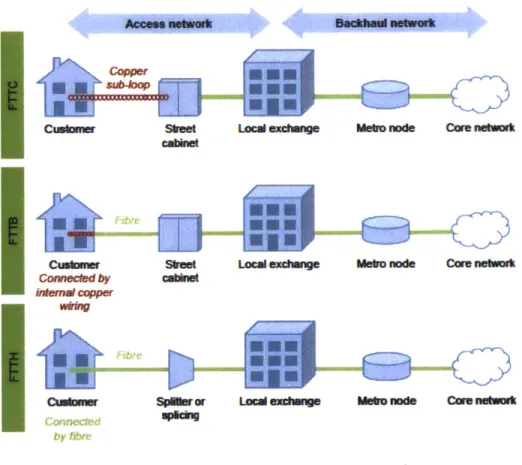
Even though, fiber optic technology is far advance than the other available broadband technologies, from the perspective of network operators, there is a big challenge to deploy fiber network, which is its cost. Despite the decrease in electronic equipment cost of fiber networks, reaching every premise with fiber edge still composes the important portion of total deployment costs (OECD, 2014). As an alternative to direct reaching to the home, network operators developed other fiber access types to minimize the deployment costs. There are three fiber access types called FTTC, FTTB and FTTH, which are also known under the generic name of FTTX (Figure 2-6).
Figure 2-6. FTTX architectures Lccd exdW CoMected by WneMWCAWcpe Skeet Locw.dww MEbumd Msbu no& cm bm ku
Sp~or I Muef n-' cam nguu&
Source: Analysys mason
FTTH council (2011) defines Fiber to the Home (FTTH) as "an access network
architecture in which the final connection to the subscriber's premises is Optical Fiber"
and Fiber-to-the-Building (FTTB) as "an access network architecture in which the final
connection to the subscriber's premises is a physical medium other than Optical Fiber".
In Fiber to the curb (FTTC) architecture fiber network reaches to the street cabinet, as a last point. FTTC is mostly associated with VDSL2 internet access services, which is
known one of the most recent DSL technologies, and it can fulfill 100 Mbps connection rate in short distances and 50-75 Mbps for the distances 1-2 kilometer to the curb (Baker, 2007).
Today most fixed broadband operators use fiber in their backhaul, core and distribution parts of network. The hybrid solutions of broadband networks, up to last mile with fiber and the rest with residual platform; namely HFC for cable and VDSL2 for twisted copper, are capable of transmission of the data rates of FTTH's early data throughputs (OECD, 2013). Besides the maximum data throughput levels and the architectural advantages, many other factors affect the the fiber access deployment level of the network operator. These are can be listed as profitability, ability to generate higher average revenue per unit (ARPU) and the competition between the platforms
(Elixmann et al, 2008).
2.4.2 Wireless broadband networks
In wireless broadband connection, broadband internet access is provided between customer's location and internet service provider's network point through a radio link (FCC, n.d.). Depending on the range and the usage purpose, there are many wireless network types. For instance; wireless local area networks (WLANs) and wireless fidelity (WiFi) are having better performance for isolated and short range wireless connectivity; on the other hand, WiMAX and 4G/LTE are appropriate for wider coverage. Moreover, WiMAX and 4G/LTE are accepted as an alternative to last mile in fixed broadband networks to provide broadband access to customer premises (Bidgoli, 2008). Due to this superiority aspects, these two wireless networks will be covered as follow.
2.4.2.1 Long term evolution (LTE)
Generally, mobile communication systems are classified as generations; first generation, abbreviated as 1 G, represents the analog mobile radio technologies of the 1980s, 2G represents the family of the first digital mobile technologies, 3G is known as the first mobile communication technologies providing mobile broadband access (Dahlman et al, 2014). Some important improvements within generations are stated
3G UMTS performance remarkably, is also known as 3.5G. 4G is the general name of the next generation mobile broadband standards and LTE is one of the members of this family.
Figure 2-7 Generations of mobile communication systems
NMT GSM WCDMA/MSPA LTE
AMPS IS-136 cdma2000
TACS PDC TD-SCDMA
IS-95
Source: Dahlman et al, 2014
From the beginning of the mobile communication standards, there has been a competition among these. LTE is the continuation of the GSM/HSPA standard family which has a pervasive and overwhelming position globally (4G Americas, 2012). As of December 2014, there are approximately 2 billion HSPA subscribers and more than 300 million LTE subscribers around the world (Statista, n.d.).
Compared with the earlier mobile broadband services, LTE offers three distinctive features. First one is full mobile broadband experience with the network performance providing instantaneous download maximum data rate of 100 Mb/s within a 20 MHz downlink frequency band allocation. Second one is enhanced network coverage thanks to operating frequency of 700 MHz spectrum band having penetration superiority. Third and the last one is improved data connectivity through enabling the mobile broadband network for the connection of different types of devices (AT&T, 2015).
2.4.2.2 WIMAX
WiMAX (worldwide interoperability for microwave access) is a point to multipoint network solution for wireless metropolitan area broadband access, based on the IEEE 802.16 standard. The WiMAX network provides high speed broadband connection within a wide service coverage area up to several tens of kilometers (Shami et al, 2009). With this outstanding feature, WiMAX technology offers a cost effective solution high speed broadband access solution where it is costly to deploy a fixed network, particularly for rural areas (Poole, n.d.).
Certification and promotion of compatibility and interoperability of WiMAX network products have been governed by WiMAX Forum which is an industry led, non profit organization. WiMAX has a maximum theoretical data throughputs of 75 Mbps for downlink and 30 Mbps UL (Middleton, 2009). As of 2014, there are 33.4 million worldwide WiMAX subscribers (Statista, n.d.)
2.4.3 Other broadband technologies
Although the aforementioned broadband technologies are widespread, there are other broadband access services depending on other technologies. Broadband over Power line, which is known as BPL, is another broadband technology providing high speed internet access over power lines. Communication satellites also provide broadband access service, known as satellite broadband. However, it is a rather expensive service and practically serves to locations where there is no coverage with common broadband technologies. There are other broadband internet access technologies in experimental level, one of the popular example is Google's project loon which enables internet access through the balloons floating in the stratosphere.
2.5 Broadband competition
Like other infrastructure industries, telecommunication industry regarded as natural monopoly because of high sunk costs, scale and scope economies. Opening this industry to competition is high in the agenda of many policy makers and governments caring the strategic importance of ICT, particularly broadband services. To promote competition in telecommunication industry, regulators and policy makers have come up with the question which method do they need to follow; either service competition, which is based on a single infrastructure with regulated access or facility based competition, which is boosting parallel infrastructures competing each other (Hoffler, 2007). It is observed that, in most of the sources, facility based competition is regarded as inter-platform competition and service competition as intra-platform competition, however there are also different notations and categorizations of these terms. There is a significant number of researches and literature about the relation between broadband competition and the broadband adoption. The tendency about these researches is pro
there is no significant contribution found about a relation between facility based competition and broadband adoption (Fageda et al, 2014).
2.5.1 Facility based competition
Bourreau and Dogan (2004) claim that, controlling supply chain of its operations with the highest extension is necessary for an operator to attain long term efficiency through harnessing the benefits of flexibility and innovation, where it is much likely achievable in facility based competition. The main drawback in this competition policy is the inefficient duplication of existing broadband network, nevertheless, according to H6ffler (2004) this inefficiency might be recouped from the deadweight loss due to imperfect competition. There are many studies showing the positive impact of facility based competition on the adoption of broadband. The results of the empirical study conducted by Aron and Burnstein (2003), indicate that facility based broadband competition between DSL and cable modem has an important positive impact on broadband adoption. Similarly, in another research based on the data for 14 European countries, it is emphasized that the higher competition between broadband technologies is "the main driver to stimulate broadband adoption" (Distaso et al, 2006). In a different study based on the across 20 OECD countries for the period between December 2003 and March 2008, research results put forth that inter-platform competition has a positive significant impact on broadband adoption, reversely, service based intra-platform competition has a remarkable negative impact on the broadband adoption (Bouckaert et al, 2010).
2.5.2 Service based competition
According to Pindyck, for the network industries having quasi-monopolistic market structure, service based competition is regarded as crucial for stimulating market entry and having the prices lower in short term (Briglauer et al, 2013). Particularly for telecommunication industry and broadband service, mandating incumbent telecom operators to unbundle their local loop and enforcing them to provide interconnection to their competitor ISPs under regulated prices are the common methods to induce competition. As it does not need to build up a parallel network, in other words as it relies on the existing DSL infrastructure, it is also the easiest and the fastest way to boost market entry via DSL broadband service (Distaso et al, 2006). After making market entry easier with service based competition, it is expected from competitors to
build their own network and ultimately to reach a facility based competition. However, from the point of sustainability and effectiveness about service based competition there are many critics arises. Bourreau and Dogan (2004) figure out that service based competition has deterrent effect on facility based competition, where incumbent can strategically delay the development of competitor's facility through setting attractive prices for its access service.
Determination of the access prices is another important issue to be handled by regulators in service based approach. It is expected from the price level to be a balance state between enabling market entry easier but no to deter the investment incentives of the incumbent operator. Long run incremental cost (LRIC) approach is the common method anticipated by many national regulatory authorities to determine the access service prices. Nevertheless, Hausman criticizes the TELRIC (a specific type of LRIC) approach based regulated prices that are neglecting the high sunk costs of telecommunication industry and too low to encourage investments (Cambini and Jiang, 2009).Lastly, there are not many studies indicating the positive impact of service based on broadband adoption. In one recent research regarding broadband adoption in Spanish market, it is found that intra-platform is the main factor to increase broadband adoption, while inter-platform competition has no effect on the expansion of broadband services (Fageda et al, 2014)
3 Turkish telecommunication market
3.1 Introduction
Turkey is one of the most important emerging markets in the world with its population more than 77 million and the size of around 780.000 km2 located between Europe and the Asia. According to the World Bank data, Turkey is the 18th largest economy in the
world with a gross domestic product (GDP) of $822 billion. In addition, across European countries, Turkey has the largest young population with 16.6 percent (Anadolu Agency, 2014).
Turkey is the member of the many important international organizations such as Organisation for Economic Co-operation and Development (OECD), G-20 major economies, North Atlantic Treaty Organization (NATO) and Organisation of Islamic Cooperation. Moreover, Turkey has started full membership negotiations with European Union in October 2005, and continuing alignment of its national legislation particularly for telecommunication sector under the scope of EU enlargement chapter 10 called information society and media.
Turkish telecommunication sector is one of the important economic drivers of the country with the annual economic size around 35 billion Turkish Lira'. However, it deserves much better figures particularly for fixed broadband penetration which is relatively low compared with the developed countries. Considering its emerging economy and young population, Turkey has a significant potential to unleash economical growth from broadband internet (McKinsey, 2012)
3.2 Brief Turkish telecommunication history
Posts, Telegraph and Telephone (PTT) was the state monopoly of Turkey regarding telecommunication services starting from the early dates of Republic of Turkey. During the years between 1980 and 1984, an important telecommunication infrastructure build up movement carried out by PTT, resulted a significant increase in the number access lines (Telli, 2011). In 1994, as a part of state policy regarding the privatization of the
telecommunication services, telecommunication services were split from postal services and TOrk Telekom A.S. (TTAS) was established as a state company (Atiyas and Doyan, 2007). Although it was established in 1994, the privatization of Turk Telekom could be made in 2005. In 2005, 55 percent of TOrk Telekom's share has been sold to a private company called Oger Telecom for 6.55 billion US dollars. This was the end of direct state control over TOrk Telekom and one of the most important liberalization event of the Turkish telecommunication market (Bagdadioglu and Cetinkaya, 2010).
Before the liberalization of TOrk Telekom, in 1994, the first important step in liberalization was the signing of the revenue sharing agreements between Thrk Telekom and the private companies namely Turkcell and Telsim to provide GSM services over 900 MHz frequency band. Later on, these revenue sharing agreements were licensed by Ministry of Transport in 1998 (Atiyas and Dogan, 2007). In 2000, Turkish independent telecommunication authority has been established. As seen in the licensing regime of the Turkcell and Telsim, up to 2000, regulatory issues regarding telecommunication were handled by Ministry of Transport. The same law establishing Turkish independent telecommunication authority also abolished the monopoly rights of Turk Telekom over fixed telephony services that would be effective as of 1 January
2004 (Burnham, 2007).
The third GSM license owner 1 -TiM which was operating under the brand name of Aria and the fourth license owner Aycell, Tork Telekom's GSM Operator, were started mobile service operations in 2001. However, in 2004 Aria and Aycell, later on, have merged under the name of Avea where majority shares of it belongs to Turk Telekom. Lastly, Telsim purchased by Vodafone group in 2005 and then Turkish mobile communication sector has settled with present three mobile network operators state; Turkcell, Vodafone and Avea. In 2009, all three mobile operators have attended to the 3G spectrum auction and have been providing 3G services since July 2009. As of March 4, 2015, Ministry of Transportation Maritime and Communication has announced to start tender process of 4G services.
3.3 Turkish telecommunication market figures
Information and Communication Technologies Authority (ICTA) of Turkey is the main responsible body to collect and publish the official data of telecommunication market. As a practice of ICTA, it publishes communication reports quarterly. In this part of the chapter, it will be passed over the some of the main figures of these market reports. 3.3.1 Market overview
According Information and Communication Technologies Authority's data about the term 2014 Q3, there are total 654 operators with 1094 authorizations operating in Turkish telecommunication market. Of all these authorizations seven of them refers to the concession agreements between ICTA and Turkcell, Vodafone, Avea and Turk Telekom. As Turksat is government owned satellite and cable TV company, it is operating according to the authorization agreement between Turksat and ICTA. The rest of the authorizations are general authorization practices of the authority called either authorized by notification or authorized by the right of use depending on whether the scarce resources are used or not.
When it is looked to the net sales tables of the Turkish telecommunication market below (Table 3.1 and Table 3.2) the total annual net sales is around 35 billion Turkish Lira2. Three mobile operators and the fixed incumbent operator Turk Telekom generate
80% of the total net sales, other operators including cable TV correspond to the rest 20 percent. Among the mobile network operators, Turkcell has the highest annual net sales around 9 billion Turkish Lira where the total of its mobile competitors Avea and Vodafone is around 10.5 billion Turkish Lira.
Table 3.1. Net sales of Turk Telekom and mobile operators, (Turkish Lira)
1.810.509.445 1.817.517.743 11.841.304.824 1.864.910.968 1.968.569.071
2.365.114.942 2.239.520.050 2.204.904.252 2.295.798.874 2.477.025.035
1.468.827.698 1.496.734.109 1.584.537.273 1.617.740.772 1.726.949.041
972.605.176 943.458.183 957.083.201 1.055.891.809 1.143.942.329
6.617.057.261 6.497.230.085 6.587.829.551 6.834.342.423 7.316.485.475
2 According to the Central Bank of the Republic of Turkey, 1 US dollar is 2.34 Turkish Lira as of January 2'd 2015
Table 3.2. Net sales of other operators, (Turkish Lira) 1.035A72.403 1.186.313.849
I1.151.274A15I
1.178.104.243 1.184.990.337 278.027.268 266.149.367 269.898.385 292.080.183 297.090.202 134.931.694 141.024.831 156.914.030 167.370.274 170.349.056 61.849.689 75.567A18 64.058.866 67.719.903 60.220.838 21.358.769 18.785.663 15A59.780 16.803.773 22.892.570 89.827.987 100.501.499 110.534.588 105.148.267 109.019.212 3.882.222 3.508.254 2.143.905 3.755.230 2.227.269 3A58.719 3.332.752 4.400.977 5.099.146 4.221.024 1.628.808.751 1.795.183.633 1.774.684.947 1.836.081.019 1.851.010.508Between 2009 and 2013, the annual voice traffic volume of the Turkish telecommunication market has increased from 132.2 to 202.6 billion minutes (Figure 3-1). However, during these years the traffic originated from fixed networks has decreased from 23.9 to 16.7 billion minutes. As of 2013, fixed networks were generating only 8.2 percent of the
2009. On the other hand, mobile
total voice traffic while this ratio was 18 percent in originated voice traffic has increased 71 percent during the stated years.
Figure 3-1. Annual voice traffic volume, billion minutes 220 200 180 160 140 120 100 80 60 40 20 0 189.2 2009 2010 2011 2012 2013
Mobile - Fixed =ROTota
202,6 i
3.3.2 Fixed telephony market
The figure stated below (Figure 3-2) shows the number of fixed line subscribers and the penetration rate. From the year of 2008 to the third quarter of 2014, fixed line subscribers has decreased 27.1 percent, overall there has been a loss of 4.75 million subscribers in fixed market. This figure also in correlation with the reduction of fixed Annual Voice Traffic Volume, where it shows the trend in Turkish telecommunication market that fixed voice service is mostly replaced by mobile telephony. In addition, similar with the reduction in the number of fixed subscribers, penetration rate has been decreasing within the specified interval.
Figure 3-2. Fixed-line subscribers and penetration rate
-- 28 16 24 161 14MM W2 12 16 10 0 8 12 6 8 4 4 2 0 0 2008 2009 2010 2011 2012 2013 2014-1 2014-2 2014-3 m# of Subscribers -n-Penetration
Figure 3-3 and Figure 3-4 show the percentage distribution of the calls between incumbent network operator Turk Telekom (TT) and other fixed telephony service (FTS) providers. For the local calls, Turk Telekom holds the dominant position with the level of 85.55 percent whereas FTS providers having the rest 14.45 percent. The market of fixed national calls is relatively more competitive. Turk Telekom's share has been decreasing around 12 percent during the period between the first quarter of 2013 and the third quarter of 2014, lasting around the level of 67%, whereas this level is around 33% for FTS providers. The relative difference between national and local call distribution also implies the situation that FTS providers having hardness to deepen their business to the local exchange levels.
Figure 3-3. FTS and TT comparison for local calls 100 -so * 40 20 0 sin6 U=* p p p A A A 2013-1 2013-2 2013-3 2013-4 2014-1 -Tr "m.FTS
Figure 3-4. FTS and TT comparison for 100 60 40 - 2 0-VA IM, ts~, as.% 14,s 2014-2 2014-3 national calls 79,14 79,16 7S.56 -'I.4B 2013-1 2013-2 2013-3 2013-4 AMMMT MUPFrs
Breakdown of annual and quarterly fixed revenues of about the trends in fixed market. Between the years
7167,16
32.4
2014-1 2014-2 2014-3
Turk Telekom gives much insight 2009 and 2013, PSTN revenues had the highest revenue item and the second one was the access revenues covering the broadband products. However, within the second quarter of 2014 leadership has changed and access revenues have become the highest revenue item. Between the years 2009 and 2013, percentage of leased line revenues has decreased remarkably from the level of %7.57 to %4.29. Lastly, share of the other services of Turk Telekom has been increasing significantly particularly for the last three quarters of 2014.
Figure 3-5. Breakdown of annual fixed revenues of Turk Telekom, %
2013 2012 2011 M 2010 2009 LW* Mu~ up"1 28.92 AMM
Figure 3-6. Breakdown of quarterly fixed revenues of Turk Telekom, % 2014-3 2014-2 -2014-1 2013-4 2013-3 2013-2 2013-1 0% 10% 20% 30% 40% 50% 60% 70% 80% 90% 100%
N PSTN N Access V Leased Lines U Interconnection U Other
3.3.3 Mobile market
The figure stated below (Figure 3-7) shows the number of mobile subscribers and the penetration rate. The year 2008 was an overshoot point for the mobile industry, mainly because of the number portability regulation and termination rate reductions by ICTA, multiple telephony usage and so the overall mobile telephony penetration had decreased within the consecutive two years of 2008. In July 2009, three mobile operators has started 3G operations. As of 2014 third quarter, 79 percent of all mobile subscribers are having 3G subscriptions. Since from the year of 2010, the number of mobile subscribers and penetration rate has been increasing gradually. The latest point achieved in the total number of mobile subscribers is 72 million corresponding to penetration rate of %93.8.
Figure 3-7. Number of mobile subscribers and penetration rate
go - 92,1% 86,5% 83,8% 87,4% 89,5% 90,9% 91,5% 92,3% 93,8% 70 -80%* 60 _ 50 - 60% 2 40 -30 - 4 20 20% 10 , 0 - 0% 2008 2009 2010 2011 2012 2013 2014-1 2014-2 2014-3 12G Subscribers 3
Compared with the fixed market, Turkish mobile market is rather competitive. Turkcell, however, has a prevailing leadership in the market with the market share of around 50 percent of total mobile subscribers (Figure 3-8). On the other hand, there has been a gradual improvement in Herfindahl-Hirschman Index (HHI). According to Figure 3-8 this index was 3917 in 2012 first quarter but it has decreased to 3718 in 2014 third quarter.
Figure 3-8. Market shares according to # of subscribers, %
100%
80%
40%
20%
2012-1 2012-2 2012-3 2012-4 2013-1 2013-2 2013-3 2013-4 2014-1 2014-2 2014-3
U Avea a Vodafone *Turkcell
Although, it has decreased around 15 percent between the years 2008 and 2013, the voice revenues are still the most important revenue item in Turkish mobile market (Figure 3-9). As 3G services has been started in 2009, since that date, the share of data revenues have been increasing remarkably. SMS and MMS revenues had reached the highest revenue percentage with %11.61 in 2011, nevertheless it has decreased within the consecutive years. That is mainly considered because of the competitive pressure arising from over the top messaging applications.
Figure 3-9. Breakdown of mobile revenues, %
100% -80% -60%
-40% -20%
-3.3.4 Broadband market
The total fixed broadband connections is around 8.6 million in Turkey. The majority of fixed broadband subscribers connect to the internet over xDSL technology and this number has reached 6.7 million people as of 2014 third quarter. The annual growth rate of xDSL subscription is very low, around one percent. The second highest broadband subscription by technology is fiber broadband access which is around 1.4 million. Contrary to DSL, the annual growth rate of fiber is quite high and it has grown 44 percent within the last year. Cable internet is the third most common fixed broadband internet connection type, with the subscriber level around half million. It has a 6.6 percent annual growth rate for the last annual term (Table 3.3).
Table 3.3. Number of Internet Subscriptions by Technology
6.662.999 6.655.076 6.721.902 1,00% 0,88% 967.309 1.330.922 1.393.614 4,70% 44,07% 483.046 496.038 514.965 3,80% 6,61% 1.742.995 1.379.300 1.277.070 -7,40% -26,73% 21.099.677 27.066.363 29.826.976 10,20% 41,36% 120.159
Source: ICTA 2014 Q3, modified by author
105.103 103.165 -1,80% -14,14%
The number of subscribers having mobile internet connection from mobile handsets has reached to almost 30 million. The total increase in this number within the last annual term is close to 9 million which is a growth rate around 41 percent. On the other hand, the number of subscribers having mobile internet connection from computers through the devices like USB modem sticks has decreased to 1.3 million level from 1.74 million within the last annual term. The total mobile internet usage has more than
doubled from 2013 Q3 to 2014 Q3 and it has reached to the 84.940 Tbyte level (Figure 3-10).
Figure 3-10. Mobile Internet Usage, Tbyte
2013-3 2013-4 2014-1 2014-2 2014-3
Although there is an upward progress in the number of fixed broadband subscriptions in Turkey, the current level of fixed broadband penetration is quite low compared with OECD countries. According to OECD cross country comparison about fixed (wired) broadband subscriptions per 100 inhabitants, Turkey is in the last position with the level of 12 whereas OECD average is around 27 per 100 inhabitants.
Figure 3-11. OECD Fixed (wired) broadband subscriptions per 100 inhabitants, by technology, June 2014
55
-50 - mOther Fibre/LAN (1) Cable m DSL
45 - 40--35 OECD average 30 25 20 15 10 5 0
The figure stated below shows the distribution of the fixed broadband subscriptions by technology, among the OECD countries. According to OECD average DSL subscriptions constitutes 51.5 percent of the whole fixed broadband subscriptions. Cable modem has the second portion with 31.4 percent and the fiber has the third portion with 16.5 percent.
Figure 3-12. OECD Fixed (wired) broadband subscriptions, by technology, June 2014
Cable Modem 31,4% Fibre + LAN 16,5% DSL 51,5% Other
Total subscriptions: 344.6 million 0,6%
Source: OECD
Similar with the OECD average, fiber broadband access corresponds to the 16 percent of fixed broadband connections in Turkey. However, cable subscription level which is 6 percent of fixed broadband connections is far below than the OECD average that is 31.4%. In Turkey DSL connections corresponds to the 77 percent of all fixed broadband subscriptions that s considerably higher than the OECD average %51.5. One of the most remarkable point in Figure 3-13, showing the distribution of fixed broadband subscribers according to technology and operator is the dominance of xDSL service by a single operator TTNet, which is the subsidiary of the fixed incumbent