Publisher’s version / Version de l'éditeur:
Journal of Analytical Atomic Spectrometry, 15, 9, pp. 1223-1232, 2000
READ THESE TERMS AND CONDITIONS CAREFULLY BEFORE USING THIS WEBSITE. https://nrc-publications.canada.ca/eng/copyright
Vous avez des questions? Nous pouvons vous aider. Pour communiquer directement avec un auteur, consultez la
première page de la revue dans laquelle son article a été publié afin de trouver ses coordonnées. Si vous n’arrivez pas à les repérer, communiquez avec nous à PublicationsArchive-ArchivesPublications@nrc-cnrc.gc.ca.
Questions? Contact the NRC Publications Archive team at
PublicationsArchive-ArchivesPublications@nrc-cnrc.gc.ca. If you wish to email the authors directly, please see the first page of the publication for their contact information.
Archives des publications du CNRC
This publication could be one of several versions: author’s original, accepted manuscript or the publisher’s version. / La version de cette publication peut être l’une des suivantes : la version prépublication de l’auteur, la version acceptée du manuscrit ou la version de l’éditeur.
For the publisher’s version, please access the DOI link below./ Pour consulter la version de l’éditeur, utilisez le lien DOI ci-dessous.
https://doi.org/10.1039/b002204g
Access and use of this website and the material on it are subject to the Terms and Conditions set forth at
Use of Ar-He mixed gas plasmas for furnace atomization plasma
ionization mass spectrometry (FAPIMS)
Stewart, I. I.; Sturgeon, R.
https://publications-cnrc.canada.ca/fra/droits
L’accès à ce site Web et l’utilisation de son contenu sont assujettis aux conditions présentées dans le site LISEZ CES CONDITIONS ATTENTIVEMENT AVANT D’UTILISER CE SITE WEB.
NRC Publications Record / Notice d'Archives des publications de CNRC:
https://nrc-publications.canada.ca/eng/view/object/?id=31bf2952-1293-4d0a-ae61-1e477731ac1b
https://publications-cnrc.canada.ca/fra/voir/objet/?id=31bf2952-1293-4d0a-ae61-1e477731ac1b
Full
Paper
Use of Ar±He mixed gas plasmas for furnace atomisation plasma
ionisation mass spectrometry (FAPIMS){
Ian I. Stewart* and Ralph E. Sturgeon
Institute for National Measurement Standards, National Research Council of Canada, Building M12, Montreal Road Campus, Ottawa, Ontario, Canada K1A 0R6.
E-mail: ian.stewart@nrc.ca
Received 23rd March 2000, Accepted 27th June 2000 Published on the Web 24th August 2000
The effect of Ar±He mixed gas plasmas on analyte signal intensities generated in a furnace atomization plasma ionization mass spectrometry (FAPIMS) source is presented. Analyte is introduced as a volatile headspace gas ef¯uent (I2(g)and Hg(g)) and in discrete liquid sample volumes (Fe, Rb, Pd, In, Cs, Yb, Pt, Pb and Bi). The
presence of as little as 2±10% (v/v) Ar increases the signal intensity of analytes having ®rst ionization potentials greater than 6 eV by up to 10-fold. This may be attributed to the formation of more energetic plasmas whose electron density, ionization temperature and gas kinetic temperatures increase with Ar content. Consistent with this, elements with the highest ionization potentials showed the greatest enhancements. Analytes with ionization potentials of less than 6 eV, which are already presumed 100% ionized, are unaffected. Further increases in Ar content (50±100% v/v) can lead to plasma instability and accelerated erosion of graphite surfaces within the source. Most of the analytes studied showed slight improvements in the limits of detection for plasmas containing #5% v/v Ar; the increased signal intensity was accompanied by little or no increase in the background signal. Although Ar can signi®cantly affect conditions within the source, the composition of the Ar±He mixture can also in¯uence the transmission of analyte into the free jet expansion and to the MS detector. The appearance and intensity of Ar-based spectral interferences, such as ArCz
, ArOz
and Ar2z,
increase with Ar content and source temperature, degrading the determination of species such as52Crz
,56Fez
and80Sez
. The amount of Ar required to generate signi®cant signal enhancements is small (v10% v/v) and therefore does not signi®cantly ease the pumping requirements on the interface.
Introduction
Furnace atomization plasma ionization mass spectrometry (FAPIMS) is a relatively new technique that has demonstrated great potential for trace element analysis.1,2 In FAPIMS, a
small sample volume (e.g., 2±10 mL) is injected through a dosing port into a transversely heated, integrated contact cuvette (ICC) graphite tube furnace.3,4 Application of a
suitable furnace program serves to vaporize/atomize sample directly into a capacitively coupled He plasma formed between an axial graphite rod electrode and the grounded wall of the ICC furnace (i.e., within the annular volume of the furnace). The analyte is ionized in the plasma and rapidly sampled into the mass spectrometer through a two-stage sampler/skimmer interface. A signi®cant advantage of this source design is that analyte is transported into the MS, thereby avoiding transport losses due to analyte deposition between the vaporiser and plasma normally associated with other coupled sources such as ETV-ICPMS.5 The current FAPIMS sampling con®guration provides a precision of #5%, linear dynamic range of 3±4 orders of magnitude and estimated absolute limits of detection of 20±500 fg for Mg, Fe, Co, Cu, Se, Cd, Cs and Pb.2
The use of He plasmas as an ion source has already been demonstrated for FAPIMS.1,2,6In addition to being readily initiated and easily sustained, He plasmas offer several potential advantages over their Ar counterparts.7These include a limited number of possible spectral interferences due to the near mono-isotopic abundance (99.999%) and low mass (4 amu) of He. Also, the high ionisation energy (24.48 eV) and the presence of a number of energetic species (such as Hez
, He2z, Hem*) augment the detection capability of dif®cult to
ionise elements. Despite such advantages,2further optimisation and development of the source are necessary to provide the general robustness required for use with real samples. It is anticipated that such improvements would be relevant to analogous atmospheric pressure He rf plasma sources used for the MS detection of atomic and molecular ions in gas ef¯uents.8
One promising new approach to improving the overall sensitivity and capability of the FAPIMS source is through the use of Ar±He mixed gas plasmas. Sun and Sturgeon9,10have demonstrated that emission intensities for a number of atom and ion lines are signi®cantly enhanced when Ar±He plasmas are sustained within the FAPES source. Changing the gas composition from a pure He plasma to a pure Ar plasma increases the analyte ionization temperature (5270 to 6740 K), electron number density (i.e., He 861013cm23, Ar
161015cm23) and gas kinetic temperature, thereby generating
a more `energetic' plasma.9As such, the degree of ionization for elements having ionization potentials below 8 eV has been calculated to increase from w50% in pure He plasmas to w70% in argon plasmas in a FAPES source operated at 50 W.9 Although the exact mechanism responsible for the increased ionization ef®ciency is unknown, it is certainly consistent with the formation of more energetic plasma conditions. In addition, speci®c Penning and charge transfer reactions between analyte and energetic argon species may be important for some elements.9,10 In the FAPES source, however, increased analyte sensitivity did not lead to improved limits of detection (LODs) due to increased spectral interference from molecular background species.10 Although direct spectral interferences may still occur with MS detection, the number of broad spectral overlaps from background species observed in FAPES11±13should be less severe in FAPIMS. The use of He-Ar mixed gas plasmas in the FAPIMS source, therefore,
{Presented at the 2000 Winter Conference on Plasma Spectro-chemistry, Fort Lauderdale, FL, USA, January 10±15, 2000.
DOI: 10.1039/b002204g J. Anal. At. Spectrom., 2000, 15, 1223±1232 1223 This journal is # The Royal Society of Chemistry 2000
Published on 24 August 2000. Downloaded by National Research Council Canada on 13/11/2015 20:48:47.
presents a potentially attractive means of improving the ionization ef®ciency and sensitivity for a wide range of elements, especially those for which the ®rst ionization potentials are ¢8 eV.
In this study, the in¯uence of Ar±He mixed gas plasmas in a FAPIMS source are discussed in terms of improved analyte signal intensities, signal precision and LODs for both discrete sample volume (mass) introduction and for the steady-state introduction of gaseous Hg and I2. A list of all the analytes and
some of their important physical properties is given in Table 1. Signi®cant features related to the composition of the gas mixture, such as vacuum requirements, analyte transport from the source to the MS detector, changes in the spectral background, polyatomic species formation and metal oxide levels, will also be considered.
Experimental
Apparatus
The FAPIMS source has been described in an earlier publication2 and only a brief description will be given here. A 1 mm diameter graphite rod electrode (SGL Carbon, Ringsdorff-Werke GmbH, Germany) mounted in a brass collette serves as the powered rf electrode and coaxially traverses the length of a pyrolytic graphite coated ICC (SGL Carbon). The electrode terminates 1 mm from the end of the ICC tube facing the MS sampling interface (5±6 mm tube to sampling plate separation). The entire source is enclosed in a work-head fabricated from a copper block and ®tted with ports for furnace power, purge gas, water cooling, rf power and optical temperature feedback (cf., Fig. 1 from ref 2). The ICC furnace was heated by a Perkin-Elmer HGA-500 power supply and temperatures subsequently quoted are those read from the power supply, and may not re¯ect the true temperature of the ICC. Rf power (100 W) was supplied to the electrode from a Model RF10L 40 MHz generator and AM-5 matchbox (RF Power Products, Voorhees, NJ, USA). The work-head is mounted on the interface with three 1-inch micrometer heads, thereby permitting translation in three dimensions. The furnace was positioned so that the sampling ori®ce was on-line, but #1 mm below the central axis of the furnace (i.e., 1 mm below the electrode and 2 mm above the bottom tube wall). This location permits sampling of a region of high plasma intensity,17,18 yielding optimum signal intensity for most elements studied.19
A research prototype (test-bed) of a PE SCIEX Elan 6000 was used for all measurements. To handle the increased vacuum load due to He, a Varian SD-1400 (Varian Vacuum Products, Lexington, MA, USA) and a S25B (Leybold Canada Inc, Mississauga, Ontario, Canada) rotary pump having
pumping speeds of 23.7 and 7.1 L s21, respectively, were
connected to the interface. A Model PRM10 Pirani gauge with Model 503 controller (Edwards) was mounted about 15 cm from the interface to provide a continuous measure of the pressure in this region. The separation between the sampler (0.50 mm id) and skimmer (0.88 mm id) is #5.0 mm. Both sampler and skimmer cones sit on MACOR ceramic mounts, electrically isolated from the instrument ground. Voltages are applied to the sampler and skimmer cones using external dc power supplies (Hewlett-Packard, Models 6516A, and E3612A, respectively) and can be optimized for maximum signal intensity for each element. Because the FAPIMS source is low power (100 W) and the graphite furnace is operated intermittently (transient data collection) or at low relative temperatures (steady-state data collection), the interface was not water-cooled.
Table 1 Physical properties of the selected analytes
Element Isotopes monitored m/z Volatilitya
Ionization potential/eVb I II Fe 56 Medium 7.87 16.18 Rb 85 Medium 4.18 17.05 In 113 High 5.79 20.29 Cs 133 Medium 3.89 21.50 Pd 106 Low (medium) 8.33 19.42 Yb 174 Low (medium) 6.20 12.10 Pt 195 Low (medium) 9.00 18.56 Pb 208 High (medium) 7.42 16.90 Bi 209 High (medium) 7.29 16.68 Hg 202 High 10.43 18.75 I2 127c, 254d High 9.27c, 10.45d 25.5c, 19.13d aTaken from ref. 14.bTaken from ref. 15.cRefers to Iz
, taken from ref. 16.dRefers to I 2
z
, taken from ref. 16.
Fig. 1 Gas ¯ow parameters for He and Ar as a function of temperature at atmospheric pressure. a Total gas ¯ow rate through a 0.5 mm diameter sampling ori®ce. b The gas velocity calculated at a position 5 mm upstream from the sampling ori®ce, which coincides with the typical ICC tube position. Panel b inset shows the time required for each gas to travel from this position to the sampler at the given temperature.
1224 J. Anal. At. Spectrom., 2000, 15, 1223±1232
Reagents
UHP grade He and Ar (Praxair, Ottawa, ON, Canada) were used for all experiments. Stock solutions (1000 mg2l) of metals
were prepared by dissolution of their nitrate or chloride salts in high purity deionized distilled water (DDW) obtained from a NanoPure system (Barnstead/Thermolyne Corp., Boston, MA, USA). All sample solutions were prepared by serial dilution of stock solutions with DDW and acidi®ed to 1% v/v with high purity (sub-boiled, distilled) HNO3or HCl. The solutions were
stored in pre-cleaned, high-density polyethylene bottles. Head space gas above samples of liquid mercury (ACS grade, BDH, Toronto, ON, Canada) and iodine crystals (analytical reagent, AnalaR, BDH Chemicals, Toronto, ON, Canada) was introduced into the source to permit study of steady-state signals.
General procedures
Mass spectrometry data were collected using steady-state (continuous) and transient furnace temperature programs. Data ®les were exported from the Elan signal graphics program for subsequent numerical evaluation (i.e., peak area) using in-house software. Where possible, at least two isotopes of a given element, a proximate background mass and a potential oxide ion mass (Mz16), were monitored using a peak hopping routine. Gas ¯ows supplied to the work-head were calibrated using a bubble ¯ow meter. In all cases, a slight overpressure was used to reduce the diffusion of atmospheric gases into the source and the possibility of plasma quenching.
Volatile analyte sample introduction. For steady-state sample introduction, the plasma was initiated and a stable temperature was established before data acquisition. The furnace was operated at #500 ³C for all measurements, a temperature close to the estimated gas kinetic temperature of a 100 W plasma.4A
®xed ¯ow rate of He was passed through a sealed 2 mL sample vial containing either Hg(l)or I2(s). The volatile component was
mixed with the plasma gas supply prior to entering the work-head. For the experiments described below, Ar was added to the He plasma gas upstream of the point where the Hg or I2¯ux
entered. The concentration of the volatile analyte in this mixture was thus diluted in proportion to the ratio of the gas volume ¯owing through the sample vial to that delivered to the work-head. Using this method of sample introduction, analyte travels through the plasma volume primarily by entrainment within ¯ow pro®les that develop upstream of the sampling ori®ce and pass through the furnace. As a result, only a portion of the gas introduced into the work-head enters the plasma volume. A more ef®cient, direct sample introduction method for gas ef¯uents has earlier been described by Jimenez and Sturgeon19 and successfully utilised by Sturgeon and
Guevremont8with MS detection.
The vapour pressure of mercury at 295 K is 1.8861028
atm.15If it is assumed that the He (250 mL min21) passing over
a bead of metallic Hg becomes saturated with the atomic vapour, then a ¯ux of 3.2610210mol s21Hg will be supplied
to the work-head at room temperature. Given that the volume of the ICC is 50-fold smaller than the volume of the work-head and that a homogeneous mixture exists within the work-head, then #6.4610212mol s21Hg (1.3 ng s21) actually enters the
plasma volume. Similarly, the vapour pressure of iodine at 295 K is 3.8861024atm.12 Assuming that the He
(90 mL min21) passing over a crystal of I
2becomes saturated
with I2vapour, then a ¯ux of 2.461028mol s21I2will enter the
work-head at room temperature. For comparison, atomization of 10 pg of Pb within a 1s period gives rise to a ¯ux of approximately 5610214moles s21Pb. In both cases, the total
analyte vapour load is signi®cantly less (trace) than that of the He plasma gas (#4 mmol s21). For both analytes, the system is
®rst optimised using a pure He plasma to provide a good general set of conditions for the sampling and transfer of analyte ions through the interface. It is subsequently ®ne tuned for other mixtures.
Discrete liquid sample introduction. The work-head has a port directly above the furnace injection hole to permit introduction of aqueous samples with the use of an adjustable microlitre pipette. Signal transients from analytes were recorded using the following procedure. A 10 mL sample volume of test solution was pipetted into the ICC furnace and dried by applying a thermal program consisting of a 10 s ramp to 100 ³C followed by a hold for 20 s. The residue was then ``ashed'' at 300 ³C or 500 ³C by applying a 10 s ramp and 20 s hold. The ash temperature selected was based on a considera-tion of the volatility of the element in order to prevent sample loss. During the ``ashing'' cycle, the plasma was initiated by applying the rf power (100 W, 0 W re¯ected) and data acquisition was then manually triggered approximately 5 s prior to the atomisation event. Automatic impedance matching was not permitted during the heating cycles and, as such, the re¯ected power would momentarily reach values greater than 25 W for an atomisation temperature of 2300 ³C. After each run, a high temperature cycle (2500 ³C, 3 s) was initiated and a ®xed period of time (60 s) elapsed before the next sampling in an effort to eliminate contamination and ensure consistency in the thermal program for all samples.
Results and discussion
General properties of Ar±He mixed gas system
Although a number of publications focus on the sampling and gas dynamics of Ar (cf. refs. 20±22) and He plasma (cf. refs. 23± 26) systems, few, if any, complementary discussions of the sampling of Ar±He mixed gas systems in plasma mass spectrometry are available. As such, there is merit in reviewing some basic properties of Ar±He mixed gases, especially when considering the low temperature environment of the current system. Table 2 lists some general physical properties of He and Ar.
Source effects. There are a number of effects that occur in the work-head when the gas composition is changed from pure He to mixed Ar±He plasmas. In general, as the Ar gas content is increased, the gas temperature increases and the stability of the plasma visually appears to decrease. The central electrode develops a much deeper red colour arising from heating due to energetic collisions with the larger Ar gas atoms. These unstable, high temperature conditions reduce the lifetime of the ICC tube and electrode through accelerated erosion.
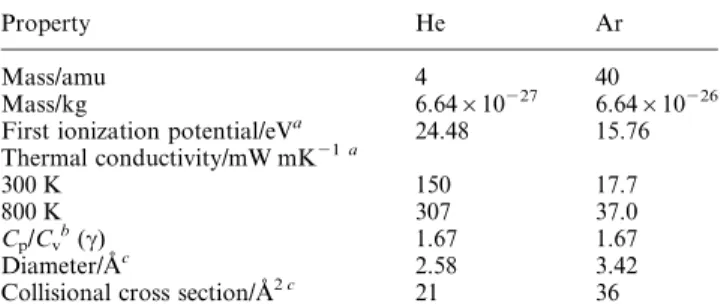
As indicated in Table 2, the thermal conductivity of the gas decreases with increasing Ar content. As such, the gas ¯ow is less ef®cient at removing heat from the system, resulting in a higher tube temperature. The higher wall temperature of the
Table 2 Select physical properties of the He and Ar plasma gases
Property He Ar
Mass/amu 4 40
Mass/kg 6.64610227 6.64610226
First ionization potential/eVa 24.48 15.76
Thermal conductivity/mW mK21 a 300 K 150 17.7 800 K 307 37.0 Cp/Cv b (c) 1.67 1.67 Diameter/AÊc 2.58 3.42
Collisional cross section/AÊ2 c 21 36
a
Taken from ref. 14.bRatio of the speci®c heat capacities of the gas at constant pressure (Cp) and volume (Cv).cTaken from ref. 27.
J. Anal. At. Spectrom., 2000, 15, 1223±1232 1225
Published on 24 August 2000. Downloaded by National Research Council Canada on 13/11/2015 20:48:47.
furnace increases the potential for loss of more volatile analyte sample components. These effects have been observed for medium/high volatility elements such as Pb and Bi, where losses during the ashing cycle can be severe if the temperature is not reduced when using gas mixtures containing Ar.
Increasing the Ar gas content within the work-head alters the gas ¯ow pro®les. Fig. 1a is a plot of the relative volume of pure He and pure Ar that ¯ows through the 0.5 mm diameter sampling ori®ce as a function of gas temperature per unit time. These data were calculated using the physical properties of the gases (Table 2) and the gas dynamic equations discussed by Douglas and co-workers.20,21At a typical steady-state furnace temperature of 500 ³C, approximately four-fold as much He is drawn through the sampler per unit time than Ar and, as the relative Ar concentration increases in mixtures, the amount of He drawn through the sampler decreases (described in more detail further below).
Changes in the gas ¯ow rate through the ori®ce will subsequently alter the gas ¯ow pro®les upstream of the ori®ce. The theoretical gas velocity for both He and Ar at a position 5 mm upstream of the sampling ori®ce was calculated20,21 assuming a stagnant source and plotted in Fig. 1b as a function of gas temperature. This position corresponds to the typical tube±ori®ce separation distance and thus represents the gap over which diffusion occurs prior to sampling. From the velocity plots in Fig. 1b, the approximate time it takes for a He or Ar gas atom to travel from the end of the furnace to the sampling ori®ce can be calculated by summing the velocities averaged over small distance increments. These values are indicated in Fig. 1b. Assuming that the analyte achieves bulk ¯ow velocity of the gas, there is a signi®cant difference in the time required for the analyte to travel from the tube to the sampler when pure He is used as compared to pure Ar. This time differential is a function of gas composition, the exact relationship being unknown but crudely estimated using the following approximations. The relative ¯ow velocities of the gas mixtures listed in Table 3 are bounded by the two pure gas values and, because both He and Ar are monatomic ideal gases, the c value given in Table 2 will remain constant, regardless of composition. Therefore, the calculated20,21velocity of the gas mixture will be proportional to the average atomic mass of the mixture. At the maximum concentration of Ar (# 9% v/v) used in this study, the average atomic mass is 7.3 g mole21, which
increases the total transport time from 1.5 ms in pure He to 2 ms in such a mixture. Given that the diffusion coef®cients for mid-mass elements such as Ba are of the order of 0.5 cm2s21in
pure He at 800 K,28diffusion based losses over these distances
are probably not severe. At 15 mm from the sampling ori®ce, which corresponds to the centre point of the ICC tube, the calculated transport times are 40, 53 and 124 ms for 0%, 10% and 100% Ar, respectively, at 500 ³C. At 25 mm, which corresponds to the distant (back) end of the tube, the transport times are calculated to be 181, 245 and 572 ms, respectively. The total transit-time, and hence the residence time of an analyte, increases with Ar gas content. Longer residence times of the analyte within the plasma volume may improve its ionisation ef®ciency. It should be stressed that these calcula-tions are meant only to demonstrate that, based upon ®rst
principles, there will be a relative decrease in the centre line gas velocities as a function of increasing Ar content. They by no means account for any additional ¯ow pro®les generated from the natural ¯ow of gas into the work-head. It is expected, however, that under steady-state conditions, ¯ow pro®les will develop that are strongly in¯uenced by such gas entrainment.
Interface effects. As the gas mixture ¯ows into the sampling ori®ce, it transforms to a continuum free jet expansion. The centre line of the isentropic region (zone of silence) of the expansion is sampled 4.5 mm downstream by a skimmer (Xo~4.5 mm). For monatomic `ideal' gases (c~5/3), the free
jet centre line properties (i.e., temperature, number density and collision frequency) will behave in a similar manner, although their absolute values will be determined largely by the atomic mass of the gas.29 As such, the relative centre line number density for Ar, He, or Ar±He mixtures will decrease in similar ways. The results are calculated and presented in Fig. 2a using the gas dynamic equations described in the literature.20-22,29
In practice, a number of events may occur within the ®rst vacuum stage that can alter the composition of a gas mixture. Collectively these are known as `separation effects'30±34 and
although they are most prominent in gas mixtures having large mass disparity amongst the components, they can also in¯uence the relative isotopic composition of an element or species detected downstream. As a gas mixture expands into the
Table 3 Relative composition of the He±Ar mixed gas delivered to the FAPIMS work-head at 298 K and 1 atmosphere Relative ¯ow rate/L min21 Gas composition (% v/v) per minute Gas composition (% w/w) per minute
Mass ¯ux/ g min21
Average atomic mass/ g mol21 He Ar He Ar He Ar 4.95 0.00 100.00 0.00 100.00 0.00 0.80 4.0 4.95 0.10 98.02 1.98 83.19 16.81 0.97 4.7 4.95 0.20 96.12 3.88 71.22 28.78 1.13 5.4 4.95 0.30 94.29 5.71 62.26 37.74 1.29 6.1 4.95 0.50 90.83 9.17 49.75 50.25 1.62 7.3
Fig. 2 Gas ¯ow parameters for He and Ar downstream of the 0.5 mm diameter sampling ori®ce (low pressure). a Change in source number density as a function of distance downstream from the sampler for a monatomic ideal gas (c~5/3). b Change in gas velocity as a function of location downstream of the sampler, calculated using source tempera-tures of 800 K and 2600 K.
1226 J. Anal. At. Spectrom., 2000, 15, 1223±1232
low-pressure region, a diffusive separation can occur in which an enrichment of the heavier component along the centre line results. As described by Sherman31 and demonstrated by
Rothe,32 this effect is primarily restricted to regions in the under expanded portion at, or immediately downstream of, the sampling ori®ce where appreciable number density exists. The separation effect is reduced substantially as the gas undergoes a transition to free molecular ¯ow and both species assume directed collisionless ¯ow. Examination of Fig. 2a indicates that the terminal velocity for pure He and Ar gas expansions at source temperatures of To~800 and 2600 K is achieved at
distances less than 2 mm from the ori®ce (or Xo/Dv4).
Skimming of the centreline ¯ow at Xo~4.5 mm results in the
transmission of a molecular beam that is enriched in the greater mass component. For the experiments reported here, the greater relative concentration of Ar along the centre line upstream of the skimmer may subsequently affect the acceleration and focusing of analyte species entrained in the expansion in a manner different from that for pure He. In the transport of neutral beam species past the skimmer, off-axis components present in the trajectory of lighter gases will result in their preferential loss and a greater enrichment of heavier species along the centre line.
As a caveat, there are two additional separation effects that may signi®cantly affect the composition of the beam. The diffusion of background gases into the isentropic expansion can result in signi®cant modi®cation of the mixed gas beam composition ratio, primarily favouring the lighter compo-nent.34As well, the placement or location of the skimmer can
signi®cantly affect the composition of the beam which is ef®ciently transmitted into the second stage.30To avoid large deviations, the skimming should be performed well within the Mach disk. For pure He, the Mach disk location can be calculated to occur at XM~5.33 mm and 9.24 mm behind the
sampler ori®ce for source temperatures of To~800 and 2600 K,
respectively [using XM~0.67D(Po/Pb)1/2].29 The tip of the
skimmer is currently located at Xo~4.5 mm, well upstream of
the Mach disk. Further considerations (not explicitly dis-cussed) that may affect the beam composition and background pressure (Pb) in the ®rst stage are non-homogeneous sampling
of the mixture and differences in the pumping ef®ciency of light and heavy gases within the MS.
Velocity slip is another effect that should be considered. Simply put, velocity slip is the difference in the mean velocities of different species. The data plotted in Fig. 2b show the terminal velocity limits for He (light) and Ar (heavy) expansions. For the Ar±He mixtures used in the experiments reported here (Table 3), Ar will be preferentially accelerated towards the terminal velocity of He, obtaining a greater kinetic energy than that normally achieved in pure Ar. Often, however, the heavier component will fail to achieve the terminal velocity of the carrier gas, resulting in velocity slip. Miller has estimated that only a 2% velocity slip occurs for a 3% Ar±97% He mixture at 300 K.29 Takahashi et al.35 have also demonstrated that differences are further enhanced with larger mass ratios.
Although velocity slip can result in bimodal velocity distributions within an Ar±He gas mixture where the mass ratio is 10 : 1, it will be even more severe for larger mass ratios, such as those encountered with analytes such as Hg (#50 : 1) and I2(#65 : 1). Of particular relevance to the work described
here has been the use of I2as an optical marker used to seed
various expansion gases so that the ¯ow pro®les can be imaged using ¯uorescence techniques (e.g., refs. 36 and 37). Notably, it is often the case that when I2is seeded (v0.1%) in He it does
not generate the expected expansion pro®le, most likely due to the large mass ratio and diffusion separation. For the measurement of Hg and I2species reported here, it is therefore
likely that these species do not achieve the terminal velocity of the carrier gas and that there will be a relative concentration enhancement along the centre line. The addition of Ar might
serve to accelerate these large species through an increased collision frequency (based on hard-sphere collision cross sections) achieving more ef®cient transfer of energy. This would result in a greater probability of the heavy mass analyte attaining the velocity maximum determined by the He carrier. A mathematical treatment of the I2±He system by Chidiac
et al.38has con®rmed a large velocity slip. Similar experiments in Ar (mass ratio #5 : 1) show the expected ¯ow pro®les, indicating that I2more closely approaches the ¯ow
character-istics of Ar (e.g., ref. 36). The relative composition of a gas mixture will therefore determine the relative degree of velocity slip and therefore relative differences in the ion kinetic energies and hence ion-optic focussing voltages for different ions.
Impact of mixed gas plasmas on vacuum requirements. When mixed gas Ar±He plasmas are employed, vacuum requirements are reduced. The relative reduction is dependent on the composition of the gas mixture and can be approximated using the aforementioned gas dynamic equations.20,21 For example, if it is estimated that the gas temperature at the sampling plate located 5 mm downstream of the source is 500 K, then approximately 4.80 L min21of He will be drawn
through the sampling ori®ce. This ¯ow rate would result in a theoretical pressure in the ®rst stage of #3.5 Torr, consistent with that measured experimentally. Under normal operation the work-head is usually supplied with 105% of this value, or 5.0 L min21, to minimise atmospheric ingress. Similarly, it is
calculated that, for pure Ar, 1.6 L min21is drawn through the
sampling ori®ce at 500 K giving an interface pressure of 1.1 Torr. For a mixture containing 0.1 L min21 Ar, Ar
accounts for #6.6% of the gas drawn through the ori®ce (assuming homogeneous sampling) and therefore only 98.4% of the 5.0 L min21He balance, or 4.7 L min21He will be drawn
through the sampler. When the mixture contains 0.5 L min21
Ar, it accounts for #33% of the gas drawn through the ori®ce and therefore only 3.45 L min21 of the He balance ¯ows
through the ori®ce. For gas mixtures containing 0.0, 0.1, 0.2, 0.3, 0.5 L min21 Ar with 5.0 L min21 He the corresponding
interface pressures, read from a pirani gauge (calibrated for air), are 3.8, 3.1, 2.6, 2.3 and 1.7 Torr, respectively.
The crude method described above indicates that, even with the addition of 0.5 L min21Ar, 3.5 L min21He is still drawn
through the sampling ori®ce, implying that a signi®cant pumping capacity will still be required. Decreasing the sampling ori®ce diameter may reduce the vacuum requirements but this usually diminishes the analyte transport ef®ciency into the MS. As such, although the use of mixed Ar±He plasmas reduces vacuum requirements, they are not large enough to permit the use of signi®cantly smaller pumps.
Constant ¯ux sample introduction The effect of Ar on Hgz
and I2 z
signal intensity. A constant ¯ux of Hg (3.2610210mol s21, 64 ng s21) is introduced into
the FAPIMS work-head gas supply at room temperature. A portion ¯ows through the ionising region of the source (100 W, 500 ³C) prior to entering the MS. For a constant He plasma gas ¯ow rate of 4.95 L min21, an increase in Ar content from 0 to
0.5 L min21results in a 10-fold increase in the total Hgzsignal
intensity, as shown in Table 4. For each gas mixture, the single lens element (ring lens) was optimised to generate the maximum signal intensity for202Hgz
. The net 202Hgz
signal intensities reported in Table 4 are in¯uenced by a number of factors. By increasing the Ar content in the gas mixture, a more energetic plasma9,10having increased
electron density, ionisation temperature and gas kinetic temperature is generated. The general decrease in the HgOz
/ Hgz
ratio is consistent with this. Also, longer residence times associated with increased Ar content (discussed above) will probably improve the ionisation ef®ciency. Changes in the gas
J. Anal. At. Spectrom., 2000, 15, 1223±1232 1227
Published on 24 August 2000. Downloaded by National Research Council Canada on 13/11/2015 20:48:47.
density arising from an increase in source temperature, however, may adversely affect the response through a volume dilution effect. Within the expansion, changes in the overall velocity slip (Hgz
kinetic energy) are expected in the beam. Optimisation of the lens element should help correct for this and any changes due to variation in source temperatures. In general, only a small increase in the Ar gas content (#2% v/ v) is necessary to generate a signi®cant increase in signal intensity for Hgz
.
A ¯ux of 2.461028mol s21I
2was similarly introduced into
the plasma gas supply at room temperature. Under steady-state conditions, two major ions (Iz
, m/z 127; I2z, m/z 254) and one
minor ion (1±5%, I2(H2O)z, m/z 272) were detected. For
simplicity, only the signal intensity for each major ion is listed in Table 5. Fig. 3 shows a plot of the summed signal intensity for all three iodine species arising for each mixture and normalised to that recorded in pure He. A net signal enhancement occurs with increasing Ar content. In each case, the single lens element (ring lens) was optimised to generate the maximum signal intensity for each species and those optimum values summed. Similar to the Hgz
response, only a small addition (#2% v/v) of Ar is necessary to generate a signi®cant increase in the total iodine signal intensity.
Data presented in Table 5 indicate that, as the Ar content is increased, there is a shift from the diatomic form to the monatomic form of iodine. The I2z/Izratio decreases by over
100-fold for the gas compositions studied. The ionisation potentials for Iz
and I2z are given in Table 1 and the
dissociation energies D(I-I) and D(I-Iz
) are 1.54 eV and 2.72 eV, respectively.39It is conceivable that the more energetic Ar containing plasmas [e.g., increased analyte ionisation temperature (5270 K to 6740 K), electron number density (i.e., He 861013cm23, Ar 161015cm23) and gas kinetic
temperature] are more ef®cient in dissociating the molecular iodine, generating a greater population (2 : 1) of atomic iodine for ionisation. An increase in the collision induced dissociation (CID) of the molecular species in the expansion due to the presence of an acceleration potential and the greater collision frequency that may be experienced with Ar due to its larger cross-section (Table 2) may also contribute to the increased fragmentation. Irrespective of whether dissociation occurs within the plasma (from I2or I2z) or in the expansion region
(from I2z), the addition of Ar generates a net signal
enhancement for the sum of the iodine species and especially for Iz
. The data in Table 5 indicate that there is a signi®cant enhancement (10 : 1) in the atomic ion intensity (Iz
) whereas there is only a slight increase (v2 : 1) in the molecular ion (I2z)
intensity. While an in-depth correlation of the Grotrian diagrams for the atomic and molecular forms of iodine with those of Ar and He may provide additional pertinent information it is beyond the scope of the present work.
An interesting observation made during the optimisation procedure for I2is that the focusing potential on the single lens
element increases with decreasing analyte mass. This is illustrated by the data given in Fig. 4a for 4% Ar±96% He mixture at 500 ³C. Although the resolution (1 V) is too large to properly de®ne the optimum, the asymmetry in the peak shapes of the plots indicate a smaller difference between the high mass species [e.g., I2
z
±I2(H2O) z
] than between the high mass±low mass species (e.g., I2z±Iz). Under normal Ar ICP-MS
operation, the lens potential increases with mass.40A possible explanation for this phenomenon might arise from differences in the velocity slip experienced for Iz
and I2zspecies for which
the Iz
: He mass ratio is only half of that of the I2z: He ratio.
As such, the lighter analyte may have a greater probability of achieving the terminal velocity of the expansion gas and, therefore, a higher kinetic energy. To account for these observations however, differences in the square of the velocity for the Iz
species must be greater than two times that of the I2z. A second, and perhaps more important contribution, may
arise from differences in the (hard sphere) collision cross-sections between Iz
and I2 z
and, consequently, their collisional frequency in regions of signi®cant background gas density. In the presence of an accelerating ®eld, the smaller ion will achieve a greater velocity and a larger relative kinetic energy due to fewer retarding collisions. This is qualitatively analogous to classical ion mobility experiments where smaller ions tend to have greater mobility in a given ®eld. This of course presumes that signi®cant ion±electron charge separation has occurred in the ionised gas prior to sampling.
The effect of Ar content on the optimum lens voltage setting for Iz
is shown in Fig. 4b. There is a general increase in the lens voltage required to achieve the optimum signal intensity with increasing Ar content. This is consistent with higher source temperatures. It is also consistent (albeit arguably) with a reduction in velocity slip and closer attainment of the terminal velocity of the He bath gas.
Discrete sample introduction
Signal transients generated using mixed gas plasmas. The effect of increased Ar content on the transient signals generated from 10 pg Pb was investigated. Results are summarized in Table 6 and re¯ect the average of 5 replicates. In all cases, Ar gas (0.0±0.5 L min21) is added to a ®xed (optimum) He gas
¯ow rate (5.1 L min21). The lens voltage was optimized for
each set of measurement conditions and only small adjustments were required between mixtures.
Table 4 The effect of Ar content on the Hgz
MS signal intensitya
Ar gas ¯ow rate/L min21 202Hgz/counts s21 202Hg16Oz/202Hgz(%)
0.00 1.766105 3.94
0.10 1.866106 0.38 0.20 1.736106 0.29
0.30 1.876106 0.19 0.50 1.856106 0.18 a100 W, He gas ¯ow rate of 4.95 L min21.
Table 5 Effect of Ar content on iodine MS signal intensitya
Ar gas ¯ow rate/L min21 127Iz/ counts s21 254I 2z/ counts s21 254I 2z/ 127 Iz 0.00 1.636104 1.536105 11.00 0.10 1.586106 2.776105 0.18 0.20 9.476105 1.116105 0.13 0.30 8.476105 7.476104 0.09 0.50 7.856105 4.796104 0.06 a100 W, He gas ¯ow rate of 4.95 L min21.
Fig. 3 Signal intensities recorded for202Hgzand the sum of the major
iodine species [z , m/z 127; I2 z , m/z 254, I2(H2O) z , m/z 272] as a function of gas composition. Argon is added to a 100 W plasma (500 ³C) supplied by a constant helium gas ¯ow rate of 4.95 L min21.
All signals are normalised to that from the pure He plasma.
1228 J. Anal. At. Spectrom., 2000, 15, 1223±1232
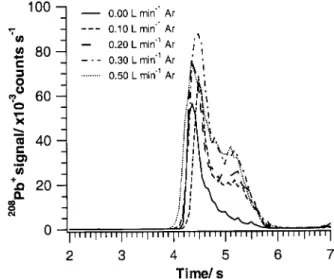
Fig. 5 shows typical208Pbz
signal transients recorded for the ®ve different gas mixtures. With reference to Table 6, the data indicates that the addition of Ar leads to an increase in the
208
Pbz
MS signal for all measurement conditions. From the signal pro®les, it appears that the presence of only a small amount of Ar is necessary to increase the208Pbz
MS signal intensity, with the effect accruing most noticeably in the later stages of the transient evolution. Also, a slight shift to earlier appearance times occurs for the 208Pbz
transient with increasing Ar content (0.1±0.5 L min21). This is consistent
with higher tube temperatures for a given heating program (as discussed earlier).
It is dif®cult to compare the signals recorded in Ar directly with those obtained in pure He because the ash temperatures
which de®ne the heating ramp were slightly different. The selection of different ash temperatures was necessary in order to maximize the signal while minimizing sample loss due to uncontrolled volatilization during this step. These problems were most signi®cant for the more volatile elements such as Pb and Bi. For less volatile elements, small variations in the optimum ash temperature were not problematic. Nevertheless, it is important to note that the gas composition can in¯uence the ef®ciency of the atomizer and therefore should be considered when making comparisons of signal intensity. A further indication of the elevated source temperature experi-enced with Ar content is given by the noticeable decrease in PbOz
/Pbz
ratio. Addition of Ar appears to generate a higher temperature, more energetic plasma capable of dissociating the oxide.
Analytical ®gures of merit. Table 7 lists the relative enhance-ment factors, estimated limits of detection and metal oxide ratios obtained for the analytes listed in Table 1. The elements selected cover a wide range of ionisation potentials and volatility. The enhancement factor is de®ned as the ratio of the integrated peak area measured for a given analyte in a 4% Ar± 96% He plasma to that recorded in a 100% He plasma. Transient signals were recorded for at least two isotopes where possible so that the identity of the signal detected could be easily con®rmed if the correct isotope ratios were obtained.
Enhancements were observed for most of the elements studied. A plot of the relative enhancement factor for each element versus the ®rst ionisation potential is given in Fig. 6. The enhancement factors for Hgz
and Iz
±I2 z
are also included for completeness. The enhancement factor appears to correlate with ionisation potential where the smallest (negative) enhancement arises from the alkali metals and the greatest from Pt, I2 and Hg. In general, there is a slight
Fig. 4 Effect of the ring lens ion optic focusing voltage on steady-state analyte signal intensity acquired with a 100 W plasma at an ICC temperature of 500 ³C. a Relative response for iodine plasma species at a gas composition of 4.95 L min21He and 0.10 L min21Ar. b Relative
response of the127Izion as a function of argon gas content (Table 3) at
a ®xed He gas ¯ow rate of 4.95 L min21.
Table 6 The effect of Ar content on208PbzMS ®gures of merita
Ar/L min21 Peak area/counts Enhancement factorb LODc/fg Precisiond(%) PbOz
/Pbz (%) 0.00 22597 1.00 5 5.6 3.72 0.10 36652 1.62 8 5.4 0.56 0.20 47391 2.10 4 5.3 0.37 0.30 59508 2.63 8 5.0 0.35 0.50 63939 2.83 6 5.0 0.32
aCalculated from 10 pg Pb in 1% HNO
3, using a plasma power of 100 W and a He gas ¯ow rate of 5.1 L min21.bThe enhancement factor is
expressed as the ratio of the integrated area of the analyte obtained in Ar±He mixture to that obtained in pure He.cLimit of detection (LOD) calculated as 36 the standard deviation of the blank based upon 10 replicates.dBased on ®ve replicate measurements.
Fig. 5208Pbz
transients obtained for the atomisation (2300 ³C) of 10 pg of Pb in 1% HNO3as a function of gas composition (Table 3).
The plasma power was 100 W and the He gas ¯ow rate was ®xed at 5.1 L min21. Some relevant statistics are given in Table 6.
J. Anal. At. Spectrom., 2000, 15, 1223±1232 1229
Published on 24 August 2000. Downloaded by National Research Council Canada on 13/11/2015 20:48:47.
improvement in the estimated detection limits calculated from the Ar±He mixed gas plasmas relative to the pure He plasma with the largest effect obtained for Pt. Excluding Pt, which has the highest ionisation potential, the detection limits for most elements are in the ppt to sub-ppt range based upon a 10 mL sample volume. The presence of Ar did not signi®cantly increase the background for most of the elements studied. The data in Table 6 suggest that, with the gas compositions used, the precision of the measurement may even improve with Ar. Therefore, the decrease in detection limits is due primarily to an increase in the signal intensity for the elements studied. It is anticipated that the detection limits for many of these elements could reach the ppq range with further optimisation of the sampling conditions and interface.
Ionisation mechanism in the Ar±He mixed gas plasma
The data in Fig. 6 indicate that the enhancement factor increases as a function of ionisation potential for the elements studied. It has earlier been concluded6 that, for a 50 W He plasma, elements with ®rst ionisation potentials (IP) below 6 eV are 100% ionised whereas those around 9 eV may only be 5% ionised. For a 100 W He plasma, the ionisation ef®ciency is
expected to increase, particularly for those elements having the highest IP. For comparison, in an Ar ICP, the ionisation ef®ciency may be as high as 70% for elements with IP¡ 9 eV,41 which is 14-fold greater than that obtained in He FAPES plasma.
The addition of Ar to the plasma gas supply should therefore increase the degree of ionisation for elements having an IP greater than 6 eV. This trend is observed in Fig. 6; elements such as the alkali metals and In do not show signi®cant enhancements whereas Pt, I2and Hg, which have the greatest
IP, show the most signi®cant enhancements. At this point, it is unclear whether the slight decrease in signal for Csz
and Rbz
is a result of plasma processes or differences in transmission ef®ciency that may occur with the addition of Ar. Although the data generated from the selected elements indicate that the increase in ionisation ef®ciency occurs largely through the associated increase in electron density, ionisation temperature and gas kinetic temperature, it does not preclude the impact of other mechanisms such as charge transfer or Penning ionisation.9,10
The effect of Ar on the spectral background
The background signal intensity recorded in the pure He FAPIMS source has been previously discussed by Stewart et al.2 In general, background species originate from gas
supply contaminants, atmospheric gases entrained into the work-head, surface contamination within the work-head and gas supply lines, and carbonaceous species. The last are especially prevalent at a high source temperature. Although entrainment can be minimised by supplying an overpressure of plasma gas to the work-head, and surface contamination can be minimised through high temperature `cleaning' cycles, both are dif®cult to completely eliminate. The addition of Ar under low temperature furnace operation (e.g., 500 ³C) generally leads to an increase in only the 40Arz
signal, which is roughly proportional to the added Ar ¯ow rate. During atomisation (e.g., 2300 ³C) other species such as ArCz
, ArOz
and Ar2 z
become quite intense and, as such, degrade the detection power for elements having the same nominal mass (i.e.,52Crz,56Fezand80Sez). In this respect,
Ar±He mixed gas plasmas suffer background problems similar to those encountered with Ar-ICP-MS.
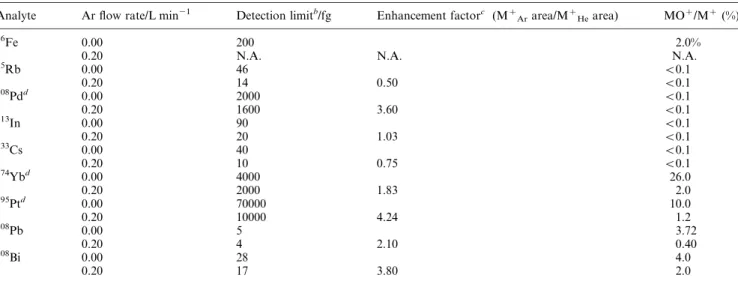
Table 7 Effect of argon gas content on analyte limits of detection (LOD), enhancement factors and metal oxide ratioa
Analyte Ar ¯ow rate/L min21 Detection limitb/fg Enhancement factorc (Mz
Ararea/MzHearea) MOz/Mz(%)
56Fe 0.00 200 2.0%
0.20 N.A. N.A. N.A.
85Rb 0.00 46 v0.1 0.20 14 0.50 v0.1 108Pdd 0.00 2000 v0.1 0.20 1600 3.60 v0.1 113 In 0.00 90 v0.1 0.20 20 1.03 v0.1 133 Cs 0.00 40 v0.1 0.20 10 0.75 v0.1 174 Ybd 0.00 4000 26.0 0.20 2000 1.83 2.0 195 Ptd 0.00 70000 10.0 0.20 10000 4.24 1.2 208 Pb 0.00 5 3.72 0.20 4 2.10 0.40 208Bi 0.00 28 4.0 0.20 17 3.80 2.0
aCalculated from signal transient (10 pg) peak areas and a 1% (v/v) HNO
3blank. Plasma power: 100 W, He plasma gas ¯ow rate: 5.1 L min21. b
Limit of detection (LOD) calculated as 36 the standard deviation of the blank based upon 10 replicates.cThe enhancement factor is expressed as the ratio of the integrated area of the analyte obtained in Ar±He mixture to that obtained in pure He.dAnalyte mass of 1 ng was used.
Fig. 6 Relative signal enhancement for various elements as a function of their ®rst ionisation potential. All enhancements are calculated from the ratio of the integrated transient peak areas acquired in the Ar (0.2 L min21)±He (5.1 L min21) mixture to that in the pure He plasma
(100 W, 5.1 L min21).
1230 J. Anal. At. Spectrom., 2000, 15, 1223±1232
Formation of MOz
and M2zions
The data given in Tables 4, 6 and 7 suggest that the addition of Ar reduces the relative metal-oxide signal intensity. In most cases, an approximately 10-fold reduction is achieved with the addition of 0.2 L min21Ar. As illustrated by the Pb data given
in Table 5, a minimum is reached with no further reduction in the PbOz
/Pbz
ratio for Ar content above 0.2 L min21Ar. The
reduction in the metal oxide ratio through the addition of Ar to the plasma gas is most likely the result of the ef®cient atomisation associated with a more energetic plasma.
Ytterbium was included in this study as an example of a low volatility element with an atomisation temperature (2500 ³C)14 that is not too high to signi®cantly impede its ionisation in the FAPIMS source due to high re¯ected powers caused by the emission of electrons from the heated tube walls.42Ytterbium is also prone to oxide formation where DYb-O~4.12 eV and
DYb¡O~3.82 eV.43The data in Table 7 indicate a substantial
presence of oxide, which is subsequently reduced in the presence of Ar. Despite the relatively low second IP of Yb (12.1 eV), no conclusive evidence for the presence of Yb2zwas
detected, nor was there any evidence for the second ionisation of any of the other elements studied (Table 1). Although Ba is often used as a marker element for the formation of M2zions
in plasmas due to its relatively low second IP, its atomisation temperature (#2700 ³C) is too high for useful determinations with FAPIMS and therefore it was not tested.
Conclusions
A major impact of the addition of Ar to the He gas supply in the FAPIMS source appears to be the generation of more `energetic' plasmas which have greater electron density, higher ionisation temperatures and gas kinetic temperatures. This explains, in part, the correlation between the signal enhance-ments observed for an element and its ionisation potential. Elements with ionisation potentials below 6 eV that are presumed 100% ionised produce no signal enhancements, whereas those with greater IP exhibit enhancements which increase with IP. Additional element speci®c mechanisms, such as charge transfer reactions and Penning ionisation, may also occur. Further support for this is the enhanced dissociation of molecular species such as I2
z
and YbOz
, having dissociation energies between 2 and 4 eV. This presumably occurs due to more ef®cient atomisation of molecular species within the plasma and suggests that the addition of Ar might be a useful tool for the fragmentation of other organic or organometallic species enabling the attainment of elemental information or structural information.
Mixed Ar±He gas plasmas should be used with caution. The addition of Ar can reduce the thermal conductivity and increase the furnace wall temperature, leading to inadvertent loss of volatile components if measures are not taken to reduce the ashing temperature. Also, the different gas compositions will in¯uence the ¯ow velocity of analyte into the sampling ori®ce and hence transport and/or residence times within the plasma volume. The nature of the impact of mixed gas plasmas downstream of the sampler remains unclear. Although the beam composition and, hence, energetics of the expansion may change with gas composition, the effects do not appear to dramatically limit or enhance the determination of the elements studied.
Only a small concentration (#10%) of Ar is required to generate signi®cant analyte signal enhancements whereas larger amounts result in an unstable plasma and a high temperature environment which contributes to signi®cant erosion of the graphite tube and electrode surfaces. The small amount of Ar used does not signi®cantly ease the pumping requirements on the interface. The development of different gas introduction arrangements, sampling or interface designs may, however,
generate more ef®cient sampling conditions. For example, by contouring the sampling ori®ce to better entrain the gas ¯owing from the source the ori®ce diameter requirements may be reduced and hence the pumping capacity. Such investigations are presently underway in this laboratory.
Acknowledgements
The authors wish to thank Scott D. Tanner and PE-SCIEX for the ELAN 6000 testbed mass spectrometer used in this study. The technical assistance of Peter L'Abbe is also greatly appreciated.
References
1 R. E. Sturgeon and R. Guevremont, Anal. Chem., 1997, 69, 2129. 2 I. I. Stewart, R. Guevremont and R. E. Sturgeon, Anal. Chem.,
1999, 71, 5146.
3 W. Frech, D. C. Baxter and B. Hutsch, Anal. Chem., 1986, 58, 1973.
4 S. Imai and R. E. Sturgeon, J. Anal. At. Spectrom., 1994, 9, 493. 5 D. C. Gregoire and R. E. Sturgeon, Spectrochim. Acta, Part B,
1999, 54, 773.
6 R. E. Sturgeon and R. Guevremont, J. Anal. At. Spectrom., 1998, 13, 229.
7 A. Montaser, S-K. Chan and D. W. Koppenaal, Anal. Chem., 1987, 59, 1240.
8 R. Guevremont and R. E. Sturgeon, J. Anal. At. Spectrom., 2000, 15, 37.
9 F. Sun and R. E. Sturgeon, J. Anal. At. Spectrom., 1999, 14, 901. 10 F. Sun and R. E. Sturgeon, Spectrochim. Acta, Part B, 1999, 54,
2121.
11 R. E. Sturgeon, S. N. Willie, V. T. Luong, S. S Berman and J. G. Dunn, J. Anal. At. Spectrom., 1989, 4, 669.
12 R. E. Sturgeon, S. N. Willie, V. T. Luong and S. S Berman, Anal. Chem., 1990, 62, 2370.
13 T. D. Hettipathirana and M. W. Blades, Spectrochim. Acta, Part B, 1992, 47, 493.
14 W. Slavin, Graphite Furnace AAS ± A Source Book, The Perkin-Elmer Corporation Spectroscopy Division, Ridge®eld, CT, USA, 1984, pp. 18±19.
15 CRC Handbook of Chemistry and Physics, ed. R. C. Weast and M. J. Astle, CRC Press Inc., West Palm Beach, Fl, 1978, 59th edn. 16 Ionization Potential and Appearance Potential Measurements, 1971±1981, NSRDS-NBS 71, ed. R. D. Levin and S. G. Lias, US Government Printing Of®ce, Washington, D.C., 1983. 17 C. W. Le Blanc and M. W. Blades, Spectrochim. Acta, Part B,
1995, 50, 1395.
18 R. E. Sturgeon, V. Pavski and C. L. Chakrabarti, Spectrochim. Acta, Part B, 1996, 51, 999.
19 M. S. Jiminez and R. E. Sturgeon, J. Anal. At. Spectrom., 1997, 12, 597.
20 D. J. Douglas and J. B. French, J. Anal. At. Spectrom., 1988, 3, 743.
21 D. J. Douglas and S. D. Tanner, in Inductively Coupled Plasma Mass Spectrometry, ed. A. Montaser, Wiley-VCH, New York, 1998, ch. 8, pp. 615±679.
22 H. Niu and R. S. Houk, Spectrochim. Acta Part B, 1996, 51, 779. 23 D. W. Koppenaal and L. F. Quinton, J. Anal. At. Spectrom., 1988,
3, 667.
24 D. M. Chambers, J. W. Carnahan, Q. Jin and G. M. Hieftje, Spectrochim. Acta Part B, 1991, 46, 1745.
25 H. Zhang, S-H. Nam, M. Cai and A. Montaser, Appl. Spectrosc., 1996, 4, 427.
26 A. Montaser and H. Zhang, in Inductively Coupled Plasma Mass Spectrometry, ed. A. Montaser, Wiley-VCH, New York, 1998, ch. 10, pp. 809±890.
27 P. W. Atkins, Physical Chemistry, W.H Freeman and Co., New York, USA. 1986, 3rd edn.
28 R. K. Namiotka, E. Ehrlacher, J. Sagle, M. Brewer, D. J. Namiotka, A. P. Hickman, A. D. Streater and J. Huennekens, Phys. Rev. A, 1996, 54, 449.
29 D. R. Miller, in Atomic and Molecular Beam Methods, ed. J. Scolas, Oxford University Press, Oxford, 1988, vol. 1.
30 V. H. Reis and J. B. Fenn, J. Chem. Phys., 1963, 39, 3240. 31 F. S. Sherman, Phys. Fluids, 1965, 8, 773.
32 D. E. Rothe, Phys. Fluids, 1966, 9, 1643.
33 N. Abuaf, J. B. Anderson, R. P. Andres, J. B. Fenn and
J. Anal. At. Spectrom., 2000, 15, 1223±1232 1231
Published on 24 August 2000. Downloaded by National Research Council Canada on 13/11/2015 20:48:47.
D. R. Miller, Rare®ed Gas Dynamics-Proceedings of the 5th International Symposium, 1967, pp. 1317±1336.
34 R. Campargue, J. Chem. Phys., 1970, 52, 1795.
35 N. Takahashi, T. Moriya and K. Teshima, Rare®ed Gas Dynamics-Proceedings of the 13thInternational Symposium, 1985, pp. 939± 950.
36 K. Teshima and H. Nakatsuji, Rare®ed Gas Dynamics-Proceedings of the 14thInternational Symposium, 1984, pp. 447±454.
37 A. Fujimoto, S. Kato, M. Usami, T. Niimi and and S. Kamiya, Rare®ed Gas Dynamics-Proceedings of the 14th International Symposium, , 1984, pp. 467±475.
38 C. Chidiac, M. Y. Perrin and J. P. Martin, Phys. Fluids A, 1991, 3, 1991.
39 A. G. Gaydon, Dissociation Energies and Spectra of Diatomic Molecules, Chapman and Hall Ltd., London, 1968, 3rd edn. 40 E. R. Denoyer, D. Jacques, E. Debrah and S. D. Tanner, At.
Spectrosc., 1995, 16, 1.
41 R. S. Houk, Anal. Chem., 1986, 58, 97A±105A.
42 R. E. Sturgeon, V. T. Luong, S. N. Willie and R. K. Marcus, Spectrochim. Acta, Part B, 1993, 48, 893.
43 E. Murad and D. L. Hilderbrand, J. Chem. Phys., 1980, 73, 4005.
1232 J. Anal. At. Spectrom., 2000, 15, 1223±1232