Publisher’s version / Version de l'éditeur:
Canadian Journal of Civil Engineering, 24, October 5, pp. 736-753, 1997-10-01
READ THESE TERMS AND CONDITIONS CAREFULLY BEFORE USING THIS WEBSITE. https://nrc-publications.canada.ca/eng/copyright
Vous avez des questions? Nous pouvons vous aider. Pour communiquer directement avec un auteur, consultez la
première page de la revue dans laquelle son article a été publié afin de trouver ses coordonnées. Si vous n’arrivez pas à les repérer, communiquez avec nous à [email protected].
Questions? Contact the NRC Publications Archive team at
[email protected]. If you wish to email the authors directly, please see the first page of the publication for their contact information.
NRC Publications Archive
Archives des publications du CNRC
This publication could be one of several versions: author’s original, accepted manuscript or the publisher’s version. / La version de cette publication peut être l’une des suivantes : la version prépublication de l’auteur, la version acceptée du manuscrit ou la version de l’éditeur.
For the publisher’s version, please access the DOI link below./ Pour consulter la version de l’éditeur, utilisez le lien DOI ci-dessous.
https://doi.org/10.1139/cjce-24-5-736
Access and use of this website and the material on it are subject to the Terms and Conditions set forth at
Traffic induced building vibrations in Montréal
Hunaidi, Osama; Tremblay, Martin
https://publications-cnrc.canada.ca/fra/droits
L’accès à ce site Web et l’utilisation de son contenu sont assujettis aux conditions présentées dans le site LISEZ CES CONDITIONS ATTENTIVEMENT AVANT D’UTILISER CE SITE WEB.
NRC Publications Record / Notice d'Archives des publications de CNRC:
https://nrc-publications.canada.ca/eng/view/object/?id=27e7a284-3238-4a42-90a2-ad2cee60bde3 https://publications-cnrc.canada.ca/fra/voir/objet/?id=27e7a284-3238-4a42-90a2-ad2cee60bde3Traffic-induced building vibrations in Montréal
Osama Hunaidi and Martin Tremblay
Abstract: Extensive measurements and detailed analysis of building vibration induced by road traffic in Montréal were
carried out for nine representative complaint sites. Vibration levels were evaluated with reference to human annoyance and the potential for building damage using existing standards. The effects of road condition and seasonal variations in soil conditions on vibration levels were also investigated using vibration measurements before and after a road was resurfaced and at different seasons. Details of test methods, measurement and analysis procedures, and the major findings of the study are presented in this paper.
Key words: vibrations, buildings, road traffic, site response, human annoyance, building damage.
Résumé : Une étude détaillée ainsi que des mesures de la vibration de bâtiments causée par la circulation routière à Montréal
furent effectuées pour neuf sites représentatifs où des plaintes ont été signalées. Les niveaux de vibration furent évalués en fonction du mécontentement de la population et du potentiel d’endommagement des bâtiments selon les standards existants. La vibration fut mesurée avant et après le repavage de la route et au cours des saisons afin d’étudier l’influence de la condition des routes et des variations saisonnières du sol sur les niveaux de vibration. Les détails sur les méthodes d’essais, les
procédures d’analyse et de mesure, ainsi que les principales conclusions de cette étude sont présentées dans cet article.
Mots clés : vibrations, bâtiments, circulation routière, réponse du site, mécontentement de la population, dommage des
bâtiments.
[Traduit par la Rédaction]
Introduction
Vibrations induced in buildings are a common concern to many cities around the world. Complaints are usually made by owners of residential homes about annoying vibrations in their buildings as a result of heavy vehicles passing on adjacent roads. In some cases legal action is taken by homeowners against cities claiming building damage. Vibration induced by road traffic is also of concern regarding its long-term effect on historic buildings, especially those in weak condition.
Traffic vibration is mainly caused by heavy vehicles, e.g., buses and trucks. Small vehicles, e.g., passenger cars, rarely induce vibrations that are perceptible in buildings. Vi-brations are induced as a result of the presence of discrete irregularities in the road surface (e.g., potholes, cracks, and uneven manhole covers), as well as periodic and random road surface irregularities and imperfections in vehicles them-selves. Irregularities and imperfections lead to dynamic vehi-cle–pavement interaction forces that in turn generate stress waves in the supporting soil. Stress waves in the soil eventually reach the foundations of adjacent buildings causing them to vibrate. Many factors affect vibration levels, among them the road condition, vehicle weight and speed, vehicle
teristics, soil stratification and properties, and building charac-teristics.
The possibility of inducing airborne vibrations due to the acoustic noise of vehicles also exists, especially if buildings are close to the road. This type of vibration, however, occurs at higher frequencies than ground-borne vibration and there-fore may cause “rattling” of windows and loose objects that may be very annoying. Airborne vibration is not considered in this paper.
The problem of traffic-induced vibration has been of con-cern for a long time; initial studies were reported almost 70 years ago (see, for example, Hyde and Lintern (1929)). In Can-ada the first known study was carried out by the National Re-search Council in the late 1940s to investigate bus-induced vibrations in Winnipeg (Sutherland 1950). More recently, nu-merous studies of building vibration induced by road traffic were undertaken around the world, for example, Bata (1971), House (1973), Nelson and Viranuvut (1973), Tholen (1974), Hill (1980), Rudder (1980), Taniguchi and Okada (1981), Holmberg (1984), Yokata and Shimizu (1984), Watts (1990), Al-Hunaidi and Rainer (1991), and Hanazato et al. (1991). These studies contributed significantly to identifying the na-ture of the problem and to clarifying its extent and effect. In many of these studies, remedial measures were also investi-gated and vibration prediction methods were developed. Simi-larly, numerous other studies were undertaken to investigate vibrations induced by freight and passenger trains, subway trains, and streetcars (or trams).
Several remedial measures are usually suggested to reduce vibrations induced by road traffic. They include periodic main-tenance of road surfaces, traffic flow control, vehicle weight and speed control, improvement of road-subbase structure, soil improvement, screening of vibration using in-ground barriers, and the use of building isolation systems. Most of these meas-Received October 18, 1996.
Revised manuscript accepted February 28, 1997.
O. Hunaidi. Institute for Research in Construction, National
Research Council of Canada, Ottawa, ON K1A 0R6, Canada.
M. Tremblay. Laboratoire de la Ville de Montréal, 999 rue de
Louvain Est, Montréal, QC H2M 1B3, Canada. Written discussion of this article is welcomed and will be received by the Editor until February 28, 1998 (address inside front cover).
Can. J. Civ. Eng. 24: 736–753 (1997)
736
© 1997 NRC Canada
Can. J. Civ. Eng. Downloaded from www.nrcresearchpress.com by National Research Council of Canada on 08/14/13
ures, including road maintenance and speed control, are usu-ally considered impractical or not cost effective. Conse-quently, the problem continues to exist to this day. It is also believed that complaints about traffic vibrations will increase in the future for the following reasons. First, in order to main-tain traffic-induced vibrations at low levels, roads have to be resurfaced more frequently than what is normally required for good rider comfort, safety, and appearance — this is becoming increasingly difficult under present constraints on mainte-nance budgets of most cities. Second, traffic volume and axle weights of heavy vehicles are increasing. From 1972 to 1992, for example, axle weights of transit buses in Canada increased by more than 25% (Corbeil et al. 1995). Finally, new residen-tial homes are more than ever incorporating lighter construc-tion material and are being built closer to streets.
The City of Montréal, like many cities in Canada and around the world, receives complaints from owners of residen-tial homes about vibrations induced by road traffic — mainly transit buses. Complaints in Montréal are concentrated in cer-tain areas of the city underlain mostly by soft silty clay soil that is about 7–15 m deep. As part of the City of Montréal’s continuing effort to resolve traffic vibration problems, the City in collaboration with the Institute for Research in Construction of the National Research Council undertook a joint study to investigate several aspects. The main objectives of the study were as follows: (i) characterization of vibration, i.e., levels and frequency content; (ii) evaluation of transfer functions be-tween points inside and outside of buildings for prediction of vibration levels; (iii) evaluation of the effects of road condi-tions and seasonal variation in soil condicondi-tions, e.g., frost layer and ground water table; and (iv) application of existing stand-ards for evaluation of the effect of vibrations in terms of human annoyance and building damage.
Extensive measurements and detailed analysis of vibrations were carried out at nine representative sites in Montréal in order to characterize vibration levels and determine transfer functions. Measured vibration levels were evaluated with ref-erence to human annoyance and the potential for building dam-age using existing standards. Also, tests were carried out at a selected site to investigate the effects of road resurfacing and seasonal variation in soil conditions. In this paper, the major findings of the study will be presented and discussed. Details of field tests, equipment and instrumentation, and measure-ment and analysis procedures are presented first.
Field tests and measurement and analysis
procedures
Measurement sites
A total of nine residential buildings (referred to here as build-ings or sites 1 to 9) were selected in different parts of Montréal where complaints had been made about building vibration in-duced by transit buses. Buildings were selected so that they were representative of several combinations of building types and site conditions in a list of 220 complaint sites in the city, such sites consisting mostly of residential homes. Information about the selected buildings, including building and soil type and road condition, is presented in Table 1. The selected build-ings are also shown in Fig. 1. Vibration measurements were made at the beginning of the fall season.
Site 9 was selected for tests to evaluate the effect of road resurfacing — the road was scheduled for maintenance by the City during this study. The same site was also used for tests to evaluate the effects of seasonal variation in soil conditions. It should be noted that the street at this site was not a bus route, but vibration complaints by owners of homes at adjacent streets with bus routes were received by the City in the past.
Test vehicles
Vibrations in buildings were measured as generated by the following three sources: (i) a typical transit bus, (ii) a mid-size flat-bed two-axle truck, and (iii) a drop-weight device. The same truck (International model SE-1800/1974) and the same type of bus (GMC model T6H53/1981) were used at sites 1 to 8. At site 9, the bus was of the same category as that used at sites 1 to 8 but of a different make (MCI model TC401/1990), and the truck was of a flat-bed single-axle type (International model S-1900/1985). Buses were used while empty — front and rear axle loads were, respectively, about 2900 and 7100 kg for the type used at sites 1 to 8, and 3750 and 7600 kg for the type used at site 9. At site 9 only, the bus was also used while loaded with 106 sand bags (30 kg each) to simulate a rush hour bus load of 41 seated and 12 standing passengers (6 passengers near each axle). The loaded bus had a combined axle load of about 14 400 kg. The trucks at all sites were used while loaded with either sand bags or steel plates — front and rear axle loads were, respectively, about 3895 and 9050 kg (combined load for the two rear axles) for the type used at sites 1 to 8, and 4070 and 8470 kg for the type used at site 9. Although it was planned to use both the test bus and truck at each test site, at some sites only one vehicle type was available.
The falling weight device consisted of a 125 kg weight and an impact target instrumented with a load cell. The weight was dropped from a height of about 1.2 m. The peak impact force generated was about 100 kN. This load was believed to be close to the dynamic force generated by a typical transit bus traveling over a discrete irregularity in the road surface. The falling weight device produced successive multiple impacts; however, only vibration signals induced by the first impact were analysed. The frequency content of the impact load ex-tended up to about 100 Hz.
Test procedures
The drivers of the test vehicles were instructed to drive at a speed 50 km/h (posted speed limit for residential roads in Montréal) on the lane closest to buildings where measurements were made. Actual vehicle speeds varied by no more than
±5 km/h around this speed, as determined from a hand held radar gun. Except for site 9, roads at the selected sites remained open to public traffic during the measurements. Each test was repeated three times and the results were averaged to reduce the effect of variations in vehicle speed and travel path. The drop weight device was set up in the parking lanes in front of the buildings where vibration measurements were made.
Measurement locations
Vibrations were measured simultaneously on the ground at approximately 1 m from the front of buildings, at corners of basement floor slabs, on external foundation walls facing the road, and at corners and midpoints of floors of a street-facing room in aboveground storeys. On the ground and at corners of
Hunaidi and Tremblay 737
© 1997 NRC Canada
Can. J. Civ. Eng. Downloaded from www.nrcresearchpress.com by National Research Council of Canada on 08/14/13
floors, vibrations were measured in both the vertical and trans-verse (perpendicular to the road) directions. At midpoints of floors, vibrations were measured in the vertical direction only. For measurements on the ground, accelerometers were mounted using 300 mm long aluminum stakes (see Al-Hunaidi and Rainer (1990) for more information about transducer mounting methods). On rough concrete surfaces in basements and foundation walls, accelerometers were mounted using small aluminum plates which were attached to the surface us-ing 5-min epoxy glue. Accelerometers were directly attached using double-sided adhesive tape for measurements on smooth surfaces, e.g., wood flooring.
Instrumentation and data acquisition
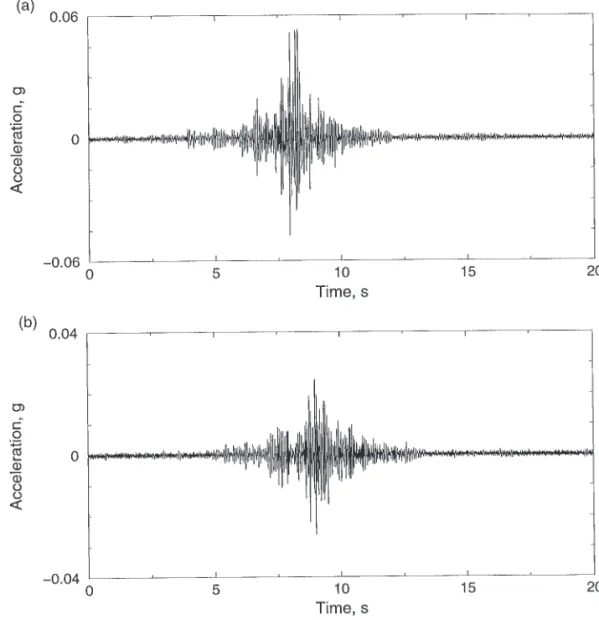
Vibration measurements were made using servo electro-mechanical acceleration transducers (Sunstrand’s Q-Flex models QA-1100 and 1400) having a sensitivity of 10 V/g (g is the unit of gravitational acceleration) and a linear frequency response (±5%) in the range DC-300 Hz. Vibration signals from accelerometers were acquired directly in digital form at a sampling frequency of 500 samples/s using a 16-channels PC-based data acquisition system incorporating analog-to-digital (A/D) conversion board and low-pass filters and power gain boards (see Al-Hunaidi et al. (1994) for details of this system). In order to avoid frequency aliasing, vibration signals were low-pass filtered at 125 Hz. Also, vibration signals were amplified to utilize the full-scale of the voltage range of the A/D board in order to increase the signal-to-noise ratio. At the onset of a test vehicle pass-by, data acquisition was initiated for a period of about 20 s. If vehicles other than the test vehicle passed in front of the measurement building during this period, data were discarded and the test repeated. After each test vehi-cle pass-by, vibration signals were displayed on the computer screen to check whether the voltage range of the data acquisi-tion system was exceeded. If overloaded channels were de-tected, necessary adjustments were made to amplification settings and the test was repeated. Typical vibration signals measured for the test bus and truck are shown in Fig. 2.
Data analysis
1/3 octave frequency band analysis
In the international standard for evaluation of human response to building vibration (ISO 1989), 1/3 octave frequency band analysis is the preferred method for frequency analayis. The reason for this preference is that when this standard was being drafted, fixed narrow-band frequency analysis was not com-monly available (Ashley 1978). Processing of vibration signals to obtain 1/3 octave frequency band spectra was performed in this study using the computer program TOAP developed at NRC for 1/3 octave analysis and frequency weighting using recursive digital filters on PCs (Al-Hunaidi et al. 1992). The lowest and highest 1/3 octave bands used in the analysis were 4 and 100 Hz, respectively. Root-mean-square (rms) values of acceleration signals induced by test vehicles were calculated using a 2 s long rectangular time window. It should be noted here that the use of a rectangular window implies that all points have the same weight in the rms averaging process. This should not be confused with the use of smoothing windows in narrow-band frequency analysis to eliminate amplitude leak-age. The 2 s long window (i.e., integration time) contained about 7 cycles for frequencies in the lowest 1/3 octave band used in the analysis. This exceeded the usual requirement of at least 3 cycles needed for reducing the ripple effect of the aver-aging process. Due to the effect of the rise time of 1/3 octave band filters, it was necessary (as usually is the case) to discard the first few averages before valid rms values are obtained. It was verified that for the frequency range used in this study, discarding the first average was sufficient. For each test vehi-cle pass-by, only maximum rms values in each 1/3 octave band were retained. Maximum rms values of three repetitions of the same field test were then used to calculate a mean rms value.
Frequency-weighting
Acceleration signals were also frequency-weighted according to equal human response curves to allow for the frequency dependence of human response to vibration. Frequency-weighting was performed using the computer program TOAP Distance
from road (m)
Soil profile Site
No. Building type
No. of storeys
Year of
construction Soil typea
Thickness (m) Underlying formationa Type of street Intensity of traffic Road conditionc
1 Semi-detched duplex 2 14 1956 Sa/Cl 1.2/4-b Sa Residential Light 3.60
2 Multistorey 3 9 1925 Cl 14.5 Till Main Heavy 1.80
3 Triplex 3 12 1900 Cl 10.4b Till Main Heavy 2.30
4 Detached bungalow 1 9 1990 Cl 10.2 Till Residential Medium 2.95 5 Semi-detached cottage 2 8 1981 Sa/Cl 2.7/6.2b — Main Heavy 2.65
6 Detached cottage 2 5 1945 Cl 6.1 Till Residential Heavy 1.80
7 Bungalow 1 7 1957 Cl 8 Till Residential Medium 3.30
8 Detached multistorey 2 8 1985 Cl 13.7 Till Residential Medium 2.75
9 Duplex 2 6 ~1945 Cl 11.9 Till Residential Light 4.00
aCl, silty clay; Sa, sand or silty sand; till, mixture of silt, sand, and gravel. bApproximate thickness only (borehole is distant from the site).
cRoad condition index runs on a scale from 0 to 5 (0 corresponds to excellent condition and 5 corresponds to very poor condition). A value greater than 3 is
.used by the City of Montréal to indicate that repairs are required.
Table 1. List of sites selected for vibration measurements.
Can. J. Civ. Eng. Vol. 24, 1997 738
© 1997 NRC Canada
Can. J. Civ. Eng. Downloaded from www.nrcresearchpress.com by National Research Council of Canada on 08/14/13
F ig. 1. Bui ldin gs at selected complai nt si tes . Huna idia nd Trem blay 739 ©1997 NRCC anada
Can. J. Civ. Eng. Downloaded from www.nrcresearchpress.com by National Research Council of Canada on 08/14/13 For personal use only.
using digital filters of the recursive type, which conform to specifications of band-limiting and band-pass filters for fre-quency weightings Wxyand Wzper ISO 8041 (ISO 1990b) in
the horizontal and vertical directions, respectively (see Al-Hunaidi and Guan (1996) for details). Root-mean-square values of fre-quency-weighted acceleration signals were then calculated us-ing the same integration time and discardus-ing the same number of initial averages as for the 1/3 octave band analysis described above.
Narrow-band frequency analysis
Narrow-band frequency analysis using the fast Fourier trans-form (FFT) was pertrans-formed in order to resolve in detail the frequency content of the measured vibration signals. The number of points used in FFT calculations was large enough to contain the major part of the signal. This eliminated the need for smoothing windows, hence avoiding difficulties associated with these windows in the analysis of transient signals (Al-Hunaidi et al. 1994).
Transfer functions
Transfer functions (i.e., ratios) between different measurement
points were calculated for both the 1/3 octave band and fre-quency-weighted acceleration values. Transfer functions were first calculated for acceleration values obtained for each vehi-cle pass-by. Then a mean value was calculated from three vehicle pass-bys for the same test.
It should be noted that unlike transfer functions obtained from usual spectral analysis methods, the method described above does not provide a measure for judging whether the vi-bration signals at the two particular points used in the transfer function calculation are coherent, i.e., generated by the same source. In this study, coherence between vibration signals was verified in two ways. First, a comparison was made between ambient vibration values and those due to test vehicles. In the frequency range of 8 to 25 Hz it was found that vibrations in-duced by test vehicles are much higher than ambient vibrations; elsewhere this was not so. This was taken as an indication of coherent signals only for 1/3 octave frequency bands from 8 to 25 Hz. Second, in the frequency range for 1/3 octave frequency bands between 8 and 25 Hz, the minimum and maximum of transfer functions obtained for each band from three test repe-titions were compared. In most cases, there were insignificant differences and again this was taken as an indication of coher-ence between the signals in the said frequency range.
Fig. 2. Typical acceleration signals induced by (a) empty bus and (b) loaded truck at 50 km/h.
Can. J. Civ. Eng. Vol. 24, 1997 740
© 1997 NRC Canada
Can. J. Civ. Eng. Downloaded from www.nrcresearchpress.com by National Research Council of Canada on 08/14/13
Can. J. Civ. Eng. Downloaded from www.nrcresearchpress.com by National Research Council of Canada on 08/14/13 For personal use only.
Can. J. Civ. Eng. Downloaded from www.nrcresearchpress.com by National Research Council of Canada on 08/14/13 For personal use only.
Characteristics of vibration
Vibration levelsVertical vibration levels measured inside buildings at the sites selected in this study are shown in Figs. 3 and 4 for the bus and truck, respectively. At all sites, vertical acceleration values induced by the bus at midpoints of floors of first and (or) second storeys exceeded the guide value, according to ISO 2631/2 (ISO 1989), above which adverse comment by occu-pants may begin to arise. For the truck, vertical vibration levels exceeded the guide value only at some sites. Building vibration levels in the transverse direction (not shown here) were much smaller than those in the vertical direction for both the bus and the truck. Frequency-weighted values of transverse accelera-tion did not exceed ISO’s guide value at most measurement points in buildings.
The ISO guide vibration values referred to above were cal-culated by multiplying the lowest rms values in ISO’s base-curves by a factor of 2 (i.e., the lower bound specified for daytime “intermittent vibration”). For vertical vibrations, this resulted in a guide value of 0.001g (rms). According to ISO 2631/2, intermittent vibration is a string of vibration incidents, each of short duration, separated by intervals of much lower vibration levels. For residential roads the pass-by frequency of heavy vehicles is low and therefore the induced vibration may be more appropriately described as “transient vibration” with several occurrences per day. A transient vibration is normally defined as a rapid build-up to a peak, followed by a damped decay which may or may not involve several cycles of vibra-tion. However, the above guide value was found to be appro-priate for evaluating bus-induced vibration as intermittent, if rms values of frequency-weighted acceleration signals are cal-culated using a 2 s integration time (Al-Hunaidi 1996).
It is worth noting that vibration levels for the building at site 9 (see Figs. 3 and 4) substantially exceeded the above guide value. It is unlikely that these levels would be tolerated by building occupants for an extended time period. As men-tioned earlier, however, there is no bus route at this site.
It can be observed from Figs. 3 and 4 that vibration levels induced by buses were at least twice those induced by the trucks, although the trucks were slightly heavier than the buses. The fact that the truck used at sites 1 to 8 had two rear axles was ruled out as the cause, since vibrations measure-ments made at site 9 where the test truck had only one rear axle also showed bus-induced vibrations twice those induced by the truck. The same trend was also observed in an earlier
study in a different city in which a single-axle test truck and bus of the same weight category were used (Al-Hunaidi and Rainer 1991). The cause for this phenomenon was attributed to the different types of suspension systems of the two vehicles — air-bag spring for the bus and steel multi-leaf spring for the truck (Al-Hunaidi et al. 1996a). Similar results were reported by Watts (1990) using trucks with air-bag and steel multi-leaf suspension systems.
Predominant frequencies
As seen from Figs. 3 and 4, vertical vibration signals induced by the test vehicles were significant mainly at 1/3 octave bands in the range from 10 to 20 Hz. A list of predominant 1/3 octave band and narrow-band frequencies of vertical ground vibra-tions induced by the bus and truck is presented in Table 2. The predominant frequencies of bus-induced vibration at most sites generally fell in the narrow range between 10 and 12.5 Hz. Predominant frequencies of truck-induced vibration, however, were spread over a wider frequency range. As for vibrations levels discussed earlier, the differences between predominant frequencies of vibration induced by buses and trucks were also attributed to differences in their suspension systems — bus-in-duced vibrations being mainly due to its axle hop (Al-Hunaidi et al. 1996a).
It was observed from the 1/3 octave band spectra in Figs. 3 and 4 and also from the narrow-band frequency spectra of vibrations induced by the drop weight, bus, and truck (not shown here) that there is a frequency for each site below which vibration magnitudes are extremely small. Such a frequency is known as the “cutoff frequency” of the site. A site does not propagate vibrations at frequencies below its cutoff frequency. A cutoff frequency is exhibited by a site when the usually top soft soil, e.g., clay, is underlain by much stiffer soil or bedrock (Wolf 1985). The softer and (or) the deeper the top soft soil layer, the lower is the cutoff frequency of the site. Cutoff fre-quencies for the sites selected in this study are listed in Table 2. It can be seen that seven out of nine sites used in this study had a cutoff frequency equal to or higher than 6.5 Hz.
The cutoff frequency phenomenon has practical signifi-cance in that vibrations in Montréal might be reduced substan-tially if suspension systems of existing buses could be so modified or those of future ones so designed that the axle hop frequency of buses is below the cutoff frequency of most sites in Montréal (Al-Hunaidi et al. 1996a). Further, reduction in bus-induced vibrations might be achieved by damping of its axle hop amplitude and reduction of the unsprung mass of 1/3 octave frequency (Hz) Narrow-band frequency (Hz)
Site No. Truck Bus Truck Bus Cutoff
1 10, 12.5, 16 — 11, 13, 18 — 7.0 2 10, 12.5, 16 8, 10, 12.5 7, 9, 17 10 3.0 3 10, 12.5, 16 8, 10, 12.5 9 10 6.5 4 — 10, 12.5, 16 — 10, 14 9.5 5 10, 12.5, 16, 20 10, 12.5 10, 12 10 9.5 6 16, 20, 25 12.5, 16, 20 15, 20, 25 12.5, 15 12.0 7 — 10, 12.5 — 10 8.5 8 12.5, 16, 20 — 13, 17 — 4.5 9 12.5, 16, 20 12.5, 16, 20 10, 13, 20 12, 14, 17 8.5
Table 2. List of predominant and cutoff frequencies of measurement sites.
Hunaidi and Tremblay 743
© 1997 NRC Canada
Can. J. Civ. Eng. Downloaded from www.nrcresearchpress.com by National Research Council of Canada on 08/14/13
Can. J. Civ. Eng. Downloaded from www.nrcresearchpress.com by National Research Council of Canada on 08/14/13 For personal use only.
buses, e.g., axles and wheels. Several projects are currently under way in Canada, United States, and Germany for the development of lighter urban transit buses (Corbeil et al. 1995) and Transport Canada is encouraging the development and deployment of such buses. Although the aim of developing lighter buses is mainly to reduce operational costs, the signifi-cant weight reduction will also lead to savings regarding pave-ment damage (Corbeil et al. 1995; Gibby et al. 1996) and, in the authors’ opinion, to less vibrations if the new buses also have lighter unsprung mass. This could, for example, be achieved through the use of aluminum wheels and axles. Re-cent studies show that axle loads of loaded buses currently exceed design loads of city roads and significant pavement damage is caused by transit bus traffic (Gibby et al. 1996). Therefore, “road friendly” lighter transit buses will also indi-rectly lead to reduction in vibration levels.
Transfer functions
Transfer functions were determined between rms acceleration values at the following measurement points inside and outside of buildings:
• between midpoint of first-storey floor and the ground in front of buildings,
• between midpoint of first-storey floor and the external foundation wall facing the road, and
• between midpoint of second-storey floor and midpoint of first-storey floor.
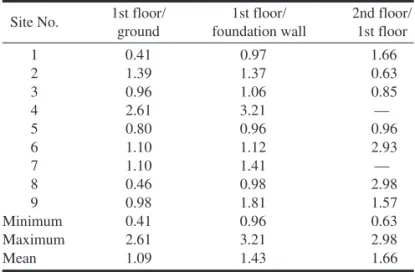
The test bus and truck were found to give similar transfer func-tions. Figure 5 shows the transfer functions obtained for both frequency-weighted accelerations and accelerations of 1/3 oc-tave frequency bands from 8 to 25 Hz. The transfer functions for frequency-weighted accelerations are also summarized in Table 3.
As expected, the transfer functions varied from one site to another (in some cases significantly), as the building type and soil conditions were different between the selected sites. The transfer functions determined in this study were also different from those reported by Jakobsen (1989) for rail-induced vibra-tion in Danish houses. For the purpose of predicting frequency-weighted vibration levels inside buildings, the following generalizations are suggested based on the results summarized in Table 3:
• acceleration values at midpoints of floors in first storeys are similar to those on the ground at 1 m from the building front;
• acceleration values at midpoints of floors in first storeys are 1 to 1.5 times those at the external foundation walls facing the road; and
• acceleration values at midpoints of floors in second storeys are 2 times those at midpoints of floors in first storeys. The above generalizations for transfer functions may only be used for rough prediction of acceleration values inside a building from those measured on the ground or the external foundation wall. For more accurate estimates of vibration lev-els at a particular site, it is recommended to use the transfer functions obtained for a site in this study that is similar to the site at hand. If no match can be made, maximum values in Table 3 may be used (to be on the conservative side!). Need-less to say, vibration measurement locations on the ground or on the external wall used for prediction of vibration values inside buildings should be similar to those used in this study. Transfer functions obtained with the drop device (not shown here) were similar to those obtained with both the bus and the truck. Therefore, this device may be used in the future as a convenient alternative to the use of test vehicles for ob-taining information on transfer functions at other sites. The effectiveness of the drop weight in obtaining information on the cutoff frequency and natural frequencies of soil sites is also an advantage.
Effect of road surface condition
Improving the condition of the road surface, e.g., by resurfac-ing, is the most frequently suggested and practised approach for reducing the level of building vibration generated by road traffic. However, the City of Montréal has encountered situ-ations in the past in which vibration complaints have persisted even after roads were resurfaced with new overlays. Informa-tion about vibraInforma-tion reducInforma-tion ratios as a result of road resur-facing at complaint sites would therefore be helpful to the City in the planning of road maintenance.
There is only limited information in the literature on traf-fic-induced vibrations versus commonly used measures of road surface condition. Rudder (1978) developed an empirical method for prediction of traffic-induced building vibration which incorporated the present serviceability rating (PSR) in-dex commonly used by road and highway personnel for rating road surface conditions. The PSR index runs on a scale from 0 to 5 — a value between 0 and 1 indicates a very poor dition and a value between 4 and 5 indicates a very good con-dition. As an approximation, Rudder (1978) suggested that traffic-induced vibration increases by 62% (or 4.2 dB) with each unit increase in the PSR index. The applicability of this relationship to conditions in Montréal was not clear.
Tests were carried out in this study to experimentally inves-tigate the effect of improving the road surface condition on the level of traffic-induced vibration and to verify Rudder’s rela-tionship at a selected site in Montréal. Although tests were performed at only one site, and therefore may not be sufficient to develop a general conclusion, the results can be found useful to assess the degree of improvement for sites with similar con-ditions.
Site No. 1st floor/ ground 1st floor/ foundation wall 2nd floor/ 1st floor 1 0.41 0.97 1.66 2 1.39 1.37 0.63 3 0.96 1.06 0.85 4 2.61 3.21 — 5 0.80 0.96 0.96 6 1.10 1.12 2.93 7 1.10 1.41 — 8 0.46 0.98 2.98 9 0.98 1.81 1.57 Minimum 0.41 0.96 0.63 Maximum 2.61 3.21 2.98 Mean 1.09 1.43 1.66
Table 3. Summary of transfer functions for frequency-weighted
acceleration.
Hunaidi and Tremblay 745
© 1997 NRC Canada
Can. J. Civ. Eng. Downloaded from www.nrcresearchpress.com by National Research Council of Canada on 08/14/13
Description of tests
Tests were performed at a residential road (site 9 in Table 1) which was scheduled for resurfacing by the City during this study. Before resurfacing, the road had a City of Montréal condition rating index of 4 (note: City of Montréal’s rating index runs on a scale of 0 to 5 but opposite to that of the PSR index defined above — a value of 0 corresponds to excellent and 5 corresponds to very poor conditions; a value greater than 3 is used by the City personnel to indicate that repairs are needed).
The tests were carried out at controlled speeds using a bus and a truck (described earlier) as follows:
(i) empty bus travelling at speeds of 25 and 50 km/h, (ii) loaded bus traveling at speeds of 25 and 50 km/h, and (iii)loaded truck traveling at speeds of 25 and 50 km/h.
Each test was repeated three times and the results were averaged in order to reduce the effect of variations in vehicle speed and travel path. The same measurement locations were used before and after the road was resurfaced. During vibration measurements, the test road and the nearest cross road north of the test building were closed to public traffic.
Tests were also performed with the drop weight device de-scribed earlier to obtain information about the site charac-teristics, e.g., cutoff frequency and natural frequencies. These tests were performed before the road was resurfaced.
Vibration measurements were planned to be made immedi-ately before and after the road was resurfaced in order to re-duce the effect of variations in site conditions, e.g., level of
ground water table. However, due to operational constraints, there was a 3-month period between the two sets of measure-ments — the before-resurfacing measuremeasure-ments were made in the summer and the after-resurfacing ones were made in the fall. Consequently, it is not known for certain if the site con-ditions, especially the water table level, were similar before and after the road was resurfaced. Fortunately, as will be shown later, the effect of the ground water table on vibration levels was found to be insignificant.
Acceleration ratios
Root-mean-square values of frequency-weighted accelerations induced by the test vehicles before and after the road was resurfaced are listed in Tables 4 and 5, respectively. The cor-responding ratios between vibrations induced before and after the road was resurfaced are listed in Table 6. It can be seen that vibration ratios were dependent on vehicle type, speed, and the measurement location. The reason for this is not clear, but several factors are believed to be at play, including the vari-ation in frequency content of vibrvari-ations versus vehicle suspen-sion system and the effect of site and building resonance frequencies. The effects of these factors are interrelated and are too complex to unravel within the scope of this study.
For the 50 km/h vehicle speed (the posted limit for residen-tial roads in Montréal), the ratios obtained with empty and loaded buses and the loaded truck were found to be similar. For this vehicle speed, road resurfacing was found to reduce acceleration levels by at least a factor of 6.4 (note: this lower
25 km/h 50 km/h
Bus Truck Bus Truck
Location Empty Loaded Empty Loaded Empty Loaded Empty Loaded
Ground — 2.09 — 2.03 6.87 6.58 — 3.39
External foundation wall — 1.14 — 1.03 3.69 3.15 — 1.60
Midpoint of floor in 1st storey — 2.07 — 2.12 6.70 6.42 — 3.07 Midpoint of floor in 2nd storey — 3.57 — 3.81 10.49 9.82 — 4.77
Table 4. Frequency-weighted vertical accelerations (10-3g, rms) before road resurfacing.
25 km/h 50 km/h
Bus Truck Bus Truck
Location Empty Loaded Empty Loaded Empty Loaded Empty Loaded
Ground 0.41 0.44 — 0.19 0.73 0.62 — 0.34
External foundation wall 0.32 0.31 — 0.14 0.43 0.37 0.19
Midpoint of floor in 1st storey 0.36 0.39 — 0.18 0.77 0.64 — 0.40 Midpoint of floor in 2nd storey 0.78 0.94 — 0.37 1.51 1.53 — 0.57
Table 5. Frequency-weighted vertical accelerations (10-3g, rms) after road resurfacing.
25 km/h 50 km/h
Bus Truck Bus Truck
Location Empty Loaded Empty Loaded Empty Loaded Empty Loaded
Ground — 4.72 — 10.91 9.37 10.55 — 9.91
External foundation wall — 3.61 — 7.47 8.53 8.63 — 8.47
Midpoint of floor in 1st storey — 5.28 — 11.60 8.67 10.06 — 7.71 Midpoint of floor in 2nd storey — 3.80 — 10.33 6.95 6.40 — 8.32
Table 6. Ratio between acceleration values before and after road resurfacing.
Can. J. Civ. Eng. Vol. 24, 1997 746
© 1997 NRC Canada
Can. J. Civ. Eng. Downloaded from www.nrcresearchpress.com by National Research Council of Canada on 08/14/13
value was for the second-storey measurement point; ratios were higher at other points in the building). For PSR values of 4 and 0 representing road conditions before and after resurfac-ing, Rudder’s (1978) approximate relationship would give a reduction factor of 6.9. This is in good agreement with the minimum reduction factor of 6.4 found above. Therefore, it may be a reasonable suggestion for the time being to apply Rudder’s relationship for site conditions in Montréal. Needless to say, however, more tests at other sites having PSR values different from that of the site selected in this study would be required to further validate the applicability of this relation-ship.
Vibration levels
Vibration levels listed in Table 4 for the bus and the truck at 25 and 50 km/h before road resurfacing were substantially higher than the ISO 2631/2 guide value of 0.001g (rms). The corre-sponding vibration levels after the road was resurfaced were significantly reduced, as can be seen from the values listed in Table 5. For the truck, vibration levels became lower than the guide value at all points inside the building. For the bus at 50 km/h, however, vibration levels in the second storey re-mained higher than the guide value by about 50% (vibration levels were six times the ambient acceleration levels of 0.24×10⁻³g (rms))! Tenants might continue to complain in
view of past experience by the City of Montréal that for some sites vibration complaints persisted even after the road was resurfaced.
It is interesting to note that vibration levels induced by the empty bus at 50 km/h (both before and after the road was resurfaced) were similar to and in some cases higher than the corresponding vibration levels induced by the loaded bus. The same trend was observed earlier by Al-Hunaidi and Rainer (1991) using an empty and a loaded water truck and by Watts (1990) using empty and loaded trucks. Also worth noting in Table 4 is that vibration levels induced by the bus and the truck at a speed of 25 km/h before the road was resurfaced were similar. At 50 km/h, however, vibrations induced by the bus were more than two times those induced by the truck. Obvi-ously, the relationship between vehicle speed and vibration levels depends on the vehicle characteristics.
Effect of seasonal variations in soil
conditions
Soil conditions at complaint sites, particularly the frost layer in winter and the level of ground water table, are believed to influence the level of traffic-induced vibrations. However, the extent of this influence is not clear. In a study of vibrations induced by buses in Winnipeg, Sutherland (1950) reported that vibrations measured in winter while the top soil was frozen were significantly less than those measured in summer.On the other hand, subway-induced vibrations in buildings that were measured more recently in Toronto were found to be slightly higher in winter (while the top soil was frozen) than in sum-mer.1Tests were performed in this study to determine the trend for conditions in Montréal.
Officials of many cities in Canada indicate that vibration complaints are more frequent during the thaw period in spring than in other seasons. The extent to which the higher level of ground water table in the spring thaw period adversely affect vibration levels was not known. Tests were thus performed in this study to shed some light on this issue.
Description of tests
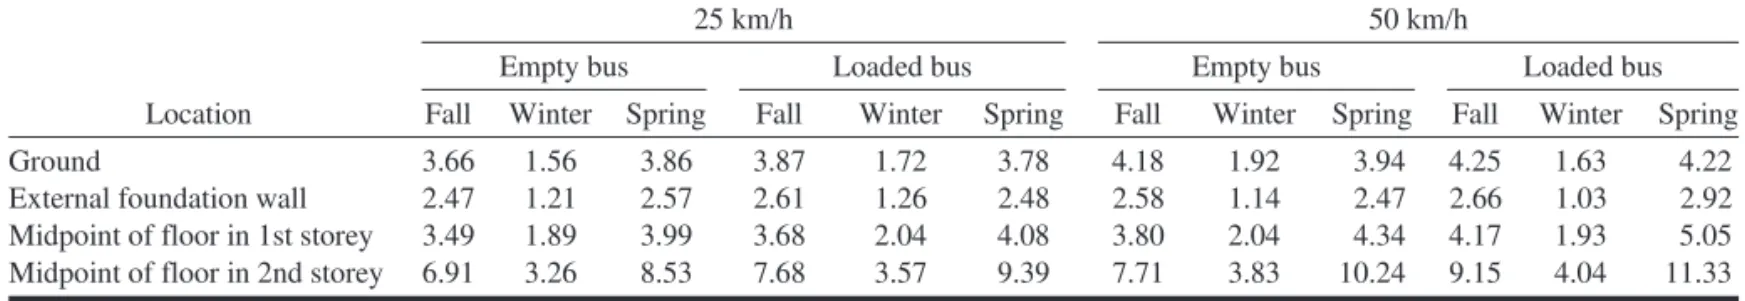
Tests were performed at site 9 after the road was resurfaced. Identical measurements of vibrations induced by a test bus were made during the fall, winter, and spring. Visual inspec-tion of the road surface at time of measurements in the different seasons indicated that the road condition was almost identical. Tests were performed using a bus while empty and loaded; no trucks were used. The test bus was driven at speeds of 25 and 50 km/h with and without a wood plank attached to the road surface. The wood plank was 3.7 cm high, 13.8 cm wide, and 90 cm long. Only the far side of the bus passed over the wood plank located as shown in Fig. 6. Only the results obtained with the wood plank attached to the road are presented here; vibration levels for tests performed with no wood plank were low and consequently the ratios between vibration levels in the
Fig. 6. Layout of site 9 showing location of wood plank attached to road surface. (All dimensions are in meters.)
1 Bracken, M. 1994. Aercoustics Engineering Limited, Rexdale,
Ont., Private communication.
Hunaidi and Tremblay 747
© 1997 NRC Canada
Can. J. Civ. Eng. Downloaded from www.nrcresearchpress.com by National Research Council of Canada on 08/14/13
various seasons were not believed to be accurate. During all tests, the road and the nearest cross road north of the test build-ing were closed to public traffic.
At the time of vibration measurements during winter, the temperature was about –5°C and the depth of top frozen soil was about 1.1 m, as found from both a soil borehole and a City of Montréal frost gauge at the site. Vibration measurements in
the spring were performed during the period when the ground water table level was believed to be highest. At the time of vibration measurements in the fall and spring, the level of the ground water table was 5.8 and 2 m below the surface, respec-tively.
Tests were also performed with the drop weight device in winter and spring. No similar tests were performed in the fall, however, due to a device malfunction; instead, the results ob-tained during summer in earlier tests are used, assuming that the levels of the ground water table were similar at the time of
25 km/h 50 km/h
Empty bus Loaded bus Empty bus Loaded bus Location Fall Winter Spring Fall Winter Spring Fall Winter Spring Fall Winter Spring Ground 3.66 1.56 3.86 3.87 1.72 3.78 4.18 1.92 3.94 4.25 1.63 4.22 External foundation wall 2.47 1.21 2.57 2.61 1.26 2.48 2.58 1.14 2.47 2.66 1.03 2.92 Midpoint of floor in 1st storey 3.49 1.89 3.99 3.68 2.04 4.08 3.80 2.04 4.34 4.17 1.93 5.05 Midpoint of floor in 2nd storey 6.91 3.26 8.53 7.68 3.57 9.39 7.71 3.83 10.24 9.15 4.04 11.33
Table 7. Frequency-weighted vertical accelerations (10-3g, rms) induced by test buses in fall, winter, and spring.
25 km/h 50 km/h Location Empty bus Loaded bus Empty bus Loaded bus
Ground 0.42 0.44 0.46 0.38
External foundation wall 0.49 0.48 0.44 0.39 Midpoint of floor in 1st storey 0.54 0.55 0.54 0.46 Midpoint of floor in 2nd storey 0.47 0.46 0.50 0.44
Table 8. Ratio between bus-induced accelerations in winter and fall (winter/fall).
Fig. 7. Vertical response and coherence functions obtained with the
drop weight device in summer and winter for the ground in front of building at site 9.
Fig. 8. Narrow-band frequency spectra of acceleration recorded in
(a) fall and (b) winter on ground in front of building at site 9 (empty bus at 50 km/h).
Can. J. Civ. Eng. Vol. 24, 1997 748
© 1997 NRC Canada
Can. J. Civ. Eng. Downloaded from www.nrcresearchpress.com by National Research Council of Canada on 08/14/13
measurements in summer and fall. Site response functions ob-tained with the drop weight device were used as an additional source of information on the effect of the frost layer and vari-ation in ground water table level.
Frozen soil samples were obtained at a depth of about 0.6 to 0.8 m in front of the building at the time of winter tests. Dynamic shear moduli and damping ratios of the soil samples while frozen and after they were allowed to thaw were deter-mined from resonant column tests (Al-Hunaidi et al. 1996b).
Fall versus winter vibration levels
Vibration levels and ratios obtained during the fall and winter are listed in Tables 7 and 8, respectively. Vibration levels measured in winter were about one half those measured in the fall. This is in agreement with the results reported by Suther-land (1950) for similar vibration measurements in Winnipeg. Ratios of vibrations measured by Sutherland (1950) were gen-erally higher than those found in this study. This is believed to be due to the depth of the frost layer during Sutherland’s meas-urements being 0.9 m, compared with 1.1 m in this study, and (or) due to the dominant frequency at the site of Sutherland’s measurements in Winnipeg being about 7.5 Hz, compared with 13 Hz in this study.
Vertical response and coherence functions obtained with ten load impacts using the drop weight device during summer and winter are shown in Fig. 7 for the ground measurement locations. The coherence is close to 1 over the frequency range that is of interest regarding traffic vibrations, i.e., 8–20 Hz, thus indicating a high signal-to-noise ratio. In this frequency range, it can be seen that the response function obtained in summer is higher than that obtained in the winter. This is
con-sistent with the results obtained using the test bus. For frequen-cies higher than about 40 Hz, however, the response function obtained in winter has higher magnitudes than that obtained in the summer. This seems to corroborate the observation men-tioned earlier that subway-induced building vibrations in Toronto are higher in winter than in summer, as the dominant frequency of these vibrations is between 40 and 50 Hz.
Results of resonant column tests on frozen and unfrozen soil samples taken at the site used in this study show that the stiffness of soil samples while frozen is about 30–50 times the stiffness after they were allowed to thaw. In addition, the damping ratio obtained with frozen samples was roughly two times that obtained with thawed samples. Apparently the in-crease in stiffness and damping of the top part of the soil led to smaller vibrations (i.e., smaller dynamic deformations) for frequencies up to 30 Hz. On the other hand, the increase in stiffness of the top frozen part of the soil has led to a major shift for the dominant frequency in the site response.
Finally, it was observed that the range of predominant frequencies of vibrations measured in the fall was wider than the frequency range of vibrations measured in the winter, i.e., the former had higher levels at higher fre-quencies (e.g., 20–30 Hz). This can be seen, for example, from the narrow-band spectra shown in Fig. 8. The following may provide the reason. Attenuation of vibrations in soils, due to material damping only, along the direction of wave propa-gation, can be expressed as follows (Richart et al. 1970): [1] A2=A1exp[–α(r2– r1)]
where A1and A2are vibration amplitudes at distances r1and r2
from the vibration source, respectively;αis the coefficient of attenuation which is related to the soil damping ratio and fre-quency of vibration by
[2] α =2πfD c
where f is frequency, D is damping ratio, and c is wave propa-gation velocity. Because of the exponent in the above attenu-ation relattenu-ationship, a higher damping ratio in winter will lead to greater attenuation at high frequencies than at low ones.
Spring versus fall vibration levels
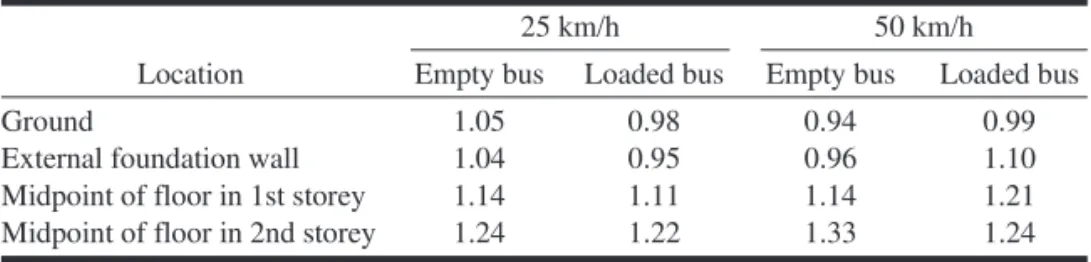
Vibration levels and ratios obtained during the spring and fall are listed in Tables 7 and 9, respectively. Vibration levels measured during the thaw period in spring were only slightly higher than those measured in the fall. The highest ratio of 1.33 occurred in the second storey.
The increase in vibration levels in the spring is not as high as expected, considering that more vibration complaints are usually made during this season. Possibly, the water table level at the time of vibration measurements made in the spring was not as high as usual during the snow thaw period. On the other hand, it might be speculated that the higher number of complaints in the spring is in fact due to the significantly lower vibration levels during winter. The “quiet” winter period might be leading to a loss of familiarity with vibration and sub-sequently leading to a decrease in tolerance as vibration levels increase again in the spring.
Vertical response and coherence functions obtained with the drop weight device in summer and spring are shown in Fig. 9 for the ground measurement locations. The coherence
Fig. 9. Vertical response and coherence functions obtained with the
drop weight device in summer and spring for the ground in front of building at site 9.
Hunaidi and Tremblay 749
© 1997 NRC Canada
Can. J. Civ. Eng. Downloaded from www.nrcresearchpress.com by National Research Council of Canada on 08/14/13
is close to 1 over the frequency range of interest, i.e., 8–20 Hz, thus indicating a high signal-to-noise ratio. In this frequency range, the response function of the ground obtained in the spring is similar to or slightly lower than that obtained in sum-mer. This trend is in agreement with the ratios listed in Ta-ble 10, although drop weight tests performed in the summer were used as a substitute for those that could not be performed in the fall.
Human response to vibration
Vibrations in buildings may be unacceptable to building ten-ants for one or more of the following reasons: annoying physi-cal sensations that vibration may produce in the human body; interference with activities such as sleep, conversation, and work; annoying noise caused by “rattling” of window panes, walls, and loose objects; fear of damage to the building and its contents; and interference with proper operation of sensitive instruments and (or) processes. For vibrations induced in resi-dential buildings by road traffic, experience has shown that tenants are likely to complain if vibration levels are only slightly above the perception threshold — the major concern being fear of damage to the building or its contents. Within residential areas, existing vibration standards report that there is a wide variation in vibration tolerance. Possibly, this is caused by variation of the perception threshold and differences in psychosocial and socioeconomic conditions among indi-viduals.
The International Organization for Standardization (ISO) and several countries have published standards that provide guidance for evaluation of human response to continuous, in-termittent, and transient vibrations in buildings. Tentative guidance is provided in the standards regarding satisfactory vibration levels, i.e., levels at which adverse comment may begin to arise or levels below which the probability of reaction is low. No such standards have yet been adopted in Canada. Three standards were used to evaluate human response to the
vibration levels measured for transit buses in this study. They included standards published by the International Stand-ardization Organization (ISO 1989), and standards organiza-tions in Britain (BSI 1984) and the United States (ASA 1983). Review of the above standards, details on evaluation of vibration levels measured in this study, and recommendations for evaluation methods were reported by Al-Hunaidi (1996). It was found that the guidance provided by the standards is not clear when used for evaluation of vibrations induced by transit buses. Bus-induced vibrations have relatively short duration and complex amplitude characteristics. The standards, how-ever, seem to be geared for evaluation of continuous and in-termittent vibrations such as that induced by machinery and pile driving, and impulsive vibrations such as that induced by blasting.
The following two major difficulties were encountered in applying the standards. First, there was confusion regarding the classification of these vibrations, e.g., as intermittent or transient vibrations. Both the ISO and American standards mention vibrations induced by road traffic as examples for intermittent vibration, which in both standards is treated in the same manner as continuous vibration. The British standard gives no examples; and it groups intermittent and transient vibrations under the same category. Vibration guide values provided by the standards depend on the category of vibration. Second, although vibration levels are provided in the standards in terms of rms values, there is no specification regarding the integration time for rms calculation. For vibration signals with short time duration and time-varying amplitude, which is the case for vibrations induced by buses, rms values are signifi-cantly influenced by the integration time. For impulsive sig-nals, the American standard suggests using the peak method. The British standard offers the peak, root-mean-quad (rmq), and vibration dose value (VDV) as alternative methods for evaluation of transient signals. The ISO standard identifies these methods, but it is not clear whether it intended to recom-mend them as alternative methods. This aspect of the various standards was confusing.
In order to determine an appropriate method for the evalu-ation of vibrevalu-ation signals measured in this study, vibrevalu-ations were analysed using the following methods (Al-Hunaidi 1996): (i) rms method, (ii) rmq method, (iii) peak method, and (iv) VDV method. Two sets of integration time were used for rms and rmq calculations. Also, vibration was evaluated as both continuous and transient with several occurrences per day. Subsequently, the following two evaluation methods were identified as the most appropriate (Al-Hunaidi 1996), in view of the measured vibration levels and complaints at the selected sites:
• Method I: rms or rmq acceleration evaluated with respect to the base value of 0.005 m/s2specified by ISO 2631/2 (ISO
Peak velocity (mm/s) Site No. Vertical Transverse
2 0.89 — 3 0.80 — 4 0.62 0.20 5 1.55 0.26 6 0.25 0.27 7 0.79 0.16 9 2.23 0.71
Table 10. Peak particle velocities in basements
induced by test buses at 50 km/h.
25 km/h 50 km/h Location Empty bus Loaded bus Empty bus Loaded bus
Ground 1.05 0.98 0.94 0.99
External foundation wall 1.04 0.95 0.96 1.10 Midpoint of floor in 1st storey 1.14 1.11 1.14 1.21 Midpoint of floor in 2nd storey 1.24 1.22 1.33 1.24
Table 9. Ratio between bus-induced accelerations in spring and fall (spring/fall).
Can. J. Civ. Eng. Vol. 24, 1997 750
© 1997 NRC Canada
Can. J. Civ. Eng. Downloaded from www.nrcresearchpress.com by National Research Council of Canada on 08/14/13
1989) and a multiplication factor of 2. This results in a satis-factory acceleration value (rms) of 0.01 m/s2, which is twice
the perception threshold of the most sensitive people. The rms or rmq values should be calculated using a 2 s integration time over the high amplitude portion of acceleration signals. • Method II: Peak acceleration evaluated with respect to the
base value of 0.007 m/s2specified by ISO 2631/2 (ISO 1989)
and a multiplication factor of 30 together with multiplication factors recommended by ISO 2631/2 for the number and dura-tion of events.
In the above two methods, acceleration signals need to be frequency-weighted according to ISO 8041 (ISO 1990b). If, on the other hand, velocity signals are measured and the fre-quency content in the signals is mostly above 8 Hz, frefre-quency- frequency-weighting is not needed — humans respond equally to vibrations at frequencies at or above 8 Hz. For velocity signals, the base values to be used in methods I and II are 0.1 mm/s (rms) and 0.14 mm/s, respectively.
Potential for building damage
In some cases, owners of residential homes may make claims about vibration-induced building damage such as cracks in walls and ceilings, separations of masonry blocks, or cracks in the building foundation. Although vibration levels in buildings induced by road traffic are rarely high enough to be the direct cause of damage, they could contribute to the process of dete-rioration from other causes. Buildings usually have residual strains in their components as a result of uneven soil move-ment, moisture and temperature cycles, poor maintenance, and (or) past renovations and repairs. Therefore small vibration levels induced in buildings by road traffic (and similarly by other man-made vibrations such as blasting and pile driving) could trigger damage by “topping up” residual strains. Conse-quently, it is difficult to establish a vibration level above which traffic-induced vibration may cause building damage. It can be argued that such damage might be triggered or caused by ac-tivities in the home such as jumping on stairs or floors and slamming doors, which can induce vibration levels higher than those induced by road traffic. On the other hand, it could be argued that activities in buildings cause local and less severe deformation patterns in buildings compared to those caused by stress waves in the ground induced by traffic. Also, when buildings are subjected to vibration for extended periods, as for vibrations caused by road traffic, the possibility of fatigue damage exists if the induced dynamic stresses are high enough. In addition to damage caused directly by vibration, it should be acknowledged that there is a potential of indirect damage caused by differential movement due to soil densification. The latter is particularly known to happen when loose and water-saturated cohesionless soils are subjected to vibration.
In view of the above remarks, it should not be surprising that controversy still continues to surround the issue of vibra-tion-induced building damage. Nonetheless, several countries have adopted standards that provide guidance on the evalu-ation of the effect of vibrevalu-ation on buildings — no such nevalu-ational standards have yet been adopted in Canada; some provinces have, however, adopted guide values for vibrations induced by blasting, e.g., Ontario (Ministry of the Environment 1978).
Vibration levels measured in this study for transit buses
were evaluated to determine their potential for building dam-age. The following standards and criterion were used: — German standard DIN 4150 (DIN 1984),
— Swiss standard SN 640 312 (ASHE 1978), — British standard BS 7385 (BSI 1993), and
— U.S. Bureau of Mines (USBM) criterion (Siskind et al. 1980).
These standards provide guide values in terms of fre-quency-dependent peak particle velocity measured in base-ments near foundation walls or on the ground close to buildings (the German standard also provides values for up-permost storeys). The probability of building damage due to vibration below the guide values is very small. The interna-tional standard ISO 4866 (ISO 1990a), which also deals with the measurement of vibrations and evaluation of their effects on buildings, does not yet include such guide values (most likely due to the controversy that continues to surround this issue). Damage to buildings is generally defined in the stand-ards as formation of cracks, falling away of plaster, the en-largement of cracks already present, and the separation of partitions or intermediate walls from load-bearing walls. For residential buildings of wooden construction and vibration at a frequency of 10 Hz or higher, the lowest guide value in the standards is that specified by the Swiss standard at 5 mm/s.
In this study, only acceleration time histories were meas-ured. Velocity time histories were obtained by indirectly inte-grating the measured acceleration time histories in the frequency domain. In this process, acceleration time records were transformed into the frequency domain using a 1024-point fast Fourier transform (FFT) with 50% overlapping Han-ning windows. Then, FFT components below 2.5 Hz were set to zero to avoid low frequency drifting, and those above 2.5 Hz were divided by the corresponding frequencies. The modified FFT spectrum was then inverse fast Fourier transformed (IFFT) to obtain velocity time records. Acceleration levels be-low 2.5 Hz were extremely small (see the section on narrow-band spectra). Hence, errors introduced by discarding components below 2.5 Hz are insignificant.
Peak particle velocities of vibrations in basements near foundation walls are listed in Table 10 for measurements made in this study for test buses at 50 km/h. It can be seen that peak particle velocities are well below 5 mm/s, indicating that the potential for direct building damage was very small. The pos-sibility of indirect damage caused by uneven soil densification was ruled out for most complaint sites in Montréal, as the dominant soil type is silty clay which is very unlikely to settle when subjected to vibration. Finally, fatigue-induced damage was also ruled out in view of the small vibration levels meas-ured in this study.
Conclusions
Characteristics of traffic-induced building vibrations in Montréal, including transfer functions between vibrations in-side and outin-side buildings, were determined from detailed measurements and analysis at nine complaint sites. A typical transit bus and city truck were used. Existing standards were applied to evaluate human annoyance from building vibration and the potential for building damage. Also, controlled tests were performed at a selected site to evaluate the effect of road
Hunaidi and Tremblay 751
© 1997 NRC Canada
Can. J. Civ. Eng. Downloaded from www.nrcresearchpress.com by National Research Council of Canada on 08/14/13
resurfacing and seasonal variation in soil conditions on vibra-tion levels. The major findings of the study were as follows:
1. Transfer functions varied from one site to another, in some cases significantly. For rough prediction of vibration lev-els inside buildings, it was suggested that first floor vibration levels be taken equal to those on the ground close to buildings and that floor-to-floor amplification be taken as 2 times.
2. Vibration levels induced by transit buses were at least twice those induced by trucks of the same weight category. Predominant frequencies of bus-induced vibrations were be-tween 10 and 12.5 Hz, while those of truck-induced vibrations spread over a wider range.
3. Each measurement site exhibited a “cutoff frequency” below which acceleration levels were very small. The lowest observed cutoff frequency was 6.5 Hz.
4. Road resurfacing resulted in a reduction of vibration lev-els by a factor of at least 6.4. Although such a reduction factor might be sufficient to resolve vibration complaints at most sites, second-storey vibration remained slightly higher than satisfactory level for the selected site.
5. Vibration levels measured while top soil was frozen in winter were about one half those measured while the soil was not frozen.
6. The effect of the level of the ground water table on vi-bration levels was not significant.
7. Existing vibration standards for evaluation of human an-noyance were not clear when applied for bus-induced vibra-tions. Consequently, two evaluation methods were developed based on measurements made in this study.
8. Bus-induced vibrations were significantly lower than the most stringent guide value for building damage specified by existing standards. The potential of traffic vibration for build-ing damage was therefore considered very small for the con-ditions in Montréal.
The cutoff frequency phenomenon and the finding that bus-induced vibrations are mainly due to axle hop have practical significance. Possibly, vibration levels induced by buses — the main cause of vibration complaints in Montréal — could be significantly reduced by modifications to bus suspension sys-tems. Such modifications would consist of altering the axle hop frequency so that it is below the cutoff frequency of most sites in the city and (or) reducing the axle hop amplitude and the unsprung mass. Lighter urban transit buses, currently under development, offer some hope for a lighter unsprung mass.
Acknowledgments
This study was carried out on a cost-sharing basis between the City of Montréal and the Institute for Research in Construc-tion, National Research Council of Canada (IRC/NRC). The authors would like to thank Dr. G. Pernica, Messrs. L. Wang, R. Glazer, T. Hoogeveen, and A. Laberge of IRC/NRC and Mr. C. Sanfaçon of the City of Montréal for their help in field tests and data processing. The authors would also like to express their appreciation to J.H. Rainer of IRC/NRC for his many helpful comments. The cooperation of the regional Public Works Departments of the City of Montréal in arranging the tests and Société de transport de la Communauté urbaine de Montréal for providing test buses is gratefully acknowledged. Also, the cooperation of tenants and owners of buildings used in the study is greatly appreciated.
References
Al-Hunaidi, M.O. 1996. Evaluation of human response to building vibration caused by transit buses. Journal of Low Frequency Noise and Vibration, 15(1): 25–42.
Al-Hunaidi, M.O., and Guan, W. 1996. Digital frequency weighting filters for evaluation of human exposure to building vibration. Noise Control Engineering Journal, 44: 79–91.
Al-Hunaidi, M.O., and Rainer, J.H. 1990. Evaluation of measurement limits of transducer mountings in the ground. Canadian Acoustics,
18(3): 15–27.
Al-Hunaidi, M.O., and Rainer, J.H. 1991. Remedial measures for traffic-induced vibrations at a residential site. Part 1: Field tests. Canadian Acoustics, 19(1): 3–13.
Al-Hunaidi, M.O., Hofmeister, M., and Halliwell, R.E. 1992. A pro-gram for 1/3 octave analysis of traffic vibrations using digital filtering on PCs. Proceedings, Inter-Noise 92, Toronto, Ont., Vol. 2, pp. 1153–1156.
Al-Hunaidi, M.O., Rainer, J.H., and Pernica, G. 1994. Measurement and analysis of traffic-induced vibrations. Proceedings, Second International Symposium — Transport Noise and Vibration, St. Petersburg, Russia, pp. 103–108.
Al-Hunaidi, M.O., Rainer, J.H., and Tremblay, M. 1996a. Control of traffic-induced vibration in buildings using vehicle suspension systems. Soil Dynamics and Earthquake Engineering,
15: 245–254.
Al-Hunaidi, M.O., Chen, P.A., Rainer, J.H., and Tremblay, M. 1996b. Shear moduli and damping of frozen and unfrozen clay by reso-nant column tests. Canadian Geotechnical Journal, 33: 510–514. ASA. 1983. Guide to the evaluation of human exposure to vibration
in buildings. Acoustical Society of America, New York, N.Y., ANSI S3.29.
ASHE. 1978. Effect of vibration on construction. Association of Swiss Highway Engineers (VSS), Zurich, Switzerland, SN 640 312.
Ashley, C. 1978. Proposed international standards concerning vibra-tion in buildings. Instrumentavibra-tion for Ground Vibravibra-tion and Earth-quakes, Institution of Civil Engineers, London, United Kingdom, pp. 153–170.
Bata, M. 1971. Effects on buildings of vibrations caused by traffic. Building Science, 6: 21–246.
BSI. 1984. Evaluation of human exposure to vibration in buildings (1 to 80 Hz). British Standards Institution, London, United King-dom, BS 6472.
BSI. 1993. Evaluation and measurement for vibration in buildings. Part 2: Guide to damage levels from groundborne vibration. Brit-ish Standards Institution, London, United Kingdom, BS 7385. Corbeil, S., Hardy, J., and Mantha, M. 1995. Cost/benefit analysis of
lighter transit buses. Report prepared by Beauchemin-Beaton-Lapointe Inc. for Transportation Development Centre, Transport Canada, Montréal, Que., Publication No. TP 12558E.
DIN. 1984. Structural vibration in buildings. Part 3: Effects on struc-tures. Deutsches Institut fuer Normung, Berlin, Germany, DIN 4150.
Gibby, R., Dawson, R., and Sebaaly, P. 1996. Local urban transit bus impact on pavements. ASCE Journal of Transportation Engineer-ing, 122(3): 215–217.
Hanazato, T., Ugai, K., Mori, M., and Sakaguchi, R. 1991. Three-di-mensional analysis of traffic-induced ground vibrations. ASCE Journal of Geotechnical Engineering, 117(8): 1133–1151. Hill, R.C. 1980. Traffic induced vibration in buildings. Noise and
Vibration Control Worldwide, 11(5): 176–180.
Holmberg, R. 1984. Vibrations generated by traffic and building con-struction activities. Swedish Council for Building Research, Stockholm, Sweden, D15 (ISBN 91-540-4159-7).
House, M.E. 1973. Traffic-induced vibrations in buildings. The High-way Engineer, 20(2): 6–16.
Can. J. Civ. Eng. Vol. 24, 1997 752
© 1997 NRC Canada
Can. J. Civ. Eng. Downloaded from www.nrcresearchpress.com by National Research Council of Canada on 08/14/13