Determining Alpha-Smooth Muscle Actin Expression in Embryonic and Mesenchymal Stem Cells of Assorted Mammals Seeded in Collagen Scaffolds
In Vitro
By
Edward B. Jennings, III
MASSACHU.SETTS INSTIAi Or T-CHNOLOGY
AUG
1 4 2008
LIBRARIES
SUBMITTED TO THE DEPARTMENT OF MECHANICAL ENGINEERING IN PARTIAL FULFILLMENT OF THE REQUIREMENTS FOR THE DEGREE OF
BACHELOR OF SCIENCE IN ENGINEERING AT THE
MASSACHUSETTS INSTITUTE OF TECHNOLOGY
JUNE 2008
©2008 Edward B. Jennings, III. All rights reserved.
The author hereby grants to MIT permission to reproduce and to distribute publicly paper and electronic copies of this thesis document in whole or in part
in any medium now known or hereafter created.
Signature of Author: _
Department of Mecligica'Engineering May 9, 2008 Certified by:
/ Myron Spector
Senior Lecte- T Division of Health Sciences & Technology Thesis Supervisor Accepted by:_
John H. Lienhard V Professor of Mechanical Engineering Chairman, Undergraduate Thesis Committee
Determining Alpha-Smooth Muscle Actin Expression in Embryonic and Mesenchymal Stem Cells of Assorted Mammals Seeded in Collagen Scaffolds
In Vitro By
Edward B. Jennings, III
Submitted to the Department of Mechanical Engineering on May 9, 2008 in partial fulfillment of the
requirements for the Degree of Bachelor of Science in Engineering as recommended by the Department of Mechanical Engineering
ABSTRACT
Healing by contraction is responsible for scarring in adults. Embryos heal by regeneration but the mechanism is unknown. Alpha-smooth muscle actin (a-SMA) is the protein responsible for contraction, thus determining if it is present in embryos which heal by regeneration will further our knowledge about the causes of regenerative healing. This thesis experimentally determined the presence of a-SMA in these cell types by the following procedure. Embryonic and mesenchymal stem cells of various species were cultured and seeded into collagen scaffolds. Contractile behavior was determined by measuring the diameter change of the scaffolds over time. Alpha-smooth muscle actin presence was determined by immunohistochemical evaluation.
This study found that while all the cell types displayed alpha-smooth muscle actin presence in monolayer, not every cell type contracted when seeded into the collagen scaffolds designed to mimic the in vivo environment. Specifically, the embryonic stem cells did not contract. Upon staining, the embryonic stem cell seeded scaffolds and several of the mesenchymal stem cell seeded scaffolds, which did contract, did not stain positive for a-SMA. These results imply that the embryonic scaffolds did not generate actin filament bundles, and that several of the mesenchymal stem cell seeded scaffolds were imaged after a-SMA expression in them ceased.
Thesis Supervisor: Myron Spector
Acknowledgements
I would like to thank Dr. Myron Spector for the opportunity to work on this project and for his guidance throughout the semester. I would also like to thank Karen Shu who led me through every step of the project. Without her, this thesis would not be possible. I would like to thank the members of the Spector lab who assisted me with various tasks during the semester. Finally, I would like to thank my mother and father, and my friends for their continued support during my time at MIT.
Table of Contents ABSTRACT ... 2 ACKNOW LEDGEMENTS ... 3 TABLE OF CONTENTS ... 4 1. INTRODUCTION ... 6 2. BACKGROUND ... 6 2.1 ORGAN STRUCTURE... ... ... 6
2.2 ADULT WOUND HEALING... ... 6
2.3 EMBRYONIC HEALING ... 8 3. EXPERIMENTAL PROCEDURE ... ... ... 9 3.1 CELL PREPARATION... ... ... 9 3.1.1 TIME TABLE ... 9 3.1.2 THA WING ... 10 3.1.3 CELL COUNTING ... 10 3.1.4 CELL CULTURING ... 11 3.1.5 SPLITTING ... 11
3.2 SCAFFOLD AND PLATE PREPARATION ... ... 12
3.2.1 TIME TABLE ... 12 3.2.2 SL URR Y PREPARATION... 12 3.2.3 FREEZE DRYING ... 12 3.2.4 BAKING ... 13 3.2.5 PUNCHING... 13 3.2.6 PRE-WE7TING ... 13 3.2. 7 CROSS-LINKING ... 13
3.2.8 AGAROSE PLATE PREPARATION... 14
3.3 SE E D IN G ... 14
3.3.1 SCAFFOLD PREPARATION... 14
3.3.2 CELL PREPARATION AND SEEDING... 14
3.3.3 WELL-PLATES... 15
3.4 CELLS ON SCAFFOLD...16
3.5 POST-EXPERIMENT... 17
3.5.1 TISSUE PROCESSOR AND PARAFFIN EMBEDDING ... 17
3.5.2 SECTIONING ... 18
3.6 STAINING ... 18
3. 6.1 PRETREATMENT ... 18
3.6.2 STAINING... 19
3.6. 3 CO UNTERSTAINING AND MOUNTING... 19
3.7 IMAGING ... 20 4. SCAFFOLD STRAINER ... 20 5. R E SU L T S ... ... 21 5.1 CONTRACTION DATA ... ... 21 5.2 IMAGING DATA ... 25 6. DISCUSSION... 25 7. FUTURE W ORK...27 8. REFERENCES ... 28
APPEN D IX A ... ... 29
APPEN DIX B ... ... 30
1. Introduction
Determining the expression of alpha-smooth muscle actin (a-SMA) in embryonic and adult stem cells is essential for hypothesizing why an embryo heals by regeneration and an adult heals by contraction. a-SMA is a contractile protein that plays a critical role in adult wound healing. a-SMA containing cells, called myofibroblasts, migrate to the defect area and contract to cinch the wound closed. The result of this healing by contraction is a scar. Scar is dysfunctional tissue that can have adverse effects for the animal. It is known that an embryo heals through regeneration, but unknown if embryonic stem cells express a-SMA.
The goal of this project is to determine if embryonic and adult stem cells contract when placed in an environment mimicking the structure of the extracellular matrix, and if their contraction is due to a-SMA. The hypothesis is that if the embryonic stem cells do not express a-SMA their regenerative capabilities could stem from the lack of this contractile protein. On the other hand, if they do express a-SMA there could be other factors at work. The reason for examining stem cells is because all other cell types are derived from stem cells. Thus if stem cells have the capability for a-SMA, then all the cells differentiated down the line will also have the capability.
2. Background 2.1 Organ Structure
Organs are comprised of three tissue layers: epithelia, basement membrane, and stroma. The top two tissue layers, the epithelia and the basement membrane, are capable of regeneration, even in adults. Damage to the stroma, or extracellular matrix, the deepest tissue layer is non-regenerative in adults, but regenerative in embryos.
2.2 Adult Wound Healing
Figure 1: Adult wound healing process (20.441 Lecture Slides, Spector 2007)
Vram l •cwork Fra I ewrkl Sea"] -I4
The wound healing process begins with vascularization. In vascularization the wound is clotted and new blood vessels are formed. The cytokines released during vascularization then trigger an inflammatory response where macrophages phagocytose foreign tissues and tissue fragments.
If the injury results in the framework being destroyed this means that the stroma has been damaged. Since the stroma is non-regenerative, a new stroma must be
synthesized. The stroma is made of several types of randomly oriented collagen fibers. To synthesize a new stroma, long branching cells called fibroblasts migrate to the defect area and synthesize collagen fibers. A special type of fibroblast called a myofibroblast also migrates into the defect area. Myofibroblasts contain the contractile protein
alpha-smooth muscle actin. These cells contract and pinch the wound closed to speed up the recovery process. Although by doing this, myofibroblasts alter the structure of the
regenerated stroma. Instead of being randomly oriented, the collagen fibers are aligned along the plane of the wound and directed along the major contraction axis. This is referred to as healing by contraction. The resulting tissue is colloquially known as scar tissue. Scar tissue is structurally different from normal stroma tissue, and as a result is functionally inactive.
If the injury results in the framework being intact this means that the stroma is intact and that the epithelium or basement membrane has been damaged. In this case endothelium cells migrate to the wound area and undergo mitosis. The endothelium cells
also synthesize a new basement membrane. In this scenario, the wound heals by regeneration.
2.3 Embryonic Healing
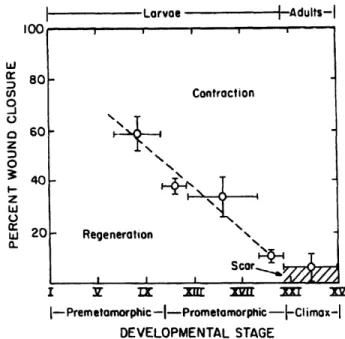
During the fetal-to-adult transition in nearly all animals, the ability to regenerate
degrades, while contraction becomes the Larvae A-d ults-I
major mode of wound closure. Figure 2
shows the transition during a frog's L 8o
uC Contraction
development. The mechanism for fetal
3
regeneration and why it does not o60-
-continue into adult hood are unknown. o
It was shown that an adult skin wound z
healed in a fetal environment still healed W 20- Regeneration
\-by scar formation (Longaker et al). Scor...
Thus, the hypothesis that the I Y IX 3i 3~n 3rr x
I--Premetamorphic -I-Prometamorphic -IClimax-I
regenerative ability is inherent in the DEVELOPMENTAL STAGE embryonic in vivo environment was
Figure 2: Developmental Wound Healing proven false. Other studies have
(20.441 Lecture Slide, Yannas 2007)
examined the role that platelet-derived growth factors, such as, TGFbetal play
in the wound healing process. TGFbetal is a known promoter of myofibroblast activity. One study showed that wounds that healed via regeneration had low levels of TGFbetal hypothesizing that the key to regeneration is the impediment of myofibroblast, and thus alpha-smooth muscle actin, activity (O'Kane et al). The aim of this thesis is to discover if embryonic stem cells contain alpha-smooth muscle actin. As previously stated, this protein is responsible for the contraction of myofibroblasts. If embryonic stem cells do not contain this protein it would shed some light on why they do not heal by contraction. If not, it means that there are other forces at work.
3. Experimental Procedure 3.1 Cell Preparation
The following mesenchymal stem cell lines were used in this experiment: pig #1, goat #138, goat #139, goat #140, goat #171, goat #182, goat #316, rat #1, rat #2, rat #3, rat #4, rat #5, rat #6, and rat #7. The following embryonic stem cell lines were used: mouse #1. All cell lines were stored in liquid nitrogen before the experiment. In order to be used for the experiment the cells had to be thawed, cultured, and split until 80% confluency was attained. The following sections will outline the procedures used. 3.1.1 Time Table
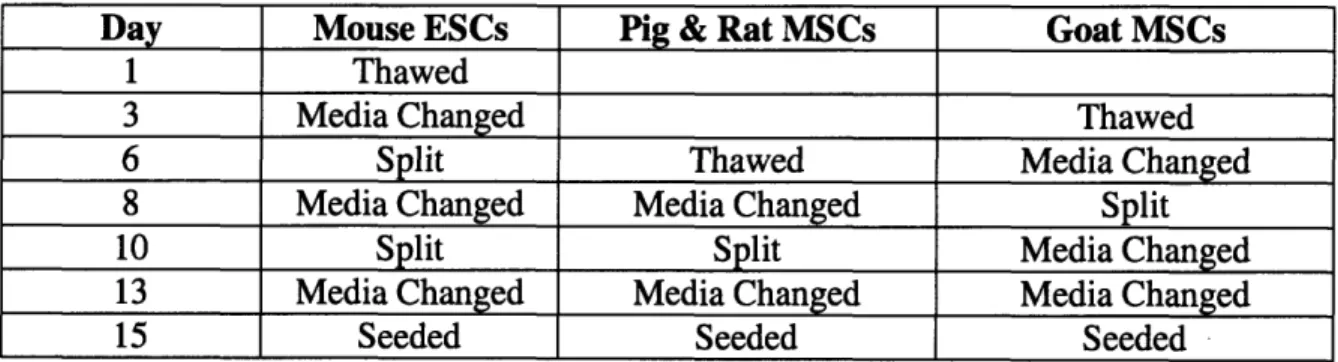
The cell preparation time table is described below in table 1. Table 1: Cell Preparation Time Table
Day Mouse ESCs Pig & Rat MSCs Goat MSCs
1 Thawed
3 Media Changed Thawed
6 Split Thawed Media Changed
8 Media Changed Media Changed Split
10 Split Split Media Changed
13 Media Changed Media Changed Media Changed
15 Seeded Seeded Seeded
The growth of the cell types is described below in table 2. Table 2: Cell Growth Time Table
Day Mouse ESCs Pig & Rat MSCs Goat MSCs
1 250,000 cells in T-150
3 250,000 cells in T-150
6 250,000 cells in T-150 250,000 cells in T-150
8 75,000 cells in 3 layers
10 2 T-150s of 250,000 10e6 cells
For in-depth cell counts and the cell suspension volumes used Appendix B.
3.1.2 Thawing
The vials were taken out of liquid nitrogen and placed into a 370C water bath for 40-60 seconds. The defrosted vials were moved into a sterile hood where a drop of expansion media was added to the vial. For the expansion media recipes please refer to Appendix A. After one minute, further expansion media was added on a droplet basis until the vial was full. The solution was then transferred to a 50mL tube, which was spun in the centrifuge for 10 minutes at 1500 RPM and 20'C to obtain a cell pellet. The media was aspirated and the cells were resuspended in 10 mL of expansion media and then counted by the procedure described in section 3.1.3.
3.1.3 Cell Counting
The cells were suspended in 10 mL of expansion media. 100 ýtL of the cell suspension was collected and diluted with trypan blue with a dilution ratio of 1:2. 15 gL of the diluted sample was mixed and collected in a micropipette tip. The diluted sample was loaded into the sterile hemocytometer. The hemocytometer was placed under a light microscope with the yellow glass filter removed and viewed with the 10x objective lens. Living cells in sections 1,2,3,4, and 5 of the hemocytometer grid, which is depicted in figure 3, were counted.
Figure 3: Hemocytometer Grid
1mm
The total cell number was calculated using equa
T = Nc x Dx104 X Ns
I 1mm
tion 1.
V
(1)
NINON IIII
III
IIII
IIII
III
MEMO
SOMME IIII
III
IIII
IIII
III
Mi INN IIII
III
IIII
IIII
III
MFV1AN
SWINE IIII
III
11111111111
INMAN
I
SENN IN
NONE [III
11111111111111
III
IIII
IIII
III
EMEN
MEN
EI1rUE
111111111111111111
MF-"ME
INFAI no 1111111 IN IIII III EXIIIIIIIIIIIIII mams IIII 11111111111111 whiýmmo 0 MEME I MM I M V = M 1 V M M W W 0 1: ý
N, = # of cells counted, N, = # of squares counted, D = Dilution factor, V = Volume of media
Using the result from equation 1 and the volume of the cell suspension, the amount of media required to harvest a certain number of cells was ascertained.
3.1.4 Cell Culturing
The number of cells required was placed into a T-150 flask. The flask was then filled with expansion media until the total volume in the flask was 30 mL. The flasks were then placed into an incubator at 370C and 5.0% CO2. On Mondays, Wednesdays,
and Fridays the media was changed. The media was removed by glass vacuum pipettes. A new pipette was used for each sample from different animals. The flasks were then refilled with 30 mL of fresh media and placed into the incubator.
3.1.5 Splitting
The medium in the flasks was aspirated with a vacuum pipette. The flasks were rinsed with PBS until the bottom of the flask was covered. A Collagenase Type 2 solution was made by placing 75 mg of Collagenase Type 2 into a 50 mL tube and filling the tube with PBS. The Collagenase solution was sterilized by using a vacuum powered 0.22 ýtm sterile filter. The PBS in the flask was aspirated and 8 mL of the Collagenase solution was added. The flask was then placed into the incubator for 5 minutes. The Collagenase solution was aspirated and placed into a 50 mL tube and 8 mL of trypsin was added to the flask. The flask was again placed into the incubator for 5 minutes. The flask was then placed under a light microscope to verify that the cells were no longer adhering to the flask. 8 mL of expansion media was added to the flask to inactive the trypsin. Using a sterile pipette the complete solution in the flask was transferred into the 50 mL tube containing the Collagenase. The 50 mL tube was centrifuged at 1500 RPM and 20 'C to obtain a cell pellet. The media in the tube was aspirated and the cells were resuspended and counted. After, the cells were centrifuged again and resuspended at the desired seeding density. The cell solution was then transferred to culture flasks and expansion media was added to bring the flasks up to final volume.
3.2 Scaffold and Plate Preparation
The collagen III scaffolds were prepared concurrently with the cells to allow immediate seeding once both procedures were complete. The following sections will outline the steps done to prepare the scaffolds and the agarose coated well-plates. 3.2.1 Time Table
The scaffold preparation time table is described below in table 3. Table 3: Scaffold Preparation Time Table
Day Procedures
1 Slurry Prepared, Freeze Dried
3 Baked Molds
6 Punched Scaffolds
10 Prewet Scaffolds
13 Agarose Plates Made
15 Crosslinked and Seeded
3.2.2 Slurry Preparation
200 mL HCl solution at 0.001N was prepared in the following way. 50 tL of 6N
HCl was added to 3 mL of dH20 to make 0.1N HC1. 2 mL of 0.1N HCI was added to
198 mL dH20 to make 200mL of 0.001N HC1. The solution was then placed upon a
magnetic stirrer and 6N HCI was added on a droplet basis until the pH of the solution was 3. 1 g of Biogide collagen powder was added to the stirring solution. To keep the pH at 3, 100 pgL of 6N HCI was added. This solution was then blended at 4 'C and 15,000 rpm for 90 minutes. To keep the pH at 3, 50 gLL of 6N HCl was added. The solution was then blended again in the same way as before. The solution was split between four 50 mL tubes, which were then centrifuged at 1500 rpm for 20 minutes. The solution was then poured in 16 mL plastic molds and the bubbles were removed with a spatula. The molds were then ready for freeze drying.
3.2.3 Freeze Drying
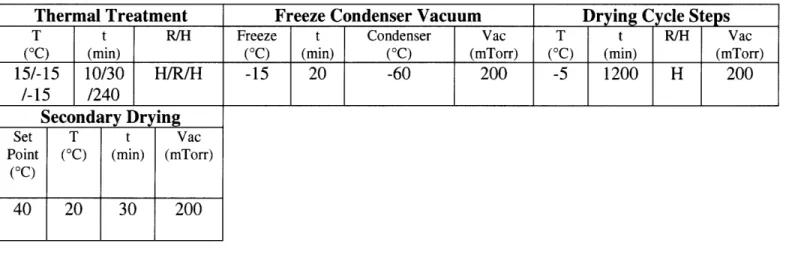
In order to achieve 120 gtm pores, the molds were placed in a freeze drying machine with the settings described in table 4.
Table 4: Freeze Drying Cycle Thermal Treatment T t R/H (oC) (min) 15/-15 10/30 H/R/H /-15 /240 Secondary Drying Set T t Vac
Point (°C) (min) (mTorr)
(0C)
40 20 30 200
Freeze Condenser Vacuum Drying Cycle Steps
Freeze t Condenser Vac T t R/H Vac
(oC) (min) (oC) (mTorr) (oC) (min) (mTorr)
-15 20 -60 200 -5 1200 H 200
3.2.4 Baking
The molds were taken out of the freeze drier and baked at 110 oC for 24 hours.
3.2.5 Punching
Using an 8 mm punch, 169 scaffolds were punched out of the molds.
3.2.6 Pre-wetting
The 8 mm scaffolds were placed in 100% reagent alcohol at a volume of 4-5 mL per scaffold. This solution was placed on the rocker for one day. The scaffolds were then placed in 80% reagent alcohol for 30 minutes on the rocker, and then in 50% reagent alcohol for 30 minutes on the rocker. Afterwards, they were rinsed twice in sterile water. The scaffolds were left in sterile water for 5 days until all the air was removed, which was signified by the fact that the scaffolds were no longer floating in solution.
3.2.7 Cross-linking Collagen-GAG Scaffolds by Carbodiimide Treatment
For 169 scaffolds and a 1:1:5 (EDAC:NHS:COOH) ratio the EDAC and NHS amounts were calculated by equations 2 and 3 respectively.
#Scaffoldsx g collagen mol COOH mol EDAC g EDAC scaffold g collagen mol COOH mol EDAC #Scaffoldsx g collagen mol COOH # Scaffoldscaffold xmolx g collagenx mol NHS g NHS
=COOH mol NNHS
scaffold g collagen mol COOH mol NHS
(2)
The calculated amounts were 0.0156 g EDAC and 0.0094 g NHS. These amounts were dissolved in 169 mL of dH20, which was calculated by the rule of 1 mL of dH20 per
scaffold. This solution was then placed through a sterile filter. The pre-wet scaffolds were then placed into the filtered EDAC/NHS solution for 30 minutes at room
temperature. After 30 minutes, the scaffolds were transferred to 50 mL tubes. The scaffolds were then rinsed twice in PBS and placed on the rocker for 1 hour. After 1 hour, the PBS was removed and the scaffolds were rinsed twice with dH20. The
scaffolds were then stored in dH20 at 40c.
3.2.8 Agarose Plate Preparation
4 g of Seaplaque agarose was added to a flask of 100 mL of dH20. The opening
of the flask was covered with aluminum foil and the flask was placed on a magnetic stirrer. The flask was then autoclaved (water added to autoclave bin) on the setting for Liquid #2. After the autoclave cycle, the door was opened and the solution was allowed to cool to 50-60 'C. Under the sterile hood, the 24-well plates were coated with 1.5 mL of liquid agarose solution per well. The well-plates were then placed in sterile bags and put in the cold room overnight.
3.3 Seeding
The following sections outline the steps done to seed the cells on the scaffolds and place them in the agarose coated well-plates. All the steps were done on day 15.
3.3.1 Scaffold Preparation
One scaffold was placed in each agarose coated well. Care was taken to make sure the scaffolds were completely flat and that the scaffold was not contorted in the well. The excess moisture in the well, brought by the wet scaffolds, was wicked away with filter paper.
3.3.2 Cell Preparation and Seeding
One million cells were to be seeded on each side of a scaffold for a total of two million cells per scaffold. To ensure the best chance of absorption by the scaffold, the
volume of 1 million cells was limited to 20 tiL. Since there were 9 scaffolds per sample, 18 million cells in 360 ptL was required for each sample. For a safety buffer we used 20 million cells in 400 1tL.
The total number of cells in each sample was determined by the cell counting procedure mentioned in section 3.1.3. Please refer to Appendix B for cell counts and cell suspension volumes. A volume containing 20 million cells was placed in a 15 mL tube. This tube was then centrifuged at 1500 rpm for 10 minutes to obtain a cell pellet. The media from the tube was aspirated and the pellet was resuspended in 400 ýIL of expansion media. From this solution, 20 giL was micropipetted and placed on one side of the
scaffold. After 10 minutes, the scaffold was turned over and another 20 tL was added to the other side. After 10 minutes, 1 mL of media was added. This was done for every sample and scaffold.
Unfortunately, we did not obtain 20 million cells from any rat sample. We decided to seed one scaffold for rat #2 and rat #7, and four scaffolds for rat #4. Please refer to Appendix B for exact cell counts.
3.3.3 Well-Plates
The final assembly of the well plates is as follows. Well-plate #1 contained: 6 samples of goat #171, goat #140, goat #139, and goat #138. Well-plate #2 contained: 6 samples of goat #316 and goat #182, and one sample of rat #2 and rat #7. Well-plate #3 contained: 3 samples of goat #138, goat #139, goat #140, goat #171, goat #182, goat #316, pig #1, and mouse #1 grown in myogenic media. Well-plate #4 contained: 4
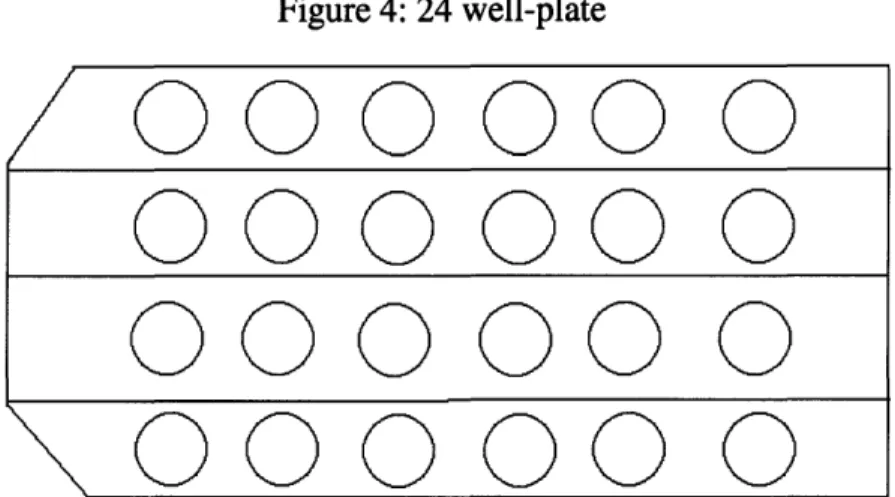
samples of rat #4, 6 samples of pig #1 and mouse #1, and 6 control samples which were non cell seeded scaffolds placed in the different types of media. The controls were as follows: goat/pig expansion media, rat expansion media, mouse expansion media, no media, goat/pig myogenic media, and mouse myogenic media. For a graphical depiction of a well-plate please refer to figure 4.
Figure 4: 24 well-plate
/000000
000000
000000
000000
3.4 Cells on ScaffoldThe cells were to remain on the scaffolds for two weeks. On days 15, 17, 20, 22, 24, 27, and 29 the media was changed and the scaffold contraction was measured. The scaffold contraction was defined as the change in the diameter of the scaffold. To
measure the scaffold diameter, the wells containing the scaffolds were placed over a sheet of paper with circles of various diameters printed on it. The scaffolds in the wells were lined up with the circle that was the closest to the diameter of the scaffold and that was defined as the diameter of scaffold. If the scaffold was oval shaped, the circles that were closest to the width and height of the scaffold were written down. The effective diameter was then calculated by equation 6, requiring the results of equations 4 and 5 as inputs.
(In.a.b) (4) 4 1 P = 2.7.[ a2+ b2)] 2 (5)
(1.55Q
-
625)
D .2 (6)P2
a = width diameter, b = height diameter
The contraction data is presented in Appendix C, and the graphical representation of the contraction data is presented in the results section.
3.5 Post-Experiment
The goal of the post-experiment methods was to determine if the macroscopically observed contraction was due to the presence of alpha-smooth muscle actin. To
determine the presence of a-SMA, the scaffolds would be sectioned and stained with a dye that would turn red in the presence of a-SMA. The stained sections would then be imaged under a microscope.
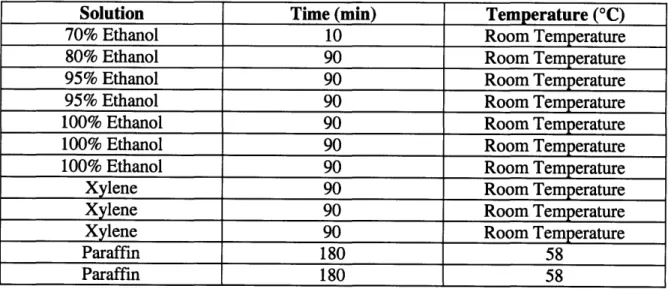
3.5.1 Tissue Processor and Paraffin Embedding
On day 29, exactly two weeks after beginning the scaffold measurements, the scaffolds were ready to be placed in the tissue processor to be embedded in paraffin. To prepare the scaffolds for the tissue processor the scaffolds had to be placed in
paraformaldehyde to kill the cells and effectively "freeze" the cells in the scaffold. The media from all the wells was aspirated and replaced with DBS. The scaffolds were taken out of the well-plates and put into individual tubes containing 4% paraformaldehyde for three hours. After three hours, the scaffolds were taken out of the paraformaldehyde solution and placed in individual cassettes. The cassettes were loaded into the tissue processor for 19 hours to embed the scaffolds in paraffin. The cycle for the tissue processor is described below in table 5.
Table 5: Tissue Processor Cycle
Solution Time (min) Temperature (°C)
70% Ethanol 10 Room Temperature
80% Ethanol 90 Room Temperature
95% Ethanol 90 Room Temperature
95% Ethanol 90 Room Temperature
100% Ethanol 90 Room Temperature
100% Ethanol 90 Room Temperature
100% Ethanol 90 Room Temperature
Xylene 90 Room Temperature
Xylene 90 Room Temperature
Xylene 90 Room Temperature
Paraffin 180 58
On day 31, the scaffolds were removed from the cassettes. The scaffolds were placed on the bottom of a mold and paraffin was dispensed into the mold. The cassette was then placed on top and more paraffin was dispensed. The scaffolds were placed on the bottom to minimize the amount of paraffin that would have to be shaved off before sections could be taken. The cassettes being molded to the paraffin allowed fixation to the microtome. The molds were then placed on a cooling surface for 45 minutes before being placed into a freezer.
3.5.2 Sectioning
In order to section a sample, the sample was taken out of the freezer and removed from the mold. The jaws of the microtome were tightened onto the cassette part of the sample to provide fixation. In order to create the 6 gLm samples necessary for staining, the microtome was set to advance 6 gtm on each rotation. Four to six slides were created per sample with 3 to 4 sections on each slide. The slides were placed on the slide warmer for 30 minutes before being stored away. The following samples had sections created on days 34 and 36: goat #138-1, goat #139-1, goat #140-1, goat #171-2, goat #182-1, goat #316-1, pig #1-1, mouse #1-1, rat #2-1, rat #4-1, and rat #7-1. In addition to provide positive and negative controls for the stains, goat aorta was also sectioned.
3.6 Staining
The staining process consisted of pretreatment, staining, and counterstaining and mounting. All of the aforementioned steps took place on day 41.
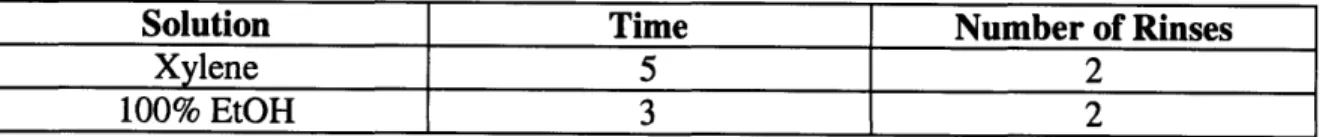
3.6.1 Pretreatment
The slides were deparaffinized and rehydrated by being subjected to the following treatment described below in table 6.
Table 6: Pretreatment Procedure
Solution Time Number of Rinses
Xylene 5 2
95% EtOH 2 2
80% EtOH 1 1
TBS 2 2
3.6.2 Staining
The slides were loaded onto the cover plates and placed into the DAKO Autostainer. As previously mentioned, goat aorta provided the positive and negative controls for the stain. The autostainer performed the following steps described in table 7 to stain the slides for a-SMA.
Table 7: DAKO Autostainer steps
Steps
Rinse (TBS + Tween) Add 0.1% Protease - 45 min
Rinse (TBS + Tween)
End. Enzyme Block: H202 - Peroxidase blocking solution - 10 min
Rinse (TBS + Tween)
Pretreatment Serum Block with 5% goat serum - 30 min NO RINSE
Anti-Alpha SMA (Primary antibody or negative mouse control) - 30 min Rinse (TBS + Tween)
Second. Reagent: Biotin Conjugate - 15 min Rinse (TBS + Tween)
Tertiary Reagent: Extravidin-Peroxidase - 15 min Rinse (TBS + Tween)
Switch
Substrate: AEC 10 - 10 min
3.6.3 Counterstaining and Mounting
After the DAKO autostainer completed its program, the slides were removed and placed into TBS. The slides were then counterstained with Mayers Hematoxylin for 1.5 minutes. Afterwards, the slides were placed under running tap water for 3 minutes. The slides were then coverslipped with Faramount aqueous mounting media. The
3.7 Imaging
The coverslipped slides were placed under a light microscope connected to a computer. The slides were viewed under the 10x and 40x objective lens and images were captured using computer software.
4. Scaffold Strainer
The draining of the fluid from the 50 mL tubes to rinse the scaffolds in the cross-linking procedure outlined in section 3.2.7, was accomplished by tipping the tube and using tweezers to prevent the scaffolds from sliding out. This process was not only time consuming but arduous as the scaffolds would perpetually slide past the tweezers and into the beaker below. Thus, I designed a scaffold strainer that could be placed into the tube. The scaffold strainer is pictured below in figure 5.
Figure 5: Scaffold Strainer
The outer diameter of the hollow cylinder is 27.94 mm so it will fit snugly into the inner diameter of the 50 mL tube. The strainer holes are 1 mm to prevent the scaffolds from slipping through them, since the scaffolds are 8 mm in diameter. The depth of the hollow cylinder is only 4 mm so as to not go deep enough into the tube to come in contact with the scaffolds resting on the sides of the tubes during insertion of the strainer. The two flaps are greater than the outer diameter of the tube to allow the user to hold the strainer in place with two fingers.
The other design being considered was a screw on strainer. This design was scraped as it would have been more time consuming to screw the cap on and off since there were several tubes to do and several rinses per tube.
5. Results
In order to determine if contraction occurred and if the contraction was due to a-SMA, the pertinent results from the experiment are the scaffold diameters and the images obtained from the stain.
5.1 Contraction Data
The scaffold diameters were measured by the procedure outlined in section 3.4. The cells in myogenic media will not be considered, since they were being cultured for a
separate experiment. Figure 6 displays the scaffold diameters versus time, excluding day 15 when all scaffolds were assumed to be 8 mm. Each data point represents an average diameter for the samples of that animal.
Figure 6: Mean Scaffold Diameter (mm) vs. Time (day)
9 8 7 6 E 5 E 4 2 C -- Mouse --U-- Goat 138 Goat 139 Goat 140 -- Goat 171 --- Goat 182 -+- Goat 316 - Pig - Rat4 --- Rat 2 -- Rat 7
Although not displayed for clarity's sake, it should be noted that the diameters of every control sample remained constant.
The time constants for the data sets displayed above were determined by fitting a
4th degree polynomial curve to the data using matlab. The time constant was defined by
the time taken for the curve to reach 63% of its final value. The time constants are presented below in table 8.
Table 8: Time Constants
Cell Type Time Constant (Days)
Mouse N/A Goat 138 2.025 Goat 139 2.502 Goat 140 2.485 Goat 171 2.11 Goat 182 2.28 Goat 316 2.212 Pig 2.383 Rat 2 3.287 Rat 4 3.389 Rat 7 3.389
Since the goats and rats differed in their average time constant, it was necessary to determine if the animal type was a statistically significant factor on the time constant. The null hypothesis was that there would be no effect of animal type on the time
constant. To test the null hypothesis, an unpaired t-test was run to compare the two population means. The results are below in table 9.
Table 9: Unpaired t-test: Scaffold Diameter with Goat and Rat Animal Types as Factors Mean Off. CF t-Value P-Value
Goat, Fbt -1.086 7 -9.177 ý0001
As can be seen in the unpaired t-test analysis above, the animal type was a statistically significant factor on the time constant. This is because the P-value is much smaller than the 5% significance level.
To determine how the cell type and the day affected the scaffold diameter, and how the interaction of cell type and day affected the scaffold diameter a two-way analysis of variance (ANOVA) test was run using StatView software.
For our two-way ANOVA there were several null hypotheses being tested at the same time. Null hypothesis 1: there is no difference in scaffold diameter between day 17, day 20, day 22, day 24, day 27, and day 29. Null hypothesis 2: there is no difference in scaffold diameter between any of the cell types. Null hypothesis 3: there is no interaction between cell type and day. The significance level for a, the probability of rejecting the null hypothesis when the null hypothesis is actually true, was chosen to be 5%. Thus, any P-value smaller than a is said to be statistically significant.
The ANOVA test had an 8 x 6 between-subjects design, meaning that there were 8 animals tested and 6 samples per animal. This between-subjects design was necessary, because a singularity would occur if the number of samples was not constant among the animals considered. Thus, the animals considered for statistical analysis were: Mouse, Goat #138, Goat #139, Goat #140, Goat #171, Goat #182, Goat #316, and Pig. The ANOVA results are presented below in table 10.
Table 10: ANOVA for Goats, Pig, Mouse
ANIMA Table for Inameter Fbw exclusion: edkarenscaffold.svd
CF Surnof Squares Mhan Square F-Value P-Value Larrbda Fb~er
Cell Type 7 693.133 99.019 676.966 <0001 4738.764 1.000 Day 5 253.753 50.751 346.969 <0001 1734.845 1.000 Cel Type * Day 35 79.412 2.269 15.512 <0001 542.917 1.000
Feskiual 240 35.104 .146
As can be seen in the ANOVA analysis above, the cell type, diameter, and cell type by day interaction are all statistically significant. Meaning that there were real effects on diameter based on the cell type in the scaffold, the day the measurement was taken, and the interaction between cell type and day.
Since there were more than two categories for day and cell type, a Fisher's PLSD is necessary to determine where the differences lie. The Fisher's PLSD tables for cell type and day are presented below in tables 11 and 12 respectively.
Table 11: Fisher's PLSD effect Cell Type Fisher's PLSDfor Clameter
Bfect: Cell Type Significance Level: 5 %
Fbw edcluslon: edkarensceffold.svd
Wan Off. Qit. Off. RValue 4.946 .178 <0001 4.386 .178 <.0001 4.577 .178 <.0001 5.130 .178 <0001 4.599 .178 <0001 4.429 .178 <.0001 3.751 .178 <.0001 -.559 .178 <0001 -.369 .178 <.0001 .184 .178 .0422 -.347 .178 .0002 -.517 .178 <.0001 -1.194 .178 <.0001 .190 .178 .0359 .744 .178 <.0001 .212 .178 .0194 .043 .178 .6347 -.635 .178 <.0001 .553 .178 <0001 .(22 .178 .8073 -.147 .178 .1035 -. 825 .178 <0001 -.531 .178 <.0001 -.701 .178 <.0001 -1.379 .178 <0001 -.169 .178 .0615 -.847 .178 <.0001 -.678 .178 <.0001
Table 12: Fisher's PLSD effect Day
Rsher's PLSDfor Dameter Bfect: Day
Significance Level: 5%
Fbw exclusion: edkarenscaffold.svd
Mean Off. Oit. lff. P-Value 1.439 2.125 2.490 2.601 2.658 .686 1.051 1.162 1.219 .366 .476 .533 .111 .167 .067 .154 .154 .154 .154 .154 .154 .154 .154 .154 .154 .154 .154 .154 .154 .154 <.0001 <.0001 <.0001 <.0001 <.0001 <.0001 <.0001 <.0001 <.0001 <.0001 <.0001 <.0001 .1571 .0331 .4699
Due to the difference in time constants between goats and rats, it was necessary to run an
ANOVA to determine the effect of cell type and day on diameter. This ANOVA analysis
is different than the one conducted above since the cell type is now confined to the
animal groups of rat and goat. These animal groups will not be considered on an
individual sample basis, but on a species basis. Meaning that all goat samples are
collapsed into a category and all rat samples are collapsed into a category. The ANOVA is given below in table 13.
Table 13: ANOVA for Goats and Rats
1F Smrno Squares Maen Square F-Value PValue Lantcla Fbwer 1 .015 .015 .045 .8315 .045 .055 5 67.220 13.444 40.141 <.0001 200.706 1.000 5 24.062 4.812 14.369 <.0001 71.845 1.000 240 80.380 .335 Mvuse, G138 MIuse, G139 rVtse, G140 MIuse, G171 Mouse, G182 Itxse, G316 Mnse, Rg G138, G139 G138, G140 G138, G171 G138, G182 G138, G316 G138, Rg G139, G140 G139, G171 G139, G182 G139, G316 G139, Rg G140, G171 G140, G182 G140, G316 G140, FRg G171, G182 G171, G316 G171, Rg 0182, G316 G182, Rg G316, Fig Aninal
GraW
Arsiral *5.2 Imaging data
The images from the stains were obtained by the procedure outlined in section 3.7. The positive control stained for SMA, and the negative control did not stain for SMA, indicating the stain was valid. No negative stains from any samples stained for a-SMA. The results from the positive stains are listed below in table 14.
Table 14: Results of Stain
Cell Type Positive Stain
Mouse No Goat 138 No Goat 139 No Goat 140 No Goat 171 Yes Goat 182 Yes Goat 316 No Pig Yes Rat 2 No Rat 4 Yes Rat 7 Yes
In an experiment run concurrently, 10,000 cells from the samples used in this experiment were placed in monolayer and stained for a-SMA after 1 day. The results from this immunohistochemical evaluation were that all positive stains stained positive for a-SMA.
6. Discussion
As previously mentioned, the results from the concurrent experiment run in monolayer reveal that all the cell types stained positive for a-SMA This signifies that all the cell types used in this experiment have the capability to express a-SMA. Taking this observation and applying it to the results we obtained from the experiment discussed in this paper raises some interesting questions. Firstly, if all the cell types can express a-SMA why did the mouse embryonic stem cell seeded scaffold not contract? Secondly, why did several goat and rat mesenchymal stem cell seeded scaffolds that contracted not
stain positive for a-SMA? The answers to these two questions will be discussed in detail below.
The mouse seeded scaffold was the only scaffold in the experiment to not display contraction. The mouse seeded scaffold was the only embryonic stem cell seeded
scaffold in the experiment. In a recent paper it was determined that the initiation of actin polymerization in muscle cells requires a strong filament nucleator (Chereau et al). Specifically, the protein leiomodin was identified as a strong filament nucleator. It is plausible that the mouse embryonic stem cells had not yet expressed a protein to act as an actin filament nucleator, and thus were not able to construct actin filament bundles. Without these actin filament bundles, it would be impossible for the cells to contract.
Every cell seeded scaffold contracted except for the mouse, but only Goat #171, Goat #182, Pig, Rat #4, and Rat #7 stained positive for a-SMA. A plausible explanation for this observation is that by the time the samples were ready to be embedded in paraffin the a-SMA expression was finished in the scaffolds that did not stain. The samples were embedded two weeks after being seeded with cells. After two weeks, it is plausible that the maximum amount of contraction possible was achieved. No longer being able to contract the already collapsed pores, the cells were no longer provided with the
mechanical stimulus needed to continue expressing a-SMA. Additionally, the cells could pool in the collapsed pores and compete for nutrients. Not being able to obtain the nutrients they needed the cells expressing a-SMA could have died. Although, DNA content tests were not run so it is impossible to determine the amount of cells present at any given time. The data reinforces the idea that the maximum contraction was achieved. From figure 6, we see that the in the last three days the contraction versus time begins to plateau. The fisher's PLSD for the effect of day on diameter in goat, pig, and mouse confirms this. Between days 4 and 5, and 5 and 6 the null hypothesis holds. Meaning that the there is no statistically significant effect of day on the diameter for those days. The fisher's PLSD for the goat and rat animal types confirms this as well. Between days: 3 and 4, 4 and 5, and 5 and 6, the null hypothesis holds. The fact that some stained for
a-SMA speaks to the amount of variability in the experiment. The size of the pores, the amount of cells, the exact amount of media supplied, the samples themselves, are all variables that are impossible to keep constant, and the fact that some scaffolds that
contracted stained positive for a-SMA can be attributed to differences in such variables between the samples.
On a side note, the images obtained show the stained region was limited to the periphery of the scaffold section. While the reason for this behavior is unknown, it has been documented in other research and thus reinforces the validity of our results (Vickers et al).
In regards to the time constants, from table 8 it is clearly visible that the goats and rats display different average time constants. From the unpaired t-test we find that there the variation of the time constant with regards to animal type is statistically significant. From this fact we would expect that the effect of animal type, in this case being goat and pig, would be statistically significant on scaffold diameter. Unexpectedly, we find from the ANOVA that the null hypothesis holds for the effect of animal type on diameter. Meaning that there is no statistically significant difference for the effect of goat or rat on scaffold diameter.
7. Future Work
The results of the stain run in this experiment are for one sample of the animals mentioned. To gain a fuller understanding, it would be necessary to section and stain all samples.
In future experiments it would be necessary to test the DNA content of the scaffolds at various instances in time. This would allow us to determine the number of cells present at any given moment. With this knowledge we could test the hypothesis that there are fewer cells as time progresses due cell death caused by pooling. It would also be necessary to run stains at different points in time. This would allow us to determine if alpha-smooth muscle actin expression took place at any time during the experiment not just at the end of the experiment.
8. References
B. Kinner, J. M. Zaleskas, M. Spector. "Regulation of Smooth Muscle Actin
Expression and Contraction in Adult Human Mesenchymal Stem Cells." Experimental Cell Research 278:1 (2002): 72-83.
Chereau, David et al. "Leiomodin Is an Actin Filament Nucleator in Muscle." Science 320 (2008): 239
Desmoulibre, Alexis, Christine Chaponnier, and Giulio Gabbiani. "Tissue Repair, Contraction, and the Myofibroblast." Wound Repair and Regeneration 13 (2005): 7-12. Longaker, M et al. "Adult skin wounds in the fetal environment heal with scar
formation." Ann Surg 219:1 (1994): 65-72
O'kane, Sharon, and Mark W. Ferguson. "Scar-Free Healing: From Embryonic
Mechanisms to Adult Therapeutic Intervention." Philos Trans R Soc Lond B Biol Sci 359 (2004): 839-850.
Redd, Michael J., Lisa Cooper, Will Wood, Brian Stramer, and Paul Martin. "Wound Healing and Inflammation: Embryos Reveal the Way to Perfect Repair." Philos Trans R Soc Lond B Biol Sci 359 (2004): 777-784.
"Unpaired T-Tests." Mathematics Learning Support Centre. <http://mlsc.lboro.ac.uk/resources/statistics/Unpairedttest.pdf>.
"Using StatView: Analysis of Variance (ANOVA) and Multiple Comparisons." Bowdoin College. <http://academic.bowdoin.edu/courses/f04/bio 105/pdf/statviewanova.pdf>. Vickers SM, Johnson LL, Zou LQ, Yannas IV, Gibson LJ, and Spector M. "Expression of a-smooth muscle actin in and contraction of cells derived from synovium." Tiss. Engr.
10 (2004): 1214-1223.
Weaver, Alix, Scott Vickers, Karen Shu, and Catherine Bolliet. Spector Lab Protocols. Yannas, I.V. Tissue and Organ Regeneration in Adults, Springer-Verlag New
Appendix A: Expansion Media Recipes Mouse ESC Media: alpha-MEM, 445 mL 37.5 mL 12.5 mL 5.0 mL
7.5% Newborn calf serum, 2.5% Fetal calf serum (FBS), 1% P/S alpha-MEM
Newborn calf serum Fetal calf serum (FBS) Pen/Strep
Pig & Goat MSC
Media: LG-DMEM, 10% FBS, 1% P/S, 10ng/mL bFGF*
450 mL LG-DMEM
45 mL FBS
5 mL Pen/Strep
*Add 1 tL of bFGF per 1 mL of media using 0.22 gtm sterile filter Rat MSC
Media: LG-DMEM, 20% FBS, 1% antibiotic/antimycotic, 10ng/mL bFGF*
412.5 mL LG-DMEM
82.5 mL FBS
5 mL Antibiotic/Antimycotic
Appendix B: Cell Counts and Cell Suspension Volumes Mouse ESC
Day 1: 1.1e6 cells counted. 2.27 mL required for 250,000 cells. Day 6: 100.4e6 cells counted. 50 gL required for 250,000 cells. Day 15: 130.4e6 cells counted. 3.07 mL required for 20e6 cells.
Pig #1
Day 15: 36.4e6 cells counted. 5.49 mL required for 20e6 cells.
Goat MSC #138
Day 3: 1.16e6 cells counted. 2.15 mL required for 250,000 cells Day 8: 12.8e6 cells counted. 60 gtL required for 75,000 cells. Day 15: 45.2e6 cells counted. 4.42 mL required for 20e6 cells.
Goat MSC #139
Day 3: 720,000 cells counted. 3.47 mL required for 250,000 cells Day 8: 11.3e6 cells counted. 66 pL required for 75,000 cells. Day 15: 43e6 cells counted. 4.65 mL required for 2e6 cells.
Goat MSC #140
Day 3: 600,000 cells counted. 4.20 mL required for 250,000 cells Day 8: 10e6 cells counted. 75 gL required for 75,000 cells. Day 15: 29.8e6 cells counted. 6.71 mL required for 20e6 cells.
Goat MSC #171
Day 3: 820,000 cells counted. 3.05 mL required for 250,000 cells. Day 8: 8.8e6 cells counted. 85 gL required for 75,000 cells. Day 15: 24.4e6 cells counted. 8.20 mL required for 20e6 cells.
Goat MSC #182
Day 3: 560,000 cells counted. 4.46 mL required for 250,000 cells. Day 8: 1 1e6 cells counted. 68 gL required for 75,000 cells. Day 15: 26.25e6 cells counted. 11.4 mL required for 20e6 cells.
Goat MSC #316
Day 3: 800,000 cells counted. 3.125 mL required for 250,000 cells. Day 8: 13.3e6 cells counted. 56 [tL required for 75,000 cells. Day 15: 39e6 cells counted. 5.12 mL required for 20e6 cells.
Rat #1
Day 15: 2.12e6 cells counted.
Rat #2
Day 15: 2.32e6 cells counted. 8.62 mL required for 2e6 cells.
Rat #3
Day 15: 550,000 cells counted.
Rat #4
Day 15: 8.5e6 cells counted. 9.4 mL required for 8e6 cells.
Rat #5
Day 15: 700,000 cells counted.
Rat #6
Day 15: 550,000 cells counted.
Rat #7
Appendix C: Contraction Data
Mouse
Day 15 Day 17 Day 20 Day 22 Day 24 Day 27 Day 29
3/19/2008 3/21/2008 3/24/2008 3/26/2008 3/28/2008 3/31/2008 4/2/2008 Sample 1 8 8 8 8 8 8 8 Sample 3 8 7.9 7.9 7.9 7.9 7.9 7.9 Sample 5 8 8.5 8.5 8.5 8.5 8.5 8.5 Goat 138 Sample 1 8 6 3.6 2.9 2.3 2.3 2.3
Sample 3
8
6
5
2.7
2.5
2.5
2.5
Sample 5 6.5 3.7 2.5 2.5 2.52.5
25
2.6
Goat 139 Sample 1 8 6.5 4 3 2.5 2.7 2.7 Sample 3 8 5.5 3.9 3.4 3.2 2.7 2.7 Sample 5 8 6 4 3.5 3.2 3.2 3 Goat 140 Sample 5 8 5 Goat 171 4 4.7 3.7 3.2 3.1 2.9 2.7 2.7 2.72.7
2.7
2.7
2.9 2.9 2.92.9
2.9
2.9
3.7 2. 3.2 2.7 2.7 2.7 2.7 2.3 2.32.7
2.5
2.5
3.2
3.4 2
2.7
2.3
2.3
2.7 2.72.7
Sample 1 8 4 3.2 3 Sample 2 8 4.4 3.2 2 Sample 3 8 4.4 3.2 3Same 4
J-0
3.52
Sample 5 8 4.2 3.2 2.7 Sample 6 3.5 3Goat 182
Sample 1 8 6.5 4.4 2.7 2.5 2.5 2.5 Sample 3 8 6.6 5.0 3.6 3.1 2.5 2.3 Sample 4 3.7 Sample 5 8 7 4.2 3.4 2.9 2.7 2.7 Goat 316 Sample 1 8 7.1 3.7 2.9SaPie
0765837
2.3 2.0 .,, -Sample 3 6.0 3.9Sample 1
8
6
4.9
3.8
Sample 3
8
5.5
3.7
3
2.7
2.3
3.2
2.3
Sample 5
8
7.5
4.2
3.2
2.7
2.7
2.3
-Pig Sample 1 8 5.5 4.7 4.1 3.8 3.8 3.8 Sample 3 8 5.3 4.2 4.2 4 4 4 Sample 5 8 5.5 5 4.7 4.2 4.2 Goat 138 Myo Sample 1 8 6.8 3.9 2.7 2.5 2.1 2.1 Sample 3 8 6.8 4 3.5 3.5 3.5 3.5 Goat 139 Myo Sample 2 8 7.3 4.2 4 3.7 3.5 3.5 Goat 140 Myo Sample 1 8 6.8 4.2 3.7 3.5 3.2 3.2 .m . .e 2 ... .. . 8 . 4.2 .2.9 :2,7, 2,7 Sample 3 Goat 171 Myo 4.2 3.7 3.4 3.4 3.2 Sample 28 -27Sample 2
8
5.9
4.2
3.5
3
2.7
2.7
:Sample
3
;8
64.2
3.6
.
3.5
3.5
Goat 182 Myo Sample 1 8 8.2 4.7 3.7 3.2 3.2 Sample 3 8 7.5 3.9 2.7 2.5 2.5 2.9 2.5Goat 316 Myo
Sample 1
ý8
824535
, 27
2.7
Sample 2 8 8.2 4.5 3.7 3.5 3.5 3.2Sape
3879543.35
3.
Mouse Myo Sample 1 8 8 8 8 Sample 3 8 8 8 8 8 8 8 8 8 88
8
8
Pig Myo Sample 2 8 5.9 5 4.4 4.2 4.5 4.5 Rat 4 Sample 1 8 4.5 3.7 3.2 3 2.7 2.7 Sample 3 8 3.2 4 3.5 3.5 3.2 3 ControlG exp 7.9 7.9 7.9 7.9 7.9 7.9 7.9 M exp 5.8 5.4 5.8 5.8 5.8 5.8 5.8