HAL Id: hal-00005528
https://hal.archives-ouvertes.fr/hal-00005528
Submitted on 16 Dec 2020HAL is a multi-disciplinary open access
archive for the deposit and dissemination of sci-entific research documents, whether they are pub-lished or not. The documents may come from teaching and research institutions in France or abroad, or from public or private research centers.
L’archive ouverte pluridisciplinaire HAL, est destinée au dépôt et à la diffusion de documents scientifiques de niveau recherche, publiés ou non, émanant des établissements d’enseignement et de recherche français ou étrangers, des laboratoires publics ou privés.
The SCUBA Bright Quasar Survey (SBQS): 850micron
observations of the z>4 sample
Kate G. Isaak, Robert S. Priddey, Richard G. Mcmahon, Alain Omont, Celine
Peroux, Robert G. Sharp, Stafford Withington
To cite this version:
Kate G. Isaak, Robert S. Priddey, Richard G. Mcmahon, Alain Omont, Celine Peroux, et al.. The SCUBA Bright Quasar Survey (SBQS): 850micron observations of the z>4 sample. Monthly Notices of the Royal Astronomical Society, Oxford University Press (OUP): Policy P - Oxford Open Option A, 2002, 329 (1), pp.149. �10.1046/j.1365-8711.2002.04966.x�. �hal-00005528�
2
O
02MNRAS.329..1491
Mon. Not. R. Astron. Soc. 329, 149-162 (2002)
The SCUBA Bright Quasar Survey (SBQS): SSO-juim observations of the z 5:4 sample
Kate G. Isaak,1* Robert S. Priddey,2,3* Richard G. McMahon,2* Alain Omont,4*
Celine Peroux,2* Robert G. Sharp2* and Stafford Withington1* 1Cavendish Laboratory, University of Cambridge, Madingley Road, Cambridge CB3 OHE
^Institute of Astronomy, University of Cambridge, Madingley Road, Cambridge CB3 OHF
3Blackett Laboratory, Imperial College, Prince Consort Road, London SW7 2BW
^Institut d’Astrophysique de Paris, CNRS 98bis Boulevard Arago, 75014 Paris, France
Accepted 2001 August 31. Received 2001 August 31; in original form 2001 April 4
ABSTRACT
We present initial results of a new, systematic search for massive star formation in the host galaxies of the most luminous and probably most massive z ^ 4 radio-quiet quasars (Mb ^ —27.5; ^7^(1450Á) > 1013 L©). The survey, undertaken at 850 pum using SCUBA at
the James Clerk Maxwell Telescope (JCMT), has a target sensitivity limit of 3cr ~ lOmJy, set to identify sources suitable for detailed follow-up, e.g. continuum mapping and molecular line diagnostics. A total of 38 z ^ 4 radio-quiet quasars have been observed at 850 jxm, of which eight were detected (>3cr) with Sgsoixm ~ lOmJy (submillimetre-loud). The new detections almost triple the number of optically selected, submillimetre-loud z ^ 4 radio- quiet quasars known to date. We include a detailed description of how our quasar sample is defined in terms of radio and optical properties. As a by-product of our selection procedure, we have identified 17 radio-loud quasars with z ^ 4.
There is no strong evidence for trends in either detectability or 850-pum flux with absolute magnitude, MB. We find that the weighted mean flux of the undetected sources is
2.0±0.6mJy, consistent with an earlier estimate of ~3mJy based on more sensitive observations of a sample z ^ 4 radio-quiet quasars. This corresponds to an inferred star formation rate of ~1000Moyr-1, similar to Arp220. The typical star formation time-scale
for the submillimetre-bright sources is ~T Gyr, 10 times longer than the typical accretion- driven e-folding time-scale of ~5 X 10⁷ yr. Our 850-pim detection of the z = 4.4 quasar PSS
J1048+4407, when analysed in conjunction with 1.2-mm single-dish and interferometric observations, suggests that this source is resolved on angular scales of 1-2 arcsec (6-12 kpc). In addition, we present a new optical spectrum of this source, identifying it as a broad absorption line (BAL) quasar. The new redshift is outside that covered in a recent CO line search, highlighting the need for accurate redshifts for the observation and interpretation of high-redshift line studies.
Key words: dust, extinction - quasars: general - galaxies: starburst - cosmology: observations - infrared: galaxies.
1 INTRODUCTION
It is becoming increasingly clear that star formation, with its complementary photometric and spectroscopic signatures, provides observers with a range of probes with which to study formation and evolution of galaxies in the early Universe. Particularly important ^E-mail: [email protected] (KGI); [email protected] (RSP); rgm@ ast.cam.ac.uk (RGM); [email protected] (AO); [email protected] (CP); [email protected] (RGS); [email protected] (SW)
to such studies are the millimetre/submillimetre/far-infrared wavebands, a wavelength range in which clear fingerprints of both warm dust, heated by ultraviolet (UV) starlight from massive young stars, as well as atomic and molecular line emission, excited in regions of ongoing star formation, can be seen. Recent work by Wright & Reese (2000) has further illustrated the importance of this waveband, demonstrating that roughly half the radiation pro- duced by starlight in galaxies is absorbed by dust and re-radiated in the far-infrared/submillimetre waveband. Likewise, COBE obser- vations have shown that the cosmological star formation rates
2
O
02MNRAS.329..1491
150 K. G. Isaak et al.
inferred from UV and optical studies (e.g. Madau, Pozzetti & Dickinson 1998) are more than a factor of two lower than those required to produce the observed far-infrared background, suggesting that there exists a population of star forming galaxies that are hidden at optical wavelengths.
How can one use the (sub)millimetre waveband to study star formation, both qualitatively and quantitatively, in the high-redshift universe? Photometric measurements of the (sub)millimetre-wave emission constrain the rest-frame spectral energy distribution - with more than one (sub)millimetre flux it is possible to evaluate a (sub)millimetre spectral index, thus confirming or refuting a thermal origin of the emission (e.g. Hughes et al. 1993; Isaak et al. 1994). With sufficient data, one can also determine a best-fitting dust temperature, from which a bolometric (sub)millimetre/far- infrared luminosity can be derived. Establishing the original energy source responsible for this reprocessed emission is considerably more difficult (e.g. Sanders et al. 1989), as the continuum spectral signatures of dust-obscured active galactic nuclei (AGN) and massive starbursts are very similar, indeed, with current telescopes indistinguishable at (sub)millimetre wavelengths. If one assumes that some fraction of the (sub)millimetre/far-infrared luminosity arises from reprocessed UV light from massive stars, then it is possible to infer star formation rates also. The presence and detection of the molecular gas tracer CO, found ubiquitously in nearby starburst galaxies, points to future star formation potential. In addition, spectral line measurements provide important kinematic and dynamic information. Whilst thermal emission from dust out to high redshift can now be detected with relative ease as a result of the new generation of sensitive multi-pixel millimetre (Kreysa et al. 1998) and submillimetre-wave arrays
(Holland et al. 1999), detecting CO is more difficult, requiring a very accurate measure of the source redshift because of the limited bandwidth (A v ~ 1 GHz), and thus small fractional bandwidth at 100-200 GHz (<1 per cent), of the current generation of millimetre-wave receivers.
2 SURVEY DESIGN 2.1 Choice of targets
Recent attempts to study star formation in the high-redshift Universe have focused on identifying target objects in two quite distinct ways. The first of these - deep, unbiased surveys of blank sky - only recently became possible with the introduction of sensitive, multi-pixel (sub)millimetre-wave bolometer arrays. Surveys undertaken using the Submillimetre ContinUum Bolometer Array (SCUBA; Holland et al. 1999) at the James Clerk Maxwell Telescope (JCMT; e.g. Hughes et al. 1996; Barger et al. 1996; Smail et al. 1997; Bales et al. 1999) have been particularly successful, identifying some tens of submillimetre-selected sources with 850-pm fluxes > 5 mJy. Classifying these sources, in particular assigning redshifts, is complicated by (i) the limited accuracy with which one can determine the source positions using a single-dish telescope, and (ii) the large number of potential, though very faint, optical counterparts revealed in deep observations of the submillimetre-wave source fields. As a result it has been possible to begin to derive the star formation properties of only a handful of submillimetre-selected sources (e.g. Frayer et al. 1998, 2000).
In contrast, objects with known redshifts provide a very
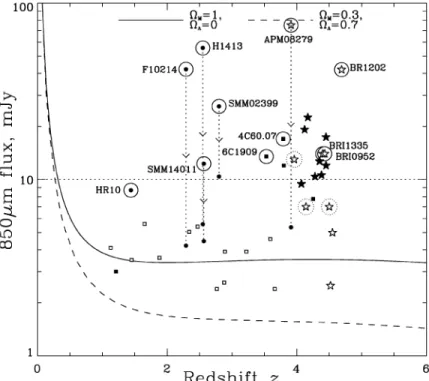
Figure 1. A plot of the 850-pm flux versus redshift for high-z objects with observed 850 pm fluxes and accurately determined redshifts. Stars denote detections of Z > 4 radio-quiet quasars, with solid stars representing detections presented in this paper, and open stars sources taken from previous work. Squares denote detections of radio galaxies - unfilled taken from Archibald et al. (2001) and filled from the literature. Solid circles denote a selection of other high-z objects. Objects for which CO observations exist are ringed: solid rings - CO detections; dashed rings - CO non-detections. Lensing corrections are indicated by vertical dotted lines. The two curves trace the estimated flux that an Arp220-like object (based on a fit to observed far-infrared fluxes of Arp220) would have at different redshifts (solid line - ÍIm — T = 0.; dashed line CIm — 0.3; ÍU = 0.7) The dashed horizontal line denotes the target 3cr limit of this survey.
O'! ^r1
The SCUBA Bright Quasar Survey 151
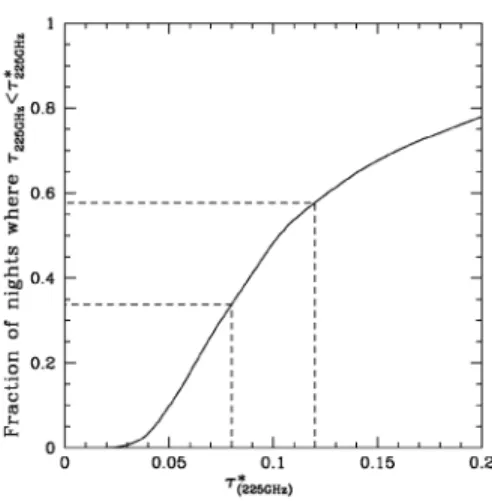
Figure 2. Plotted are the fraction of nights for the first nine months of the year 2000 for which t225ghz — r225GHz- Note that the abscissa extends to
0.2 only (and hence the maximum fraction of less than 1) as this represents the maximum t225ghz for which 850-|jim observations of the brightest
sources can sensibly be made at JCMT (a zenith transmission >45 per cent). Tau measurements were made using the 225-GHz CSO tipping radiometer. Data have been taken from the CSO web-page (http://puuoo. caltech.edu/tau-plot/), kindly provided by Ruisheng Peng. The dashed lines delineate the range of tau values during which the sky transmission was between —60-70 per cent, a t225ghz range of 0.08-0.12 (referred to as
‘grade 3’ conditions at the JCMT). Such conditions occur for approximately 25 per cent of the available night-time observing time. Note, the term ‘grade 1’ is used to refer to occasions when the 850-jjLm zenith sky transmission is better than about 80 per cent (7225 < 0.05), whilst ‘grade 2’ conditions are those for which the zenith transmission is between about 70 and 80 per cent.
convenient starting point from which to base searches for and studies of star formation at high redshift. The first submillimetre- wave observations of high-redshift objects were made in the early 1990s (Clements et al. 1992; Barvainis, Antonucci & Coleman 1992). Following on from the successful detection both of the (sub)millimetre continuum (by Clements et al. 1992) and CO emission (by Brown & Van den Bout 1991 and subsequently Solomon et al. 1992) from the ultra-luminous infrared galaxy IRAS F10214+4724 at z ~ 2.3, (sub)millimetre studies of the continuum and CO line emission at high redshift of a small sample of radio-quiet quasars taken from the Cambridge Automatic Plate Machine (APM) B/R / B/R/I z ~ 4 quasi-stellar object (QSO) survey (Irwin, McMahon & Hazard 1991; Storrie- Lombardi et al. 1996, 2001), were made. At the time, these quasars were amongst the most distant known. With the combination of the 800 jjim/1100 pm measured with UKT14 (Duncan et al. 1990) on the JCMT (Isaak et al. 1994) and the 1300-pm fluxes measured at IRAM 30-m (McMahon et al. 1994), it was possible to show that the (sub)millimetre continuum spectral indices were consistent with thermal emission. The (sub)millimetre emission thus indicates the presence of massive quantities of warm dust (Td — SOK) at redshifts of z ~ 4, synthesized, and possibly heated, by bursts of star formation in the host galaxies. Large quantities of molecular gas, Mh, > 1010Mo as traced by CO (e.g. Ohta et al. 1996;
Omont et al. 1996a; Guilloteau et al. 1999), were also detected in the host galaxies of a handful of quasars at z > 4. The detected gas masses are comparable to the total dynamical mass of the galaxy, a situation seen in galaxies undergoing their first bouts of star formation (e.g. Downes & Solomon 1998).
2.2 Survey definition
The number of objects from which both dust and CO emission have been detected is small, and so it is currently not possible to differentiate between observed/derived properties that are repre- sentative of objects at high redshift, and those that are extreme. An efficient way by which to increase the number of massive star- forming galaxies that can be readily studied needs to be identified. Shown in Fig. 1 is a plot of the observed 850-pm flux versus redshift for a selection of high-redshift objects with accurately determined redshifts. Looking at z ~ 4, each source from which CO emission has been detected at greater than 5a (see Guilloteau et al. 1999, and references therein) has > lOmJy, and
conversely CO emission has been detected from four of the five objects with > lOmJy.1 This suggests an observationally
imposed cut-off for successful CO detections of ~ lOmJy. If we assume that by z ~ 5 [0.9(1.2) Gyr after recombination, using an Einstein-de Sitter cosmology, with H0 = 50 km s-1 Mpc-1 and
a A cosmology, ClM = 0.3, Da = 0.7, H0 = 65kms_1 Mpc-1,
respectively] at least one massive burst of star formation has already taken place, producing dust, then it is clear that it is more efficient, with the current generation of radio telescopes, to search first for the continuum dust emission from an object, following up secure detections with searches for CO.
A 3cr detection of a source with — lOmJy takes approximately 25 min (excluding pointing and calibration over- heads) using SCUBA/JCMT under observing conditions for which the sky transparency is roughly 65 per cent. Such conditions occur —25 per cent of the time (Fig. 2) and thus a survey for submillimetre-loud object at high redshift can slot well into periods during which the sky transmission is not high enough to undertake the high-priority projects requiring the highest possible sky transmission. Indeed, under the very best observing conditions, when the zenith transparency at 850 pm can be as high as 90 per cent, the required sensitivity can be reached in an elapsed time of around 12 min. Such observations become an inefficient use of telescope time, because they become dominated by slew time and pointing checks. In contrast, the detection of associated molecular gas for a 10-mJy source would currently take some tens of hours using the Plateau de Bure (PdB) and the Owens Valley Radio Observatory (OVRO) millimeter interferometers.2
Samples of statistically significant sizes over a wide range of redshifts are crucial not only to studies of star formation and AGN activity at different epochs but also to the determination of the role of star formation activity and black hole accretion in the evolution of the Universe.
In this paper we report on the first results of an 850-pm program (the SCUBA Bright Quasar Survey - SBQS) to search for massive starbursts in the host galaxies of the most optically bright radio- quiet quasars at z ^ 4 using SCUBA at the JCMT. The aim of the survey is to identify a sample of —10 submillimetre-bright sources,
1 CO has not been detected in BR B1117 — 11329, which has
VSSOpm) — 13 ± 1 mJy, Buffey et al. (in preparation).
2 If we assume that the submillimetre flux is thermal in origin, then with
assumptions about the physical properties of the dust: = 40K, a dust spectral index of ß = 2 (see Priddey & McMahon 2001) for a ‘fiducial’ z ^ 4 quasar), a power-law dust emission given by equation (5) we derive a dust-mass estimate of around 109Mo for Sgsoixm = lOmJy. Assuming a
‘typical’ gas-to-dust ratio of 500, and MH2/CO conversion factor of o: — 4,
the equivalent CO gas mass that one might expect is —few X 1011 M©,
detectable at millimetre wavelengths using either the PdB interferometer or the OVRO interferometer in some tens of hours.
2 O 02MNRAS.329..1491 152 K. G. Isaak et al. m CD TJ 2 G tuO CÖ S CD -t-J O OT <
-20 APM (McMahon, Irwin)
Hamburg Quasar Survey (Hagen et al.) Sloan Digital Sky Survey
ROSAT Deep Surveys (McHardy/Schmidt, Hasinger) - Palomar (Schmidt, Schneider, Gunn) PC
LBQS VHewett et al.) PSS (Djorgovski, Kennefick) 10f 10u 10° - 10 10 S HT o CD- 3 M j/3 0 1 2 3 4 5 6 Redshift
Figure 3. Hubble diagram: absolute magnitude versus redshift, of all known z > 4 radio-quiet quasars and a selection of z < 3 surveys. Absolute magnitudes have been calculated using a cosmology of H0 — 50km s 1 Mpc 1, qQ — 0.5, and magnitudes taken from the literature. The sources delineated by the solid box
are those that define the optically-bright, z ^ 4 parent sample of the survey described in this paper, whilst the sources delineated by the dashed box are those of the follow-up z ~ 2 sample. Black hole masses have been calculated using the relationship given in equation (2), and a bolometric correction Lb0\/LB = 12
(Elvis et al. 1994)
from which it should in principle be possible to detect molecular gas emission using the current generation of millimetre interferometers. Based on extrapolations to 850 [im of obser- vations of radio-quiet quasars at z ^ 4 by Omont et al. (1996b), we might expect to detect —0.3 submillimetre-bright sources per hour (^850 |xm ~ lOmJy) under modest submillimetre observing con- ditions (sky transparency of roughly 65 per cent at 850 jjim). We note that this detection rate is based on the simplifying assumption that the sample of Omont et al. (1996b) has the same distribution of source properties as any sample that we might define for the purposes of these observations. Such newly identified submilli- metre-bright sources, together with the four z — 4 well-studied objects, from which CO has already been detected, and those for which upper limits to a gas mass have been obtained, will provide a sample of statistically significant size {N > 3VÑ), with which it will be possible to begin to draw conclusions about massive star formation and its role in the high-redshift universe.
We present here the interim results of our survey for a subset of 38 sources and discuss the implications of these current and future observations on studies of star formation at high-redshift. In a companion paper, Omont et al. (2001) present 1.2-mm observations of the same parent sample of z ^ 4 quasars. In a future paper (Priddey et al. in preparation), we will present an analysis of the combined sample of more than 100 z ^ 4 quasars, including observations by others of different samples, which have now been observed at either 850 jim or 1.2 mm.
We have adopted an Einstein-de Sitter cosmology of //0 = 50km s-1 Mpc-1, Í1 = 0 and, where useful, include a
comparison with parameters derived using a A cosmology with //0 = 65kms 1 Mpc-1, Vlm = 0.3 and ilA = 0.7.
3 SAMPLE DEFINITION 3.1 Optical properties
The parent observational sample has been selected to include the
most luminous (rest-frame UV) z ^ 4 radio-quiet quasars known as of 2000 January. The quasar sample was primarily drawn from the APM multicolour photographic surveys based on APM scans of United Kingdom Schmidt Telescope (UKST) plates by Irwin et al. (1991), Storrie-Lombardi et al. (1996, 2001) and the Caltech Digitised Palomar Observatory Sky Survey (DPOSS) based on Space Telescope Science Institute (STSCI) scans of POSS-II plates made by Kennifick et al. (1995). The first step in the sample definition was to calculate the absolute magnitude in a consistent manner for all (—200) known z ^ 4 quasars in order to select a sample on the basis of their rest-frame absolute Æ-band magnitudes (see Fig. 3).
Absolute ZLband magnitudes (MB) were evaluated using
observed R-band magnitudes for all the quasars, assuming a spectral index a = —0.5 and using the relationship
Mb=R- dm(z) + 2.5 log(l + z) + kR{z) - 0.5, (1)
where R is the observed R-band (À — 6500 A) magnitude and dm(z) is the distance modulus, evaluated at the source redshift. R-band magnitudes were determined from APM scans of UKST OR (5900-6900 À) or POSS-1 E (6200-6800 A) plates from APMCAT (http://www.ast.cam.ac.uk/~apmcat; McMahon & Irwin 1992). Errors on these magnitudes are estimated to be aR — 0.3. At z ~ 4, the R band starts to sample the rest-frame
spectrum near the prominent Lyman a emission line; and at higher redshifts, the band suffers from the strong intergalactic absorption shortwards of Lyman a. To compensate for both of these effects, a redshift- and filter-dependent correction factor [KR{z)\ is invoked.
Initially, for the purposes of sample selection, we adopted the empirical correction of Kennefick, Djorgovski & Meylan (1996). However, for the subsequent analysis, we derived our own correction, based on the mean Large Bright Quasar Survey (LBQS) quasar spectrum (Francis et al. 1991), combined with the model of the hydrogen opacity of the intergalactic medium of Madau (1995), to obtain an average correction for each filter as a function of © 2002 RAS, MNRAS 329, 149-162
2
O
02MNRAS.329..1491
redshift. The correction was compared with empirical values derived from all z > 4 quasars for which we possess accurately flux-calibrated spectra (see Storrie-Lombardi et al. 1996, and Peroux et al. 2001), and is found to follow the trend of the data well. The scatter superimposed on this trend is large, however, leading to an overall uncertainty in the magnitude aM ~ 0.5. This
scatter reflects not only the idiosyncratic variations in the effects of emission and absorption features, but also an intrinsic dispersion in the slope of the quasar continuum. For some of the quasars in the sample, a more direct measure of the continuum luminosity is available either through optical spectroscopy or through photom- etry in the K band, which, at z = 4, samples the rest-frame B band directly. However, for consistency and for the purposes of comparison, we use the uniformly available R magnitudes to derive a homogeneous measure of luminosity. Issues pertaining to the derivation of accurate source magnitudes will be addressed more completely in a following paper.
Objects already observed to a sensitivity equivalent or better than that of the survey as parts of other (sub)millimetre programs were excluded from the target list (e.g. the five quasars observed by McMahon et al. 1999; BR B0019-1522, PSS J0134+3307, PSS J0747+4434, BR B1600+0729 and BR B2237-0607), as were sources with transit elevations of less than 60°. An exception to this was PSS J1048+4407, previously observed and detected at 1.25 mm at the IRAM 30-m telescope (Maoli et al., in prep), but not confirmed with 1.35-mm observations at the Plateau de Bure interferometer (Guilloteau et al. 1999).
3.2 Radio properties
The final source selection criterion was that of radio flux. We have used the National Radio Astronomy Observatory (NRAO) Very
The SCUBA Bright Quasar Survey 153 Large Array (VLA) Sky Survey (NVSS) to measure or place upper limits on the radio emission from all z ^ 4 quasars that were potentially in our sample. The NVSS survey (Condon et al. 1998) is a sensitive radio survey that was carried out with the VLA at 1.4 GHz in D and DnC configurations, with a 5cr sensitivity of —2.5 mJy beam-1. To determine which of the optically selected
quasars are radio-loud, we cross-correlated the optical positions of our parent sample with sources in the NVSS catalogue. To assess the probability of a radio source being matched to one of the optically selected quasars by chance, the background source density was determined by counting the density of radio sources in the annulus with radius 100 to lOOOarcsec, resulting in a value of 50 deg-2. The rms positional error of the NVSS catalogue is given
as 7 arcsec and thus, if one assumes that any radio source within 21 arcsec is a potential match, one expects 0.005 chance associations per source, or a probability of 1 in 200 of incorrectly attributing radio emission to an optically selected quasar. Even if this radio emission were not to be from the quasar itself, a fraction of the emission would still be picked up by JCMT/IRAM main and error beams.
Listed in Table 1 are all optically-selected z ^ 4 quasars for which we find an NVSS source within a 30-arcsec radius - a total of 17 objects - along with their derived parameters. A detailed discussion of the radio properties of the sample is beyond the scope of this paper and will be presented elsewhere. All sources with 5i.4ghz > 2.5 mJy were excluded from the final SBQS target list. Based on a flux extrapolation of 5oc and a canonical spectral index of a = 0.7, we therefore expect the maximum synchrotron contamination at 850 pun to be less than 0.1 mJy. Thus, it is reasonable to assume that the emission from any source that is detected at 850 pm is likely to be thermal in origin.
Our final target list comprised 76 sources with MB < -27.5,
Table 1. Optically and X-ray selected z ^ 4 quasars with 1.4 GHz associations in NVSS. (Assuming a cosmology H0 — 50 km s 1 Mpc \
qo — 0.5, and a spectral index for both radio and optical a — -0.5).
Quasar name RA (J2000) Dec (J2000) dra log P(r)b
(false) mJy Sl.4 mJy Mb log U log R\ PSS JO 121+0347 PSS J0211 + 1107 PSS J0439—0207 PSS J2256+3230 01 21 26.1 02 11 20.0 04 39 23.2 22 56 10.4 +03 47 07 + 11 07 17 -02 07 02 +32 30 19 4.13 3.99 4.40 4.04 1.7 0.5 0.5 2.4 -4.5 -5.5 -5.5 -4.1 78.6 44.1 43.8 14.7 1.65 0.93 0.92 0.31 -27.5 -27.7 -27.5 -26.0 34.69 34.41 34.49 33.95 2.97 2.61 2.77 2.83 BRI B0151—0025 BR J0234—1806 BR J0324—2918 BR J0355 —3811 BR J0523 —3345 BR J1053-0016 BR J1305-1420 01 53 39.6 02 34 55.1 03 24 44.3 03 55 04.9 05 25 06.2 10 53 20.4 13 05 25.2 -00 11 05 -18 06 09 -29 18 21 -38 11 42 -33 43 06 -00 16 49 -14 20 42 4.20 4.30 4.62 4.58 4.40 4.29 4.04 7.3 0.7 0.6 13.4 1.0 2.6 1.0 -3.2 -5.2 -5.3 -2.6 -4.9 -4.1 -4.9 3.0 35.8 236.8 2.4 188.7 9.7 20.6 0.07 0.75 5.00 0.05 3.96 0.2 0.43 -27.5 -27.5 -28.8 -29.4 -28.1 -27.0 -28.0 33.28 34.38 35.26 33.26 35.12 33.81 34.09 1.56 2.66 3.02 0.78 3.16 2.29 2.17 SDSSp J0131 +0052s SDSSp J0210—0018s SDSSp J0300+0032s SDSSp J1235 —0003c PC J0027+0525a PC J2331+0216A 01 31 08.2 02 10 43.2 03 00 25.2 12 35 03.0 00 29 49.97 23 34 32.0 +00 52 48 -00 18 18 +00 32 24 -00 03 31.8 +05 42 04.4 +02 33 22 4.19 4.77 4.19 4.69 4.10 4.09 3.8 3.2 7.8 0.5 8.5 4.9 -3.8 -3.9 -3.1 -5.5 -3.0 -3.5 4.2 11.5 7.1 19.5 4.8 2.7 0.09 0.24 0.15 0.41 0.10 0.06 -25.8 -26.8 -26.0 -26.3 -24.8 -27.3 33.43 33.97 33.70 34.19 33.47 33.22 2.39 2.53 2.58 2.95 2.83 1.58 For completeness all quasars in our parent sample for which potential radio counterparts were found are listed in the table. Those marked with A and s have already been found by Stern et al. (2000) and Fan et al. (2001) to have NVSS counterparts, whereas the source labelled c
has a radio-counterpart (Fan et al. 2000) as found in the FIRST survey (Becker, White & Helfand, 1995). a Separation between optical and
nearest radio source positions. b Logarithm of the probability that the optically selected quasar has boon falsely associated with a radio
source from the NVSS catalogue, separated by distance r. c Extrapolated contribution by synchrotron emission to any observed 850 pm
flux, based on a spectral index, a, of 0.7, Svocv~a. d [Li.4] = ergs-1 Hz-1. e Ratio of radio (1.4GHz) to optical (rest-frame 5-band)
luminosities.
2
O
02MNRAS.329..1491
154 K. G. Isaak et al.
augmented by 22 sources with —27.0 < MB < —27.5 which were
included to improve sky coverage: 15 quasars were taken from the APM B/R and B/R/I survey {B/R and B/R/I sources: Irwin, McMahon & Hazard 1991; Storrie-Lombardi et al. 1996, 2001), 70 from the Palomar Sky Survey (PSS sources: Djorgovski 2000), two from the Palomar Survey (PC sources: Schneider, Schmidt & Gunn 1991a; Schneider et al. 1991b), one from the VLA (VLA source: Stern et al. 2000) and 9 from the Sloan Digital Sky Survey (SDSSp sources: Fan et al. 1999, 2000).
4 OBSERVATIONS AND DATA REDUCTION 4.1 Observations
Observations were made using the wide-band 850-fim filter on SCUBA, during periods when the zenith sky transparency was —60-75 per cent (T^o^m ~ 0.08-0.12, referred to as grade 3 weather in JCMT parlance). Sources were observed by the ‘displaced observer’ with priority set by source availability and luminosity. The standard 850-pan photometry observing mode was used; a nine-position jiggle superposed onto a 7-Hz/60-arcsec chop throw of the secondary mirror in the azimuthal direction, implemented to remove sky emission offsets. Gradients in sky emission were taken out by ‘nodding’ the telescope - a physical movement of the telescope to the off-position every 18 s. A typical observation consisted of sets of c. 30-50 18 s integrations, with the total number of integrations chosen to achieve a sensitivity of ^850|jLm(lcr) — 3.3 mly. Pointing was checked regularly, and found to be accurate to better than a few arc sec. Astronomical seeing was monitored using the 5-GHz CfA phase interferometer. The phase monitor was not in continual use, however; when working, the data suggested that the seeing was not worse than 3arcsec.3 Sky
transparency was monitored using regular 850-pun sky-dips and data taken by the 225-GHz Caltech Submillimetre-Observatory (CSO) tau-meter. Flux calibration was achieved using the primary calibrators Mars and Uranus, as well as the secondary calibrators HLTau, IRC 10216,4 OH231 and 16293.5 Absolute fluxes for the
planets were derived using the Starlink package, fluxes. The average time to complete the observation of a single source, including pointing, calibration, sky-dip and slewing overheads, was over 1 h. This is quite a bit longer than would be the case for a contiguous set of observations, reflecting the start/stop nature of a back-up program.
Here, we discuss observations of a subset of the target list: sources observed during the period 2000 February-July.
4.2 Data reduction
Data were reduced using the Starlink SURF reduction package (Jenness & Lightfoot 2000), using the automated ORACDR pipeline (Jenness & Economou 2000) as well as a basic SURF- based pipeline written in-house prior to the release of ORACDR.
3 We note that, in the worst case, the combined pointing and seeing errors of
3 arcsec would result in a loss of point-source coupling of 40 per cent, assuming a Gaussian beam profile with a full width at half-maximum (FWHM) of 14 arcsec.
4 IRC 10216 was adopted as calibrator on one occasion only, as a result of its
periodic variability. When used as a calibrator, the output flux of IRC 10216 was at a maximum.
5 See the JCMT web-page (http://www.jach.hawaii.edu/JACpublic/JCMT/
Continuum-observing/SCUBA/astronomy/calibration/calib.html) for the most recent calibrator fluxes.
Two different schemes were implemented to determine an appropriate measure of the background sky-noise, the first using the mean of the inner ring of six pixels surrounding the central on- source bolometer to define the temporal sky variations, and the second using the median of all bolometers. In general, only small differences in the final fluxes and rms noise determinations were seen between the two methods for observations in which detections were made. There were, however, more significant differences in rms values determined for non-detections. In particular, the sky- noise correction derived from the inner-ring mean resulted in a non-zero offset in the distribution of the signal-to-noise ratios for all off-source bolometers, indicating incomplete sky-removal. This was in contrast to the median-derived sky correction which we chose to adopt in the final analysis. All quasar data were clipped at the 20a level prior to applying the sky-subtraction, in order to eliminate transient spikes. Corrections for atmospheric extinction were made using sky opacities derived from 850-pan sky-dips. Individual sets of integrations were gain-calibrated and then concatenated, with a 3<r despiking applied to remove outlier data points.
5 RESULTS
Source positions, redshifts and derived absolute B magnitudes (MB)
are tabulated in Table 2, along with dates of observation, observed flux densities, rms values and signal-to-noise ratios. Note that calibration errors of —20 per cent have not been included in the error budget.
A total of 38 quasars have been observed (see Table 2): eight sources were detected with ^ lOmJy, at statistical significances of better than 3a. 30 sources were observed but not detected: 19 sources with 3a < lOmJy, eight sources with 10 < 3a < 12mJy and three sources with 3a > 12mJy (see Table 2). Achieving the pre-requisite survey sensitivity consistently proved to be difficult - the initial 3a — lOmJy sensitivity threshold was frequently both bettered (19 non-detections) and not reached (11 non-detections).
The size of the observed sample is large enough not only for a significant number of submillimetre-bright sources to have been newly identified, but also to define a sample with which one could start to assess the detection rate as well as detectability as a function of redshift and absolute magnitude. Here we adopt a 3<r — 12 mJy cut-off (a limit which includes 90 per cent of sources observed in our program, Fig. 4), noting that there are possibly as many as three sources which may have — lOmJy, but for which the observations obtained were not deep enough to obtain a 3 (j detection. Sources were initially included in our target list based on an approximate 3cr— lOmJy cut-off at 850-p.m. BR B1500+0824 and BR B1302—1404 were thus included in the JCMT sample in spite of having been observed at 1.25 mm at IRAM 30-m down to an equivalent Sgsoixm ~ lOmJy. We include these two sources in our statistical sample which includes all sources for which the observed sensitivity is 3<r < 12 mJy - a total of 35 objects.
6 DISCUSSION
6.1 Newly detected submillimetre-bright sources
To date, our survey has identified a total of eight submillimetre- bright sources (where here we include PSS J1048+4407) with fluxes between —10-25 mJy. This equates to a —24 per cent © 2002 RAS, MNRAS 329, 149-162
2
O
02MNRAS.329..1491
The SCUBA Bright Quasar Survey 155 Table 2. Observational parameters of the observed z ^ 4 sample.
RA
(J2000) (J2000) Dec. Mr obs. date time (s) integ. Flux
7 (mJy) (mJy) rms S/N PSS J0452+0355 PSS J0808+5215 PSS 11048+4407^ PSS J1057+4555 PSS J1248+3110 PSS J1418+4449 PSS J1646+5514/j PSS J2322+1944 4.38 4.45 4.38* 4.12 4.35 4.28 4.04* 4.17 04 52 51.5 08 08 49.4 10 48 46.6 10 57 56.3 12 48 20.2 14 18 31.7 16 46 56.5 23 22 07.2 +03 55 57 +52 15 15 +44 07 13 +45 55 53 +31 10 44 +44 49 38 +55 14 46 + 19 44 23 19.1 18.3 19.6 16.5 18.9 17.6 17.1 17.7 -27.6 -28.7 -27.4 -29.4 -27.6 -28.6 -28.7 -28.1 7Feb00 4Feb00 12Feb00/3Jul00 HFebOO 22Apr00 23Apr/3Jul00 7/13/14Feb00 27Jul00 2640 2640 3940 2640 1340 4200 5240 1600 10.6 17.4 12.0 19.2 12.7 10.4 9.5 22.5 2.1 2.8 2.2 2.8 3.4 2.3 2.5 2.5 5.0 6.2 5.3 6.9 3.8 4.5 3.8 8.9 PSS J0007+2417 PSS J0014+3032 PSS J0133+0400 BR B0300—0207 BR B0351 — 1034 BR B0401 —1711 PSS J0852+5045 PSS J0926+3055 BRI B0945 —0411 PSS J0957 + 3308 BRI B1013 + 0035 PSS J1026+3828 PSS J1058 + 1245 BRI B1110+0106 SDSSp J1226+0059 BR B1302—1404 PSS J1315+2924 PSS J1326+0743 PSS J1347+4956 SDSSp J1413—0049 PSS J1432+3940 BR B1500+0824 PSS J2154+0335 PSS J2155 + 1358 PSS J2203 + 1824 BR B2212—1626 PSS J2238+2603 PSS J2241 + 1352 PSS J2323+2758 PSS J2344+0342 4.05 4.47 4.15* 4.25 4.35* 4.24 4.2 4.19 4.14 4.25 4.40 4.18 4.33 3.92* 4.25 4.00* 4.18 4.17 4.46 4.14 4.28 3.94* 4.36 4.26* 4.38 3.99* 4.03 4.44* 4.18 4.24* 00 07 38.7 00 14 43.0 01 33 40.3 03 02 53.0 03 53 46.9 04 03 56.6 08 52 27.3 09 26 36.3 09 47 49.6 09 57 44.5 10 15 49.0 10 26 56.7 10 58 58.4 11 12 46.3 12 26 00.7 13 05 25.2 13 15 39.8 13 26 11.8 13 47 43.3 14 13 32.4 14 32 24.8 15 02 45.4 21 54 06.7 21 55 02.2 22 03 43.4 22 15 27.3 22 38 41.6 22 41 47.8 23 23 40.9 23 44 03.2 +24 17 24 +30 32 03 +04 00 59 -01 56 07 -10 25 19 -17 03 24 +50 45 11 +30 55 05 -04 25 15 + 33 08 20 +00 20 19 + 38 28 45 + 12 45 55 +00 49 58 +00 59 24 -14 20 42 +29 24 39 +07 43 58 +49 56 21 -00 49 10 + 39 40 24 +08 13 06 +03 35 39 + 13 58 26 + 18 28 13 -16 11 33 +26 03 45 + 13 52 02 +27 58 00 +03 42 26 18.3 18.7 18.3 18.5 18.6 18.7 17.7 16.4 18.8 17.8 18.8 18.1 17.6 18.3 18.9 18.6 18.5 17.5 18.5 19.1 18.0 19.3 19.0 18.0 18.0 18.1 17.0 19.1 18.6 18.2 -27.6 -28.1 -27.6 -27.6 -27.8 -27.6 -28.2 -29.5 -27.3 -28.3 -27.9 -27.8 -28.8 -27.1 -27.0 -27.4 -27.4 -28.4 -28.3 -27.0 -28.2 -26.3 -27.5 -28.1 -28.7 -27.9 -28.9 -28.0 -27.3 -28.1 13Jun00 30May00 13Jun00 12Feb00 12Feb00 HFebOO 9/12Feb00 4/llFebOO 5Feb00 1 lFeb/7Mar00 12Feb00 12Feb00 12Feb00 5Apr00 14Feb00 23Apr00 22Apr00 3Jul00 22Apr00 14Feb00 3Jul00 14Feb00 5Apr00 5Apr00 30May00 30May00 30May00 5Apr/30May00 30May00 30May00 1340 1340 1340 3940 2640 3940 5240 6540 2640 5396 2640 2640 2640 1340 2640 1600 1340 1340 1470 2640 2640 3940 1860 1860 1340 1340 1340 2250 1340 1340 1.2 10.6 -1.0 -1.7 -2.8 2.6 1.8 0.8 2.1 3.7 5.5 5.2 0.00 7.1 -0.06 1.0 4.1 -0.3 8.5 -1.0 -1.4 6.2 2.6 0.8 3.0 7.9 2.2 -0.2 -2.8 11.3 3.5 4.2 2.8 2.8 3.0 3.4 2.2 1.9 2.2 1.9 2.7 2.5 2.2 3.4 3.3 3.2 3.3 3.9 3.9 3.2 3.3 3.0 2.6 3.1 4.2 4.5 3.9 3.0 4.0 4.0 0.3 2.5 -0.4 -0.6 -0.9 0.8 0.8 0.4 1.0 2.0 2.0 2.1 0.0 2.1 0.0 0.3 1.3 -0.1 2.2 -0.3 -0.4 2.1 1.0 0.4 0.7 1.7 0.6 -0.05 -0.7 2.8
a BR/BRI source positions taken from the APM catalogue; PSS source parameters have been taken from the Palomar Sky Survey (Djorgovski
2000) SDSSp source positions have been taken from the Sloan Digital Sky Survey (Fan et al. 1999; Fan et al. 2000). h Palomar Sky Survey
redshifts have been taken from Djorgovski (2000), with the exception of sources marked *, where redshifts have been taken from Peroux et al. 2001 ; Storrie-Lombardi et al. 2001. r R magnitudes determined from APM scans of the UKST OR (5900-6900À) or POSS-1 E (6200-6800Á)
plates. Errors are estimated to be crR ~ 0.3. ^ See text for an explanation of the method used to evaluate the absolute source magnitudes.e
Integration times have been calculated based on no: integrations Xl8 s/integration Xl.5, where both chopping and a 50 per cent observational SCUBA overhead has been allowed for, This does not include any overhead for calibration or pointing.7 Where a 3o- detection was not been
achieved, the tabulated flux is given as the on-source signal only. 8 The position reported here is that taken from the Djorgovski web page. A
check of the position using the APM catalogue after the JCMT SCUBA observations had been made revealed that the published position is out by 2 arcsec. The correct position is: (J2000) 10 48 46.64 +44 07 10.9. h The flux reported is the weighted sum of four sets of integrations that
differed considerably in statistical significance, ranging from 3cr and better detections to a near-zero on-source flux. detection rate, which is comparable to the rate of —30 per cent seen
by Omont et al. (1996b), and based on 1.25-mm observations of a sample of radio-quiet, optically selected APM quasars with z ^ 4.6
We stress here that the comparison between the detection rates of the two different samples is valid only if the underlying properties of the constituent sources are the same. We defer a more detailed analysis of this issue to another paper. In each case, the measured
6 To make the comparison between the two different samples, observed at
two different wavelengths, we use the flux ratio of 850fxm/1250|jim derived by Priddey & McMahon (2001) for z ^ 4 quasars. At z ~ 4.2 this ratio is —2.6, and thus we can compare the sample here with sources observed to 1er < 1.5 mJy at 1.25m by Omont et al. (1996b). In evaluating our detection rate we have excluded BR B1500+0824 and BR B1302 — 1404 because of the common non-detection to the IRAM 30-m sample.
© 2002 RAS, MNRAS 329, 149-162
fluxes are more than a factor of 100 in excess of what might be expected based on the NYSS radio limits. Thus, the single submillimetre flux measurements, combined with the a priori radio limit of our parent sample, suggest strongly that we are detecting submillimetre emission from these sources that is thermal in origin. How do the fluxes reported here compare with those measured for other z ^ 4 radio-quiet quasars? The brightest radio-quiet quasar z ^ 4 host galaxy observed both at submillimetre and millimetre wavelengths remains to be BR B1202—0725 (Isaak et al. 1994; McMahon et al. 1994; Buffey et al., in preparation), with an 850-p.m flux of almost greater than twice that of the brightest sources detected in this survey, PSS J0808+5215, PSS J1057+4555 and PSS J2322+1944. Arcsec resolution (c. 1-2 arcsec) imaging with the Plateau de Bure interferometer (PdB) by Omont et al. (1996a) have shown BR B1202—0725 to be a composite source,
O'! ^r1 156 K. G. Isaak et al. O'! CM 00 tí S CM O O CM
made up of two comparable gas-rich and possibly interacting galaxies. If we assume that the 850-p.m flux distribution is similar to that of the 1.25-mm flux, split equally between the two objects, then BR B1202-0725 is no longer such an exceptional object, and has a flux comparable to that of the brightest sources present here. With the further assumption that PSS J0808+5215, PSS J1057+4555 and PSS J2322+1944 are all single sources, there is a suggestion of a maximum observed flux of S^JLm — 20 mJy.
The origin of such a maximum is intriguing. A possibility is that the star formation is self-regulated, with the large number of supernovae events in the massive starburst disrupting the local ISM and blocking star-formation. We are currently obtaining both deep radio observations with the VLA and millimetre observations with PdB, with which we will be able to establish the degree of extension of the sources.
We note that the sources we detect here are as bright, if not brighter, than those detected in blank-sky and cluster-lensing surveys. Interestingly, the two brightest sources detected in the
cluster lensing surveys (Ivison et al. 1998; Knudsen et al. 2000) have 850-p.m fluxes of just over Sgsoixm ~ 20mJy, and are both AGN at z ~ 2. For comparison, the measured fluxes of the brightest and median source in the Canada-UK Deep Sky Survey are ~8 mJy and —4.5 mJy respectively (e.g. Bales et al. 1999). The 200 square arcmin survey ‘8mJy survey’ (3 a < 8mJy; Dunlop 2000; Scott et al., in preparation) has yielded 24 sources, detected at statistically significant levels, with 10 brighter than lOmJy, and the brightest with a flux of 15 mJy. We note here that others have also started similar surveys to our own at 1.25-mm using the IRAM 30-m (Carilli et al. 2001a), but leave the comparison between surveys to a companion paper.
6.2 PSS J1048+4407
In addition to identifying new submillimetre-bright sources, we detected PSS J1048+4407, a source for which observations at — 1.3 mm with IRAM-PdB and the IRAM 30-m were in conflict.
Figure 4. A plot of the rms values obtained for all observations reported in this paper. The histogram denotes the number of sources with a given rms, while the solid curve denotes the normalized cumulative number of sources with a given or lower rms. Note the dashed line delineates 90 per cent of the objects observed, and defines the cut-off rms chosen for the statistical sample discussed in the text.
6.2.1 Single-dish versus interferometric observations
As reported by Guilloteau et al. (1999), PSS J1048+4407 was not detected at 1.35-mm using the PdB interferometer (S\ 35 mm =
0.25 ± 0.68 mJy) in the CD configuration, but was tentatively detected by Maoli et al. (in preparation) 1.25-mm at the IRAM 30-m (5*125mm ~ 3 ± 1 mJy). Our result, = 12.0 ± 3mJy, is consistent, to within the error-bars, with the 30-m single-dish measurement if we assume a ratio of S850\xm/Si.25mm ~ 2.5, as derived by Priddey & McMahon (2001). Neither of the two single- dish measurements, however, are consistent with the interferometer observations. Pointing errors in the interferometer map and the effects of anomalous refraction would need to be much larger than realistically possible to explain the non-detection with the interferometer, given that at —220 GHz the primary beam is —27 arcsec. It is more likely that the host galaxy of PSS J1048+4407 is spatially extended on the scales greater than the synthesized beam of the interferometer (—3x2 arcsec).
To resolve out a substantial fraction of the millimetre flux, the spatial extent of the emission does not need to be much greater than the size of the beam, depending more critically on the projected baselines/effective U-V coverage of the observations and the source extension relative to the position angle of the beam. At a
Figure 5. An optical spectrum of PSS J1048+4408, taken at a resolution of 5 A using the ISIS spectrograph on the William Herschel Telescope (WHT) by Peroux et al. (2001). On the basis of this spectrum, we classify this quasar as a BAL, not possible with previous spectra because of the limited spectral coverage. The presence of broad absorption lines makes an accurate determination of the host galaxy redshift difficult, however we derive redshifts of: z = 4.422 [Lya(1216)], z = 4.367 [Si + O (1400)] and z = 4.354 [C iv(1539)]. From an average of these three lines we derive a source redshift of z = 4.38, in contrast to z = 4.45 as first derived by Kennefick et al. We note that even this redshift estimate could be biased high, as explained in the text.
2
O
02MNRAS.329..1491
redshift of z ~ 4.4, 1 arcsec equates to a linear size of c. 6 kpc. To resolve out emission over arcsec scales suggests that the starburst activity, as traced by the millimetre emission, is taking place over the whole galaxy rather than confined to nuclear regions as observed in Arp 220 (Downes & Solomon 1998; Sakomoto et al. 1999), Arp 193 and Mrk 273 (Downes & Solomon 1998). This is in contrast to BRI B0952—0115 and BR B1335 —0417 where a comparison between the single-dish and interferometric obser- vations suggests that in each case a significant fraction of the millimetre emission is unresolved, but in a similar way as in the case of BRI 117—1329 and BRI 144—0723, as discussed in Omont et al. (2001).
6.2.2 Updated redshift
Also reported in Guilloteau et al. (1999) is the non-detection of CO (5-4) line emission using the PdB interferometer. This is interesting in light of the 850-jam detection presented here, as the source is one of two from five with a previously inferred Sssoixm > lOmJy for which a search for CO emission failed. A
reassessment of the source redshift based on a new optical spectrum taken at the WHT by Peroux et al. (2001) (Fig. 5) reveals that the CO observations were centred at an erroneous redshift. Using the combination of the Lya, Crv and the Siiv+Oiv emission lines, we derive a redshift of z = 4.38, in contrast to that derived from the Lya line only by Kennefick et al. (1995), z = 4.45, and the redshift at which a search for CO emission was made (Guilloteau et al. 1999). The difference in redshift is significant - much greater than that covered by the interferometer correlators. Our average redshift may, however, be biased high as it contains the measurement based on the Lyman a line which is observed to be systematically higher than the other two emission lines (C iv, Si iv + O iv). It is possible that the Lyman a line profile is affected by absorption due to the N v (1240 A) line which would bias its peak redward. Using the Civ line alone, we derive a systemic redshift of z = 4.360, correcting for the systemic shift from rest for the line as derived by Tytler & Fan (1992).
Given the discrepancy between the observed and newly derived redshift we suggest that the failure to detect CO emission is due to incorrect redshift, rather than an anomalous gas-to-dust ratio. This serves as a note of caution - given the limited bandwidth of the current generation of millimetre and submillimetre telescopes, the
The SCUBA Bright Quasar Survey 157 non-detection of any spectral line emission should be considered both in an astronomical context and, as importantly, in terms of a possible error in redshift.
6.3 Inferred astrophysical properties
Shown in Table 2 are physical properties of the detected sources derived from the optical luminosities and submillimetre fluxes reported here. We have assumed that the measured submillimetre flux arises from thermal emission from warm dust, and that the dust is heated solely by the UY flux from massive star formation. The former can be justified, at least in part, by the radio-selection criterion which we used to define the parent sample. In addition, we will be able to combine the 850-jam fluxes measured here with 1.25-mm fluxes that have been measured in a parallel 1.25-mm MAMBO survey (Omont et al. 2001) running at the IRAM 30-m (Priddey et ah, in preparation). The latter assumption is more difficult to justify, as it is possible that a fraction of the rest-frame UV absorbed by the dust comes from the central AGN. The size of the AGN contribution is difficult to estimate as it depends on the source geometry (e.g. Sanders et al. 1989), about which we have little knowledge. Observations of local, ultra-luminous infrared galaxies (ULIRGs, with LFIR > 1012 Lq), arguably the most likely
low-redshift counterparts of the quasar host galaxies, have been interpreted as being suggestive that between 70-80 per cent of ULIRGS are powered predominantly by starburst activity, and that at least half of the sources observed probably have simultaneous starburst and AGN activity on physical-size scales of a few kpc (e.g. Genzel et al. 1998). An additional unknown at this point is the extent of gravitational lensing and thus source magnification. The incidence of gravitational lensing amongst high-luminosity quasars is around 1 per cent for samples of bright quasars (Kochanek 1993). Studies of previous samples have, however, a median redshift of only z ~ 2. At z ~ 4 the probability of a quasar being lensed by a foreground galaxy is a factor of ~2 higher, as a result of the larger optical depth to lensing (Turner, Ostriker & Gott 1984; Fukugita et al. 1992). This qualitative argument is in rough agreement with the empirical result that only one of the 49 z > 4 APM BRI quasars, the z = 4.43 APM quasar BRI B0952—0115 with Sgsojxm ~ 14 mJy (Buffey et ah, in preparation) is known to be gravitationally lensed. It therefore seems unlikely that a large number of the submillimetre-bright source detections reported here
Table 3. Derived properties of the detected (submillimetre-loud) z ^ 4 radio-quiet quasars sources - see Section 6.3 for the definitions used in deriving source properties.
Source name (1) (2) Mfí (3) vLb 1013Lo (4) mbh 109Mo (5) M'dCC Mo/yr (6) MSph 10nMo (7) ^SSO mJy (8) Md 109Mo (9) Lfir 1013Lo (10) SFR 'F Mo/yr (11) T* Gyr/T (12) PSS J0452+0355 PSS J0808+5215 PSS J1048+4407 PSS J1057+4555 PSS J1248+3110 PSS J1418+4449 PSS J1646+5514 PSS J2322+1944 4.38 4.45 4.38 4.12 4.35 4.28 4.35 4.17 -27.6 -28.7 -27.4 -29.4 -27.6 -28.6 -28.7 -28.1 0.9 2.5 0.8 2.8 0.9 2.3 2.5 1.4 3.6 10.0 3.0 19.0 3.6 9.1 10.0 5.8 80 220 70 420 80 200 220 130 7.3 20 6.0 38 7.3 18 20 12 10.6 17.4 12.0 19.2 12.7 10.4 9.5 22.5 0.9 1.5 1.1 1.8 1.1 0.9 0.8 2.0 1.2 2.0 1.3 2.3 1.4 1.2 1.1 2.6 1200 2000 1300 2300 1400 1200 1100 2600 0.6 1.0 0.5 1.7 0.5 1.5 1.9 0.4 median • ; 4 SBQS" 4.35 4.35 -28.4 -28.7 1.8 2.5 10.2 7.4 230 165 21 15 12.4 12.4 1.1 1.5 2.0 1.4 1350 1950 1.1 1.1 The quantities and parameters evaluated for the median quasar are based on the median observables, from which parameters are derived.
b Median quasar properties evaluated as above, based on a A cosmology, ÍU = 0.7, flM = 0.3, and H0 = 65 km s-1 Mpc-1. For comparison the
ratio of the square of the luminositiy distance under the two cosmologies at z = 4.35 is 1.38. © 2002 RAS, MNRAS 329, 149-162
2
O
02MNRAS.329..1491
158 K. G. Isaak et al.
are lensed. High-resolution optical imaging of the whole sample would be needed to confirm this. At present we have no evidence to support or refute the possibility of magnification, and thus assume that there is none.
6.3.1 Astrophysical properties inferred from the optical AGN luminosity
An advantage of targeting quasars for a study of high-redshift (sub)millimetre sources is that we are able to use the optical luminosity of the AGN to constrain the mass of the black hole powering the AGN, from which we can estimate the mass of the surrounding host galaxy. If we assume a bolometric correction from the B band of L^/Lb = 12 (Elvis et al. 1994), and that the black hole is accreting at the Eddington rate, then there exists a simple relation between black hole mass, MB, and its bolometric
luminosity, Lboi:
Gioi 47TGm(Tj pcMbh = 3X 10¹³ MbH t
109M© °' (2)
where (tt is the Thomson scattering cross-section and mp is the
proton mass.
The accretion rate can be written in terms of the luminosity and an efficiency parameter e, for which a conservative estimate is eo.i = öTÄ 1 (Rees 1984):
4Tacc L 22 Mbh
e0., 109 M© M© yr
1 (3)
While equation (3) holds, the growth of black hole mass and luminosity is exponential, with an ¿-folding time-scale TaCc = Afsn/Macc = eo.i x 4.5 X 10⁷ yr. Studies in the local Uni-
verse (Magorrian et al. 1998; Gebhardt et al. 2000) have shown that a linear relation exists between the mass of non-active black holes and the stellar mass of the surrounding galactic bulge at the current epoch. If we assume that there is some imprint of this relationship at early epochs (however, see Omont et al. 2001 and Priddey et al., in preparation), then we can obtain a measure of the mass of the final (i.e. z = 0) quasar host galaxy (Column 7 of Table 3) using a value of MBh ~ 0.005Msph from Gebhardt et al. (2000). It is
clearly possible that at z = 4 the ratio of the black hole to spheroid mass is different from the local value. For example, Kauffmann & Haehnelt (2000) predict that the host masses will less massive by a factor of between 5-10 at z = 2 as compared to z = 0. Work by Rix et al. (1999) on the magnitudes of lensed host galaxies of lensed quasars also suggests that the masses of quasar hosts are low at high redshift. However, although this is based on the observed rest- frame 5-band magnitudes, these observations could be affected by dust obscuration, and hence the inferred masses may be underestimated. In the long term, one would hope that it will be possible to determine the dynamical masses of quasar hosts at high redshifts so that the issue can be studied more directly.
These estimates represent lower limits to the mass of the central engine, as we observe the quasars while they are still accreting. It seems unlikely for a number of reasons, however, that the masses grow much larger than this. First, the inferred masses are large, comparable to the most massive non-active black holes (<109'5Mo) at the cores of nearby galactic bulges (Gebhardt
et al. 2000). Secondly, the accretion rates required to sustain these luminosities (Column 6 of Table 3) are extreme, and encroaching upon (—10 per cent of) the star-formation rates inferred from the far-infrared luminosity (Column 11 of Table 3). Thus, the gas supplies in the galaxy are being rapidly diminished, at a rate too
high to sustain either process for much longer than 1 Gyr - indeed Priddey & McMahon determine a median gas consumption time- scale of 0.1 Gyr (Priddey & McMahon 2001). Although we have no knowledge of the precise accretion history of the AGN, we can derive a time taken to assemble the inferred black masses of around 0.5-1 Gyr if we assume that the accretion rate is Eddington-limited throughout the growth of the black hole and that the seeds from which the black holes form are M— 103_6Mo (Haehnelt,
Natarajan & Rees, 1998).
6.3.2 Astrophysical properties inferred from the submillimetre fluxes
Turning to the host galaxy properties derived from the sub- millimetre flux observed at frequency v0 = vresi/( 1 + z), the dust
mass given in Column 9 of Table 3 is determined using Md = S(Vo)pi
(1 + z)KD(vr)Bv{vr,TDy (4)
where we assume that the emissivity k: is a power-law function of frequency, and we adopt the normalization of Hildebrand (1983):
(5)
where kq = 18.75 cm2 g-1 is the value determined at À = 125 (Jim.
For the dust temperature and emissivity index, we use TD = 40 K
and ß = 2.0, derived by Priddey & McMahon (2001) from a composite submillimetre spectrum of z ^ 4 quasars. The far- infrared luminosity is calculated by integrating under the thermal, greybody spectral energy distribution,
5fir = 2Trhc 2 kT\ — \ F(4 + /M4 + ßf 4+^ (6) where again we assume 7 = 40 K, ß = 2.0, F is the Gamma- function and f is the Riemann-Zeta function. If we assume that all
Absolute magnitude (MB)
Figure 6. Cumulative distribution of the fraction of detections (heavy solid line), non-detections (dashed line) and observations (light solid line) as a function of absolute magnitude. There is some indication of a difference in the cumulative distribution, however using the K-S test, it can be shown that the null hypothesis that the magnitudes of the detected sources and the non-detected sources are similarly distributed cannot be rejected at the 90 per cent level.
O'! ^r1
The SCUBA Bright Quasar Survey 159 O'! CM 00 CM O O CM
the energy re-radiated by the dust originates from stars, then the far-infrared luminosity can be used to estimate the current star- formation rate:
"* = ,pxü^M0yrl- (7)
The exact value of W depends sensitively upon the star-formation history of the host galaxy, the stellar Initial Mass Function (IMF) and the fraction of starlight absorbed by the dust cloud. We adopt the simplifying assumptions that the star formation rate is constant and that the cloud-covering factor is unity. Then, for a Salpeter IMF with upper and lower mass cut-offs of 100 and 0.3 Mq, respectively, 'T' ~ 1 and is approximately constant for ages ^ 108 yr. The total time required to form the final stellar mass
(Column 7 of Table 3) inferred from the black hole mass is given in Column 12 of Table 3, and is roughly 1 Gyr. The star formation history derived from the chemical/dynamical model of elliptical galaxy evolution developed by Friaça & Terlevich (1998) has just such a form — a constant star formation rate lasting for around 1 Gyr. Observational support for long periods of sustained high star formation rates is reported in Abraham et al. (1999) (see Fig. 6). For an alternative interpretation, however, see Omont et al. (2001), who argue for shorter burst time-scales.
We have two time-scales describing the fate of gas in the evolving host galaxy: a time-scale for the conversion of gas into stars, ~ 1 Gyr; or gas accretion onto a super-massive central black hole with an accretion time of the same order. This may be suggestive of a possible synchrony between the formation of the AGN and its host galaxy, however we leave a more detailed and speculative discussion of the inferred quasar and host galaxy properties to a future paper.
Throughout, we have assumed that the dominant heating source is star formation in the quasar host galaxy. At present, however, it is not possible to determine conclusively whether this is indeed the case. If, instead, we were to that assume the AGN contribution to the dust heating cannot be neglected, then (i) for a fixed dust temperature the inferred star formation rate would fall, with a
Redshift
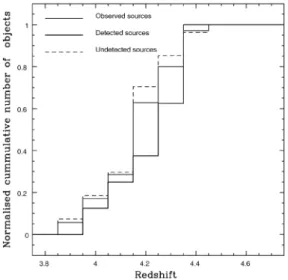
Figure 7. Cumulative distribution of the fraction of detections (heavy solid line), non-detections (dashed line) and observations (light solid line) as a function of optical redshift. Again, using the K-S test, we cannot reject the null hypothesis that the redshift distributions of the detected and non- detected sources are the same.
© 2002 RAS, MNRAS 329, 149-162
corresponding increase in the formation time for the massive spheroid, and (ii) a hotter dust component heated directly by the AGN would contribute significantly to the overall far-infrared luminosity and thus, in addition, smaller dust masses as well as lower star formation rates and longer time-scales would be inferred. Observations of samples, such as this SBQS sample, at shorter wavelengths using SIRTF will reveal any warmer dust component.
6.4 Optical/submillimetre correlations
With a sample of 38 observed sources, it becomes meaningful to start to make both qualitative and quantitative assessments of the trends in the detection rates with source redshift and magnitude. Shown in Figs 6 and 7 are the cumulative magnitude and redshift distributions for the observed, detected and non-detected sub- samples. To assess quantitatively the degree of similarity between the distributions we use the Kolmogorov-Smirnoff (K-S) test (e.g. Barlow 1998). In Fig. 6 we note that there is some indication of a difference between the detected and non-detected cumulative
Absolute Magnitude (MB)
Figure 8. Histograms of the absolute magnitudes (MB) of the observed
sample (dotted shading) and the detected sample (solid horizontal shading).
Redshift
Figure 9. Histograms of the redshift distribution of the observed (dotted shading) and the detected sample (solid horizontal shading).
2
O
02MNRAS.329..1491
160 K. G. Isaak et al.
Absolute Magnitude (MB)
Figure 10. A plot of 850-jxm flux versus MB. Filled circles denote source
detections reported in this paper, while crosses denote upper limits to non- detections [where plotted flux = ‘signal’ + 1.645er (90 per cent confi- dence)]. The flux error bars denote 1er errors, as given in Table 2, whilst magnitude error bars, aMB — 0.5, are a measure of the combined systematic
and random error in the measurement and derivation of the absolute magnitudes.
magnitude distributions. However, formally, the difference is not statistically significant, and so we cannot reject the null hypothesis that the two samples are drawn from the same population. The magnitude and redshift distribution of the two samples are shown in a slightly different way in Figs 8 and 9.
Plotted in Fig. 10 are the 850-p,m fluxes and absolute magnitudes for the detections presented in this paper, as well as upper limits [1.65<r (90 per cent confidence level) + ‘on-source signal’] for non-detections. Error bars for both detections and non detections are 1er. It is difficult to make a quantitative assessment of the significance of the optical/submillimetre magnitude correla- tion, given the significant fraction of upper limits in the sample. There are two competing physical processes that would produce a statistically significant correlation between detected submillimetre flux and absolute quasar luminosity. First, the most luminous quasars reside in the most massive host galaxies, in which there is likely to be ongoing star-formation - the larger the host galaxy, the greater the potential for massive bursts of star-formation, and thus there is more dust and more UV photon flux with which to heat the dust. More quantitatively, using equations (2), (3) and (7), Lfir _ 0-1
If we observe these objects just before the end of their accretion lifetime, when the accretion rate encroaches upon the star formation rate, Macc ~ M* => LFir ~ vLB (Priddey & McMahon
2001). Secondly, the more luminous the central quasar, the greater its UY output, and thus the larger the power that may be absorbed by dust and re-emitted in the rest-frame far-infrared.
A plot of the source magnitude versus redshift for detections and non-detections also fails to reveal a preferential range of redshifts/magnitudes for which the number of detections is high. It must be cautioned, however, that the number of sources in any one bin is small, so the overall statistical significance of this result is low. In addition, a potential systematic bias arises from the fact that the absolute Æ-band magnitudes have been derived from the
S/N ratio
Figure 11. Histogram of the signal-to-noise ratios (S/N) of all non- detections in the current sample: heavy-lined histogram denotes S/N ratios evaluated for the on-source pixel. Superposed (light-line) is the outline of the S/N distribution for all functional off-source pixels, over which is plotted a Gaussian approximation to the off-source distribution. Note that the mean of the off-source distribution is zero, and the distribution itself very nearly Gaussian. This suggests that the sky-offsets are being removed correctly.
measured Æ-band APM magnitudes. As discussed in Section 3.1, calculating an optical luminosity from an R magnitude is complicated for sources at z ^ 4 because the band is contaminated by redshifted Lyman a emission and, at higher redshifts, intergalactic absorption. We introduced a correction to account these effects, and found that it worked well on average, but that the scatter about the average was aM ~ 0.5. Obtaining optical spectra
and/or AT-band photometry for all the targets may ultimately help to alleviate this.
6.5 Non-detections - an assessment of the contribution of the z ~ 4 population to the submillimetre-wave background Shown in Fig. 11 is the signal-to-noise ratio distribution of the non- detections (solid line) - this has a clear non-zero mean. More quantitatively, the weighted mean of fluxes of the observed non- detections is 2.0±0.6mJy, a quantity that we can evaluate because our survey has a sensitivity that is consistent between sources to within a factor of ~2. The mean can therefore be used to provide a statistical measure of the submillimetre flux of the underlying radio-quiet quasar host galaxy population. The derived value is consistent with the earlier estimate of ~3 mJy based on the deeper observations of a sample of six z ^ 4 radio-quiet quasars (McMahon et al. 1999), and is also around the value that one might expect for an Arp 220 like ultraluminous infrared galaxy at z ~ 4.5 (Fig. 1 - the value obtained is between the curves predicted by the two different cosmological models). If we assume a source density for z > 4 quasars of 1 per 500 deg-2, and a mean flux as
determined above, then the contribution of the quasar host galaxies to the 850-pan background is negligible.
7 FOLLOW-UP WORK
Whilst useful for identifying the most submillimetre-bright © 2002 RAS, MNRAS 329, 149-162
2
O
02MNRAS.329..1491
sources, the detection of objects at a single wavelength clearly provides only a limited insight into the detailed physical properties of the individual sources. Given the strong dependence of the inferred far-infrared luminosity on dust temperature, and that star formation rates are derived from the far-infrared luminosity, it is important to determine the far-infrared spectral energy distri- butions for individual objects if we are to obtain independent measures of the star formation properties and potential of the quasar host galaxies. We have started follow-up programs at several wavelengths: (i) a parallel program at 1.25 mm using the IRAM 30-m which, when combined with (ii) 450-p.m measure- ments using SCUBA at the JCMT, will be used to constrain the spectral energy distributions and thus dust temperatures and far- infrared luminosities; (iii) CO observations using millimetre interferometers to measure the gas mass, simultaneously setting upper limits to the physical extents of the high-z host galaxies, are also in progress, along with (iv) YLA observations to search for the signatures of star formation or weak radio sources (Carilli et al. 2001b).
Our approach to targeting star formation at high-redshift has been to preselect candidates that are likely to have massive molecular gas reservoirs, as inferred from the presence of dust. At some redshift, however, it may become more efficient to search directly for the gas reservoir itself, as the presence of significant quantities of dust preselects for objects in which at least one massive starburst of star-formation must already have taken place. A second selection effect arises from the original definition of our sample. By basing our sample on the most optically bright quasars, we tacitly assume that the quasar and the host galaxy are coeval. Using arguments based on time-scales given in Section 6.3 above, we have shown that this may be the case. The evidence, however, is not conclusive, and indeed depends on a number of assumptions, not least of which being that the rest-frame far- infrared luminosity is powered solely by star-formation, and that there is no gravitational lensing of the quasar and its host galaxy. With the combination of measurements of the CO, dust and optical properties, the physical parameters that we can derive from these measurements and a sample of statistically significant size, we will be able to investigate in a more quantitative manner.
We are currently undertaking a parallel search for submillimetre- bright quasar host galaxies at redshifts z ~ 2. The elapsed time interval between z ~ 4 and z ~ 2 is around 1.5 Gyr, corresponding to a doubling of the age of the Universe at z ~ 4. Given the gas masses observed in these radio-quiet quasar host galaxies, and the high star formation rates that we infer from the FIR luminosity (Table 3), one might expect that if the formation redshift of quasar host galaxies is high, a sizeable fraction of any molecular gas reservoir would be used up between z ^ 4 and by z ~ 2. The submillimetre-wave properties of the two samples should therefore be quite different. We note, however, that the e-folding lifetime of the quasar (50Myr) is considerably shorter than this interval (again, see Table 3), and so the quasar population that we see at z ~ 2 may not be the same as the z ~ 4 population. Any global evolution in submillimetre-wave luminosity between z ~ 4 and z ~ 2 host galaxies could in this case reflect variation in the underlying cosmological processes, such as merger rates, dynamical time-scale and availability of cold gas, driving the evolution of the population (Kauffmann & Haehnelt 2000).
8 SUMMARY
We have observed a total of 38 z ^ 4 radio-quiet quasars at 850 p,m © 2002 RAS, MNRAS 329, 149-162
The SCUBA Bright Quasar Survey 161 using the JCMT. We have identified a total of eight new submillimetre-bright sources with S^so^m > lOmJy, including a previously ambiguous detection made at the IRAM-30m at 1.25 mm. The observations were carried out under modest observing conditions (sky transmission —65 per cent), but even so the integration time per target was around 0.5 h, giving an overall detection efficiency of 0.5 sources per hour of integration. This method, observing preselected targets in photometry mode, thus compares favourably with the complementary strategy of blank-field mapping. These observations triple the number of known z ~ 4 objects for which CO observations should be possible in a finite amount of observing time to A > 10. As such, we now have a submillimetre-bright sample of statistically significant size, for which we possess accurate identifications and spectroscopic redshifts, for which we can now start to study the star-formation properties in detail. We analysed a new optical spectrum of the BAL PSS J1048+4407, one of the sources detected, and find that the redshift is quite different from that used for CO observations of Guilloteau et al. (1999), which may explain the observed lack of CO from this object. The strong 850-p,m emission in contrast to the lack of 1.35-mm emission detected in PdB observations strongly suggests that the much higher angular resolution obtained with the interferometer is causing significant fraction of the emission to be resolved out - the (sub)millimetre source is extended.
Of the remaining 30 objects observed, 27 were observed down to a sensitivity of 3cr < 12mJy and were not detected. Based on this sample, we find that our detection rate is comparable to that measured by Omont et al. (1996b) at 1.25 mm using 30-m, scaled to match the appropriate flux limits. At present, the sample (detections and non-detections) is too small to determine formally whether there is a range of absolute magnitudes and redshifts for which the rate of detection is high, however there may be some indication that the magnitude distribution of the detections and non-detections differ. We determined a fiducial flux of 2.0 ± 0.6 mJy for the non-detections, which we believe to be a statistical measure of the submillimetre flux of the more submillimetre-faint quasar host population.
ACKNOWLEDGMENTS
We thank the support scientists and telescope support specialists at the JCMT, in particular Gerald Moriarty-Schieven and Iain Coulson, the ‘displaced observer’ for the care and attention afforded to the observations and Tim Jenness for very useful discussions on SURF and ORACDR. KGI, RSP, CP and RS acknowledge a PPARC fellowship and PPARC studentships respectively, and RGM acknowledges the support of the Royal Society. This work was partially funded by the EC TMR FMRX- CT96-0068 and EARA. The JCMT is operated by JAC, Hilo, on behalf of the parent organisations of the Particle Physics and Astronomy Research Council in the UK, the National Research Council in Canada and the Scientific Research Organisation of the Netherlands.
REFERENCES
Abraham R. G., Ellis R. S., Fabian A. C., Tanvir N. R., Glazebrook K., 1999, MNRAS, 303, 641
Archibald E. M., Dunlop J. S., Hughes D. H., Rawlings S., Bales S. A., Ivison R. J., 2001, MNRAS, 323, 417


![Figure 10. A plot of 850-jxm flux versus M B . Filled circles denote source detections reported in this paper, while crosses denote upper limits to non- detections [where plotted flux = ‘signal’ + 1.645er (90 per cent confi- dence)]](https://thumb-eu.123doks.com/thumbv2/123doknet/14802073.606689/13.918.500.792.91.395/figure-filled-circles-detections-reported-crosses-detections-plotted.webp)
