Collaborative Design in the Sustainable
Infrastructure Planning Game
The MIT Faculty has made this article openly available.
Please share
how this access benefits you. Your story matters.
Citation
Grogan, Paul T., and Olivier L. de Weck. "Collaborative Design
in the Sustainable Infrastructure Planning Game." Proceedings
of the Annual Simulation Symposium (ANSS), Spring Simulation
Conference 2016 (SpringSim 16) (April 2016).
As Published
http://scs.org/documents/
SpringSim16/2016_SpringSim_Program.pdf
Publisher
Society for Modeling & Simulation International
Version
Author's final manuscript
Citable link
http://hdl.handle.net/1721.1/102177
Terms of Use
Creative Commons Attribution-Noncommercial-Share Alike
Detailed Terms
http://creativecommons.org/licenses/by-nc-sa/4.0/
Collaborative Design in the Sustainable Infrastructure
Planning Game
Paul T. Grogan
Stevens Institute of Technology
Hoboken, NJ 07030, USA
[email protected]
Olivier L. de Weck
Massachusetts Institute of Technology
Cambridge, MA 02139, USA
[email protected]
ABSTRACT
The pursuit of sustainable large-scale infrastructure sys-tems demands new design tools to exchange information among distributed decision-makers. This paper describes and demonstrates interoperable simulation gaming as a collabora-tive infrastructure design activity. The Sustainable Infrastruc-ture Planning Game (SIPG) is a prototype implementation using the High Level Architecture (HLA) to exchange tech-nical data between sector-specific simulation models. SIPG considers a 30-year strategic planning exercise for a fictional desert nation with three role-players controlling water, en-ergy, and agriculture sectors. A human subjects experiment with 15 ad-hoc teams shows integrated, synchronous tools fa-cilitate data exchange which, subsequently, is correlated with effective design for common objectives.
Author Keywords
Infrastructure systems; collaborative design; simulation gaming; federated simulation
ACM Classification Keywords
C.2.4 COMPUTER-COMMUNICATION NETWORKS: Distributed Systems; I.6.3 SIMULATION AND MODEL-ING: Applications; K.4.3 COMPUTERS AND SOCIETY: Organizational Impacts
1. INTRODUCTION
Infrastructure systems supply but also demand vast quanti-ties of resources. Their large scale and scope requires deci-sions to be distributed across organizational and jurisdictional units. This decentralized authority structure allows individ-ual decision-makers to develop expertise but also encourages local objective-seeking behaviors with limited visibility to broader objectives such as sustainability.
Recent calls for sustainable infrastructure planning empha-size a need for collaborative, systems-based approaches across organizational boundaries [13]. These methods must transform legacy infrastructure, assess long-term behaviors over a complete 50–100 year lifecycle, and anticipate interde-pendencies across traditional sector-based boundaries while considering both technical and social factors and improving
SpringSim-ANSS 2016 April 3–6 Pasadena, CA, USA c
2016 Society for Modeling & Simulation International (SCS)
understanding and communication between stakeholders and decision-makers [5].
This paper promotes simulation to improve communication during planning activities. However, it also realizes simula-tion alone is not sufficient to address the socio-political com-plexities in infrastructure systems. This research proposes in-teroperable simulation gamingas an interactive design activ-ity with three features: 1) simulation to communicate tech-nical factors, 2) interoperability to accommodate decentral-ized authority, and 3) humans as interactive players to com-municate non-technical factors and ultimately build knowl-edge and experience. The Sustainable Infrastructure Planning Game (SIPG) is a prototype tool and collaborative design ac-tivity for a fictional scenario. Results of a human subjects study highlight the role of integrated and synchronous design to achieve common objectives.
2. COLLABORATIVE DESIGN
Modeling and simulation is a key activity for infrastructure planning with recent focus on cross-sector interactions and interdependency. Ouyang [14] describes four key challenges: sharing models and data across organizational boundaries, broad consideration of both hard (electricity, water, commu-nications, etc.) and soft (banking, commercial facilities, etc.) infrastructure, co-simulation to exchange mutual dependen-cies, and model validation for novel or unexpected scenarios. Concurrent engineering (CE) demonstrates how computa-tional tools can be incorporated in a design process to share models and data. It performs design activities in parallel, rather than in sequence, to decrease development time and increase product quality by reducing feedback delays be-tween designers [16]. CE is most prevalent in domains with tightly coupled subsystems and strict requirements—such as aerospace—and usually prescribes a central role, the systems engineer, to adjudicate subsystem tradeoffs for system-level objectives.
More broadly, collaborative engineering facilitates technical agreements among a team with a common goal and limited re-sources or conflicting interests [10]. It emphasizes situations where information sharing barriers may exist and a common decision is not fixed by a central actor. Lu et al. [10] pro-pose a four-step hypothesis of engineering collaboration via negotiation (ECN): manage social interactions to exchange perspectives, construct a common understanding of the prob-lem, discuss group preferences, and finally attain agreement.
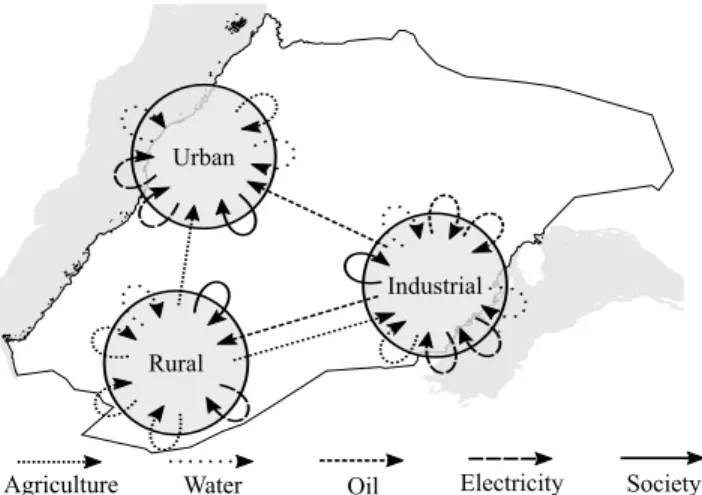
Agriculture Water Society Energy Oil Electricity Food Water Oil Electricity Currency
Figure 1. The design scenario includes resource flows between society and agriculture, water, and energy sectors.
Simulation gaming (SG) develops interactive rule-based en-vironments to promote individual and social learning [11]. Its origins in wargaming highlight complex interplay among allies and adversaries which incorporate wider social factors than typically considered in CE. SG has been applied to nu-merous infrastructure including energy markets [9], multi-use rail [12], and sea ports [1] and broader topics such as sus-tainable development [7]. However, most existing games are rigidly tailored to a specific problem or scenario and require a long development time to implement software components [1], i.e. they are not design tools which could support real decision-making activities.
This work combines features of CE and SG in infrastructure simulation as interoperable simulation gaming. The goal is not to produce a simulation game as a standalone artifact but rather mature a collaborative design process where a group collectively builds an interactive simulation model [17]. A technical layer defines interoperable simulation models to ac-commodate distributed authority while a social layer includes the design activity as an integrated environment to facilitate communication and mutual understanding. The following sections describe this concept in greater detail through the SIPG prototype and a preliminary design study.
3. SIPG IMPLEMENTATION
This section summarizes past work [2] to describe the imple-mentation of SIPG as a prototype design tool.
3.1 Design Scenario
While fundamental concepts in SIPG are generalizable to broader infrastructure planning activities, this section de-scribes a particular design scenario for Idas Abara, a fictional desert nation based on contextual features of Saudi Arabia between 1950–2010. This scenario considers a retrospective 30-year planning horizon starting in 1980. It includes player roles for agriculture, water, and energy (oil and electricity) sectors and a non-player role for all other societal activities with resource flows in Figure 1. Table 1 describes individual and collective objectives as quantifiable attributes.
The agriculture role controls crop fields for domestic food production and transportation links between regions.
Re-Agriculture Water Energy Domestic Food* Aquifer Lifetime* Oil Lifetime* Net Revenue* Net Revenue* Net Revenue*
Budget Alloc. Budget Alloc. Budget Alloc.
*Also part of national objective
Table 1. SIPG role objectives
gional crops require water for irrigation and are constrained by arable land area and workers as a fraction of population. Regions export surplus food for a profit and import to meet deficits. Local objectives maximize domestic supply fraction as food security, agriculture sector net revenue as financial security, and capital budget allocation as internal power. The water role controls desalination plants and maintains vis-ibility of aquifer stocks as a mostly non-renewable water source. Regions lift water from aquifers to meet deficits in desalination supply and import at great expense if aquifers become depleted. Both desalination and lifting require elec-tricity. Local objectives maximize expected aquifer lifetime as water security, water sector net revenue as financial secu-rity, and capital budget allocation as internal power.
The energy role controls oil wells and pipelines to produce and transport oil, maintains visibility of oil reservoir stocks, and controls power plants for thermal or solar electricity gen-eration. Oil production and pumping requires electricity and thermal electricity generation requires oil. Regions export surplus oil for profit, import oil to meet supply deficits, and use direct (low-efficiency) thermal generation to meet elec-tricity deficits. Local objectives maximize expected reservoir lifetime as oil security, energy sector net revenue as financial security, and capital budget allocation as internal power. The societal role consumes food, water, oil, and electricity as a function of population and accumulates currency as net revenue from infrastructure. Both population and per-capita consumption grow over the planning horizon. A fixed annual budget limit constrains capital expenditures for new infras-tructure projects. National objectives include food, water, oil, and financial security as four aspects of sustainability. Design tensions arise from conflicting objectives among sec-tors. For example, food security promotes domestic crops which increase water consumption for irrigation. Meanwhile, rapid societal electricity demand growth increases domestic oil consumption via thermal generation and decreases ex-port revenue. Desalination plants provide a renewable but energy-intensive and cost-subsidized source of water and so-lar plants provide renewable electricity; however, both com-pete for large budget allocations to cover high capital ex-penses. Players must balance individual and national objec-tives to develop a sustainable infrastructure plan.
3.2 Modeling Framework
SIPG uses a generalizable framework for interoperability among constituent simulation models. The Infrastructure System-of-Systems (ISoS) modeling framework defines con-textual, structural, and behavioral templates common to all infrastructure systems [4].
Urban
Rural
Industrial
Agriculture Water Oil Electricity Society
Figure 2. SIPG defines Industrial, Urban, and Rural regions graph nodes and infrastructure elements as graph edges.
Contextual templates define units of spatial and temporal ag-gregation and available resource types. SIPG uses three ge-ographic regions for Industrial, Urban, and Rural nodes in Figure 2. The Industrial and Urban nodes access seawater, the Industrial node contains oil reservoirs, and the Rural node has plentiful arable land. Time steps are set to ∆t = 1 year to aggregate annual resource flows with γ = 4 iterative periods to resolve cyclic dependencies. Primary resource types com-mon to all sectors include food, water, oil, electricity, and cur-rency. Secondary resource types within sectors include arable land, agricultural workers, underground water aquifers, sea-water, underground oil reservoirs, and population.
Structural templates define infrastructure elements as graph edges at or between nodes as shown in Figure 2 for a no-tional set of elements. For example, the oil element between Industrial and Rural nodes may represent a pipeline and the electricity element at the Rural node may represent a thermal power plant. Table 2 lists available elements in SIPG. Each sector contains a system-level element to aggregate attributes from unmanaged infrastructure such as natural resources. Behavioral templates define functional capabilities of each infrastructure element to transform, transport, store, or ex-change resources. Transforming consumes inputs to produce outputs at a fixed location. Transporting consumes inputs at one node to produce outputs at another. Storing puts re-sources inside an element for later retrieval. Exchanging sends and receives resources across system boundaries. Table 2 shows behaviors for SIPG elements. System-level elements aggregate functions for importing and exporting, storing nat-ural resources, and secondary production methods for lifting aquifer water and electricity generation.
3.3 Model Implementation
The SIPG model implementation defines element attributes and a baseline set of legacy infrastructure. Social system models fit population growth and per-capita demands to his-torical data for Saudi Arabia. Other infrastructure elements base physical attributes such as aquifer or oil reservoir stocks on historical estimates and process attributes such as energy intensity on typical values. All financial attributes including
Connect Initialize Advance
Reset Disconnect Complete? Reset? No Yes No Yes
Figure 3. The SIPG federate lifecycle includes Connect, Initialize, Advance, Reset, and Disconnect activities.
capital and operations expenses and import, export, and do-mestic resource prices are balanced in a fictional currency. Some elements define multiple sizes to scale attributes. Each sector must meet all resource demands using a combi-nation of infrastructure elements and its unique unconstrained source: food import, water lifting or import, oil import, and direct electricity generation. A mixed integer linear program (MILP) determines infrastructure element operational behav-iors in each time period to maximize net sector revenue. For example, solar electricity generation is preferred over thermal because it has a lower operational expense. Agriculture and oil sectors with export maximize total production while water and electricity only meet demands at minimum cost.
A baseline scenario instantiates legacy infrastructure ele-ments partially based on historical data from Saudi Arabia be-tween 1950–1980. The agriculture model includes small crop fields in each of the three regions and low-volume food trans-port from Rural to Industrial and Urban nodes. The water model includes a small desalination plant in the Industrial re-gion. The energy model includes several oil wells with signif-icant production capacity at the Industrial node and pipelines to the Urban and Rural regions.
3.4 Simulation Implementation
The SIPG simulation is implemented in the Java program-ming language with the High Level Architecture (HLA) for interoperability [3]. Resource exchanges represent the key in-terface between system models. The federation object model in Table 3 defines object classes for system elements and sup-ply/demand attributes for resource exchanges.
A lifecycle diagram in Figure 3 shows required activities of each federate. Briefly, the Connect activity connects to the runtime infrastructure (RTI) and creates and joins a federation execution. The Initialize activity configures asynchronous message delivery, time constrained and regulating behaviors, publishes and subscribes object classes, registers object in-stances, updates and reflects attribute values, saves the initial federation state, and advances to the initial time. The Ad-vance activity updates and reflects attributes to adAd-vance time by γ increments of ∆t/γ. The Reset activity restores initial federation state. Finally, the Disconnect activity resigns and destroys the federation execution and disconnects from the RTI.
Exactly one instance of each object class (i.e. system ele-ment) must be registered at each region. For example, the water federate registers WaterSystem elements at Industrial, Urban, and Rural nodes and a SocialSystem element at the
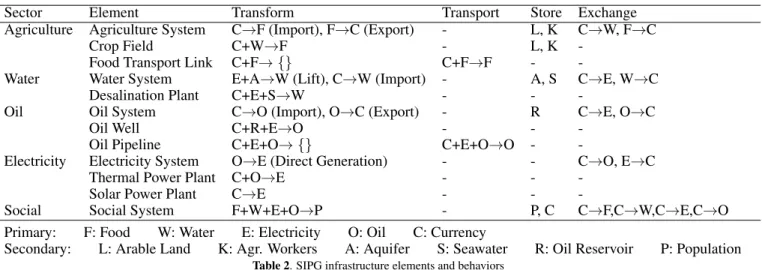
Sector Element Transform Transport Store Exchange Agriculture Agriculture System C→F (Import), F→C (Export) - L, K C→W, F→C
Crop Field C+W→F - L, K
-Food Transport Link C+F→ {} C+F→F -
-Water Water System E+A→W (Lift), C→W (Import) - A, S C→E, W→C
Desalination Plant C+E+S→W - -
-Oil Oil System C→O (Import), O→C (Export) - R C→E, O→C
Oil Well C+R+E→O - -
-Oil Pipeline C+E+O→ {} C+E+O→O -
-Electricity Electricity System O→E (Direct Generation) - - C→O, E→C
Thermal Power Plant C+O→E - -
-Solar Power Plant C→E - -
-Social Social System F+W+E+O→P - P, C C→F,C→W,C→E,C→O
Primary: F: Food W: Water E: Electricity O: Oil C: Currency
Secondary: L: Arable Land K: Agr. Workers A: Aquifer S: Seawater R: Oil Reservoir P: Population Table 2. SIPG infrastructure elements and behaviors
Object Class Attribute Type
Element Name string
| Location string
| NetRevenue float
` AgricultureSystem WaterDemand float
| SocialFoodSupply float
` WaterSystem ElectDemand float | AgricultureWaterSupply float
| SocialWaterSupply float
` ElectSystem OilDemand float
| WaterElectSupply float
| SocialElectSupply float
` OilSystem ElectDemand float
| ElectOilSupply float
| SocialOilSupply float
` SocialSystem Population float FoodDemand float WaterDemand float ElectDemand float OilDemand float string: HLAunicodeString float: HLAfloat64BE
Table 3. SIPG federation object model
Urban node—other federates register the two remaining So-cialSystem elements. Federation time is measured in 1/1000 years (milliyears) represented by a 64-bit integer type. Fed-erates initialize to year 1950 and advance until year 2010 to simulate 30 years of fixed past and 30 years of future. Federation infrastructure includes the commercial Pitch pRTI [15] HLA RTI implementation, a Dell PowerEdge T110 II server to host the central RTI component, and Dell Latitude D640 laptops connected to a wireless local area network to host each of the three federates. A full simulation execution requires about 10–20 seconds which includes substantial time to update plotting graphics.
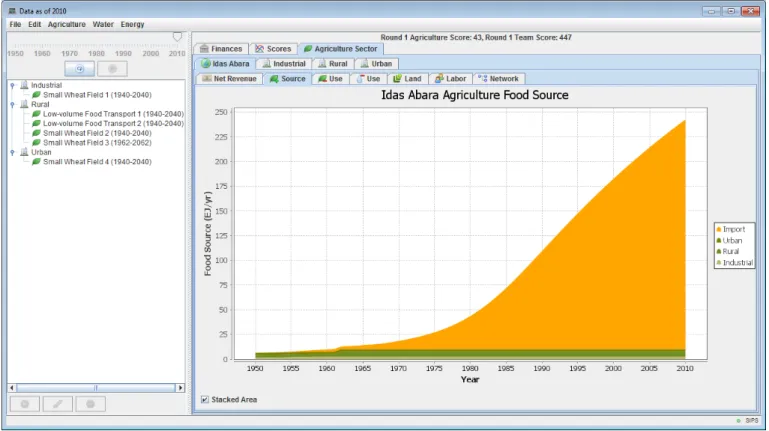
3.5 Graphical User Interface
Users interact with SIPG via a graphical user interface (GUI) implemented with the Java Swing toolkit. The screen cap-ture in Figure 4 shows panels to input infrastruccap-ture elements, control a simulation execution, and visualize outputs. The input panel lists infrastructure elements by region and operational period. The baseline scenario in Figure 4 shows a “Small Wheat Field” in the Industrial region operating be-tween 1940–2040. Buttons below add, modify, or remove elements instantiated after 1980. Adding infrastructure opens a menu to choose a type from Table 2 and overrides param-eters such as the location or operational lifetime. Modifying infrastructure changes locations or operational lifetimes and removing deletes an element from the simulation.
Execution controls initialize and run a simulation. The ini-tialize button (left) performs the Iniini-tialize or Reset activity in Figure 3 to initialize the federate. All federates must initial-ize before the run button (right) becomes available. The run button iteratively performs Advance activity in Figure 3 until the simulation execution is complete.
The output panel (right) visualizes objective metrics and re-source flows. Tabs in Figure 4 include Finances for national revenue and budget constraints, Scores for individual and na-tional objectives, and Agriculture Sector for sector-specific information. Many output visualizations such as the food source chart in Figure 4 optionally aggregate data at the
na-Figure 4. The GUI includes infrastructure inputs (left), execution controls (upper left), and output visualizations (right).
tional level (Idas Abara), or filter data to individual regions (Industrial, Rural, Urban). Sector-specific outputs include a time series of expenses and revenue, source of resources pro-duced, use of resources consumed, natural resource stocks (Land and Labor in Figure 4), and a network visualization of resource flow.
3.6 Limitations
Several simplifying assumptions limit the validity of SIPG as a design tool. Although partially based on the context of Saudi Arabia, models in SIPG do not claim to represent real infrastructure systems. Some attributes are reasonably based on historical data or typical performance but others, partic-ularly financial attributes, are purposefully fictionalized. In some cases, no data is immediately available and in other cases, realistic attributes require a more detailed model. Se-lected spatial and temporal units—regional nodes and annual time steps—prescribe particular scales for infrastructure ele-ments which may not align with available data.
More broadly, purposeful fictionalization may provide other benefits when interacting with users for testing purposes. The Expertise Reversal Effect [6] is a cognitive phenomenon where experts perform tasks worse than novice counterparts because their expertise forms a barrier to situations with un-familiar units of information. Purposeful fictionalization as Idas Abara, rather than Saudi Arabia, may facilitate study by distancing the activity from prior knowledge.
Other features of SIPG limit generalization as a prototype. It only considers a single deterministic scenario where societal
demands are exogenous from infrastructure activities. There is no time discounting or inflation, no technology advance-ment or innovation, and all capital costs are fixed throughout the scenario. Furthermore, resource prices are fixed and there is no supply or demand elasticity or market forces and an un-constrained resource source in each sector prevents supply deficits. Most infrastructure elements have simple operations models with linear relationships between inputs and outputs aggregated to annual periods.
The prescribed SIPG design objectives also present a practi-cal limitation. Individual and national metrics capture some aspects of sustainability but focus on economic factors and largely ignore environmental and social equity. Additionally, players individually decide how to weigh their decisions be-tween individual and national objectives, or even pursue some other unstated objective. These features add sources of vari-ance and limit comparison of outcomes between individuals. Of the above limitations, some can be resolved in future work with additional modeling effort. However, others relate to a model boundary encroaching on broader socio-economic the-ory, policy decisions, and societal objectives. A simulation model grounded in technical details may help mitigate risk of an unbounded model scope while leaving non-technical is-sues open for discussion during the design activity.
4. COLLABORATIVE DESIGN STUDY
SIPG is primarily a prototype to demonstrate feasibility of interoperable simulation gaming but also serves as a platform to study design activities. This section summarizes results of
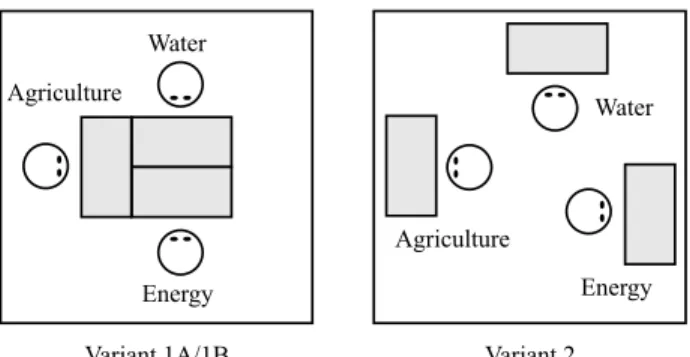
Energy Water Agriculture Energy Water Agriculture
Variant 1A/1B Variant 2
Figure 5. Variant 1A/1B has an integrated station and synchronous tools (left) and Variant 2 has isolated stations and asynchronous tools (right).
a preliminary experiment to study factors leading to effective design for collective objectives.
4.1 Research Questions
Broader research objectives seek to identify what features of a tool such as SIPG and its surrounding design activity lead to more effective collaborative decisions. The national objec-tive in Table 1 with equal weighting of its four attributes op-erationalizes design effectiveness within the SIPG scenario. Rather than assessing effects of tightly-controlled variables on outcomes, however, this study takes a theory-oriented evaluation approach [8] to build logical connections between controlled input variables, process variables observed during a design session, and outcome variables at the end of a design session. This approach addresses a deeper question of why certain features affect design effectiveness.
This research contrasts the integrated and synchronous design process enabled by SIPG with a more traditional one charac-terized by isolated and asynchronous activities. The under-lying hypothesis anticipates an integrated and synchronous design environment leads to more effective outcomes. In par-ticular, this research emphasizes the role of technical data ex-change during design. More frequent data exex-change is anal-ogous to shorter feedback delays as in CE and is a form of social interaction in ECN which helps construct common un-derstanding as in SG.
4.2 Experimental Method
Fifteen ad-hoc teams of three subjects participated in this study under an IRB-approved protocol. Volunteer partici-pants were recruited from a convenience sample of peers in graduate programs at MIT and were not paid for their efforts. Each group is assigned to one of three variants (1A, 1B, or 2) in Figure 5. Variants 1A and 1B have an integrated de-sign station at a common table with synchronous tools using the HLA where all participants must run a simulation execu-tion at the same time. Variant 2 has isolated design staexecu-tions with an asynchronous tool which uses a shared network direc-tory to exchange input/output data files allowing participants to run simulation executions independently from one another. The form of national objective metric slightly varies across groups: Variant 1A receives a quantitative metric while Vari-ants 1B and 2 receive a qualitative description.
Group Variant N J r 1 1A 5 344.8 15 2 1A 6 497.9 5 3 1A 10 445.1 11 4 1A 11 517.1 1 5 1A 9 486.9 6 6 1B 12 509.9 3 7 1B 13 484.4 7 8 1B 5 466.9 9 9 1B 7 438.5 12 10 1B 9 505.8 4 11 2 7 514.2 2 12 2 3 349.7 14 13 2 5 449.3 10 14 2 4 467.3 8 15 2 7 349.9 13
Table 4. Design study results for data exchange count N , final national objective metric J , and outcome rank r by group and tool variant.
Each session follows a standard procedure. A 15-minute scripted presentation introduces the design scenario and a 15-minute guided tutorial orients subjects to the software tool. Next, subjects enter a 60-minute timed design period to de-velop and iterate upon the 30-year infrastructure plan. Sub-jects may ask clarifying questions during the session and freely move about the room, but may not rearrange the design stations. Software logs record infrastructure decisions before each simulation execution and individual and collective ob-jective metrics after each simulation execution. Variants 1A and 1B count data exchanges as simulation executions and Variant 2 counts data exchanges as input/output uploads by all three subjects. After completion, a facilitator debriefs the design scenario.
4.3 Results
Table 4 shows results for data exchange count N and final na-tional objective metric J measuring the group’s effectiveness to meet food, water, oil, and financial security goals in the SIPG scenario. Note J is ordinal and requires non-parametric statistical tests based on rank r. For example, rank r = 1 is assigned to the highest-performing group (group 4 with J = 517.1) while rank r = 15 is assigned to the lowest-performing group (group 1 with J = 344.8).
A first test investigates if there is significant variation in out-comes across the three tool variants. A Kruskal-Wallis test does not show significant differences in outcome rank be-tween variants 1A, 1B, and 2 (χ2(2) = 0.78, p = 0.68),
suggesting the three variants produce similar outcomes. Given the limited number of samples and noisy data, process-oriented variables such as data exchange count uncover more interesting results. Figure 6 shows a scatter plot of national objective rank and data exchange count for the 15 groups. Independent of tool variant, these data produce a significant Spearman correlation (ρ = −0.544, p = 0.036) which indi-cates more frequent data exchange is correlated with lower ranks (i.e. more effective outcomes).
0
2
4
6
8
10
12
14
16
Data Exchange Count
0
2
4
6
8
10
12
14
16
National Objective Rank
Var. 1A
Var. 1B
Var. 2
Figure 6. Plot of outcome rank and data exchange count showing a negative correlation between data exchange count and outcome rank.
Variant 1
Variant 2
2
4
6
8
10
12
14
Data Exchange Count
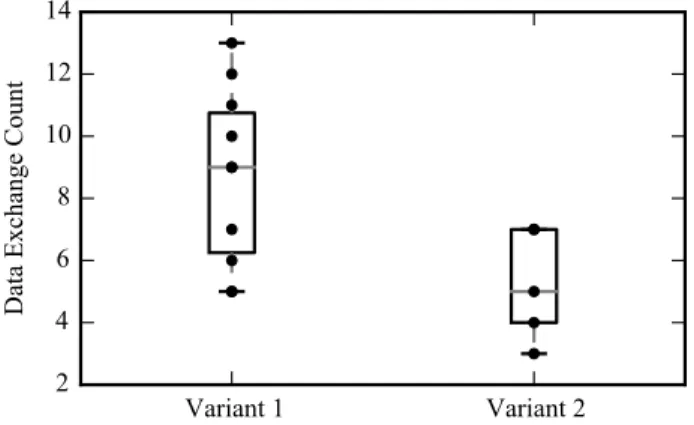
Figure 7. Box plot of data exchange count by tool variant showing significant differences between the two variants.
Figure 7 shows a box plot of data exchange count by tool variant. Note Variants 1A and 1B have been aggregated. A Mann-Whitney-Wilcoxson rank sum test shows a significant difference in exchange count among the two tools (t(13) = −2.47, p = 0.028) which suggests Variant 1 enables more frequent data exchange than Variant 2.
4.4 DISCUSSION
Few direct conclusions link input variables of the three vari-ants to outcome performance due to the limited sample size and high variance. However, intermediate process variables such as data exchange count describe how design activities in-fluence outcomes as supported by tool variants. Results show effective designs are correlated with data exchange, suggest-ing tools or activities which facilitate data exchange also sup-port more effective design. Results also show the integrated, synchronous variant yields more frequent data exchange. Fu-ture work is required to distinguish effects of physical prox-imity and synchronous tools; however, both features are de-sired in interoperable simulation gaming.
Many other factors were not considered in this study. No analysis of verbal communication, another significant source of information exchange, was conducted. Additionally, the
experimental method does not prescribe a design process or organizational structure for participants to follow.
There are a few fundamental limitations to this type of exper-iment. First, it is limited to relatively small sample sizes due to the number of participants required to form teams. Further-more, there will always be a large variance in individual and group capability in complex design scenarios such as SIPG. While future research may consider simpler design scenarios for repeated measures of a fixed team, this approach may suf-fer from a lack of generalization to real infrastructure design. At the same time, more realistic scenarios, for example with domain experts, further restricts the sample size requiring use of more qualitative research methods.
5. CONCLUSION
This paper describes SIPG as a prototype tool for infrastruc-ture systems design. It uses the ISoS modeling framework to define a generalizable template for sector-specific models and the HLA for interoperability. This structure allows authorities to retain control over models and data while participating in design activities. SIPG provides two information exchange mechanisms: technical exchange in the integrated simulation model and non-technical exchange in the integrated design environment. A preliminary study shows technical data ex-change supported by integrated, synchronous tools such as SIPG is correlated with effective designs.
There are several directions for future work. First, new mod-eling efforts supported by constituent organizations can de-velop validated models of real infrastructure systems. These tasks must carefully identify a model boundary relevant to the design task. While SIPG considers strategic planning exer-cises with a horizon of 10-30 years, similar approaches could also consider shorter operational planning exercises with cor-responding increases in model fidelity.
Other development effort could improve usability of SIPG as a prototype design tool. The current implementation is limited to only consider one scenario at a time without an ability to compare design alternatives. Future work could identify ways to visualize alternatives in a design session and computationally-efficient navigation of a wider tradespace. Finally, a future set of design experiments using SIPG or a derivative activity could study the factors leading to effec-tive collaboraeffec-tive design in much greater detail. Future work must formulate, operationalize, and evaluate theories such as the ECN hypothesis in an experimental environment to better understand the role of tools. Future studies may control other aspects of the design process, for example to prescribe par-ticular activities or organizational structures. Application of tools to real-world problems with domain experts and practi-tioners can also be studied with rigorous qualitative methods.
ACKNOWLEDGMENTS
This work was completed while the first author was at Mas-sachusetts Institute of Technology under a U.S. Department of Defense (DoD) National Defense Science and Engineer-ing Graduate (NDSEG) Fellowship and with equipment sup-port from the Center for Complex Engineering Systems at
King Abdulaziz City for Science and Technology and Mas-sachusetts Institute of Technology (CCES). Thanks to the many pilot testers and participants who volunteered their time for the SIPG collaborative design study.
REFERENCES
1. Bekebrede, G. Experiencing Complexity: A gaming approach for understanding infrastructure systems. PhD thesis, Technische Universiteit Delft, 2010.
2. Grogan, P. T. Interoperable Simulation Gaming for Strategic Infrastructure Systems Design. PhD thesis, Massachusetts Institute of Technology, 2014.
3. Grogan, P. T., and de Weck, O. L. Infrastructure system simulation interoperability using the High-Level Architecture. IEEE Systems Journal (2015). Early access at http://dx.doi.org/10.1109/JSYST.2015.2457433. 4. Grogan, P. T., and de Weck, O. L. The ISoS modeling
framework for infrastructure systems simulation. IEEE Systems Journal 9, 4 (2015), 1139–1150.
5. Hansman, R. J., Magee, C., de Neufville, R., Robins, R., and Roos, D. Research agenda for an integrated
approach to infrastructure planning, design and management. International Journal of Critical Infrastructures 2, 2 (2006), 146–159.
6. Kalyuga, S. Expertise reversal effect and its implications for learner-tailored instruction. Educational Psychology Review 19, 4 (2007), 509–539.
7. Katsaliaki, K., and Mustafee, N. Edutainment for sustainable development: A survey of games in the field. Simulation & Gaming 46, 6 (2015), 647–672.
8. Kriz, W. C., and Hense, J. U. Theory-oriented evaluation for the design of and research in gaming and simulation. Simulation & Gaming 37, 2 (2006), 268–283.
9. Kuit, M., Mayer, I. S., and de Jong, M. The
INFRASTRATEGO game: An evaluation of strategic behavior and regulatory regimes in a liberalizing electricity market. Simulation & Gaming 36, 1 (2005), 58–74.
10. Lu, S. C.-Y., Elmaraghy, W., Schuh, G., and Wilhelm, R. A scientific foundation of collaborative engineering. 605–634.
11. Mayer, I. S. The gaming of policy and the politics of gaming: A review. Simulation & Gaming 40, 6 (2009), 825–862.
12. Meijer, S. A., Mayer, I. S., van Luipen, J., and Weitenberg, N. Gaming rail cargo management: Exploring and validating alternative modes of organization. Simulation & Gaming 43, 1 (2011), 85–101.
13. National Research Council. Sustainable Critical Infrastructure Systems: A Framework for Meeting 21st Century Imperatives. The National Academies Press, Washington, DC, 2009.
14. Ouyang, M. Review on modeling and simulation of interdependent critical infrastructure systems. Reliability Engineering and System Safety 121, 1 (2014), 43–60. 15. Pitch Technologies AB. Pitch pRTI version 5.0.0, 2014. 16. Sohlenius, G. Concurrent engineering. CIRP
Annals–Manufacturing Technology 41, 2 (1992), 645–655.
17. Vennix, J. A. Group model-building: tackling messy problems. System Dynamics Review 15, 4 (1999), 379–401.