COMPUTATIONAL FLUID DYNAMICS FOR
HIGH PERFORMANCE STRUCTURAL FACILITIES
By
YI-MEI MARIA CHOW
Bachelor of Science in Civil Engineering June 1996
National Taiwan University Taipei, Taiwan, Republic of China
Submitted to the Department of Civil and Environmental Engineering In Partial Fulfillment of the Requirements for the Degree of
Master of Engineering in Civil and Environmental Engineering at the
Massachusetts Institute of Technology
June 1998
Copyright @ 1998 Massachusetts Institute of Technology All Right Reserved
The author hereby grants to MIT permission to reproduce and to distribute publicly paper and electronic copies of this thesis document in whole or in part.
Signature of Author
Yi-Mei Maria Chow May 22, 1998
Certified by
Jerome J. Connor Professor, Department of Civil and Environmental Engineering Thesis Supervisor
Approved by
Joseph M. Sussman Chairman, Departmental Committee on Graduate Studies
'UN
O2'398
i %'2"Computational Fluid Dynamics for High Performance Structural Facilities
COMPUTATIONAL FLUID DYNAMICS FOR
HIGH PERFORMANCE STRUCTURAL FACILITIES
ByYI-MEI MARIA CHOW
Submitted to the Department of Civil and Environmental Engineering on May 22 1998
In Partial Fulfillment of the Requirement for the Degree of Master of Engineering in Civil and Environmental Engineering
ABSTRACT
For the buildings in the next century, the performance levels with respect to both environmental and mechanical requirements will be of major concern. Civil engineers have developed solutions to improve the serviceability of structural facilities. However, there are still unanswered questions regarding fluid-structural interaction in the interior and exterior regions. For example, engineers still have difficulty in conceptualizing impact of air flow on the building, particularly how the ventilation system works within the entire building and how wind load affects the exterior part of the structural fagade.
Computational Fluid Dynamics provides an alternative approach for predicting indoor and outdoor air flow. Although CFD has been applied in aerospace and mechanical engineering for the past two decades, it was introduced in civil and environmental engineering only in the 1990's. With recent advances in computer hardware and user interfaces, complicated fluid problems such as natural and force convection in an office chamber and wind channel effects on a large building complex can now be solved in a realistic time. Environmental air quality and contaminant spreading can also be studied.
Also considered is advanced wind engineering, especially wind tunnel testing of wind load and flow speed prediction. Wind load impact on bridge and building structures is discussed and illustrated with several case studies. Meanwhile, two CFD simulations of indoor environment modeling and wind load effect on a building complex are presented in the form of visualized images together with output ASCII code.
Finally, the capability of computational fluid dynamics applications on high performance structure is discussed by giving several examples in the last chapter. The overall methodology of using CFD technology to evaluate and improve the building and environmental performance is presented with a schematic flow chart.
Thesis Supervisor: Jerome J. Connor
Title: Professor of Civil and Environmental Engineering
Computational Fluid Dynamics for High Performance Structural Facilities
ACKNOWLEDGEMENTS
I would like to express my gratitude to my thesis advisor Prof. Jerome J. Connor and Charles H. Helliwell for their guidance and continuous encouragement during my graduate study at MIT, and for giving me great help while doing the group project of the Conceptual Design of new building for Department of Civil and Environmental Engineering. I would also like to thank Professor Qing Yan Chen from Building Technology program in Department of Architecture. Without his kindness and enthusiastic support, I would not be able to finish the simulation part of Computational Fluid Dynamics Model.
Meanwhile, wholeheartedly thanks for Chun-Yi Wang for his help with schoolwork. Especially, I appreciate my classmate Lisa Saldano's encouragement and help in revising my thesis document. Special thanks to Simonetta, Tim and Bernard for sharing knowledge about "Smart Technology" while doing the M.Eng Project. Thanks to all those friends at MIT who helped me with this project, and made work on this thesis challenging and worthy.
To my family and friends in Taiwan, you all give me great support. Special thank for my undergrad thesis advisor Prof. C.K.Lee who came to visit me in Boston before this thesis was due, and brought me faith to overcome all difficulties in the past and in the future.
Computational Fluid Dynamics for High Performance Structural Facilities
TABLE OF CONTENTS
A BSTRA C T ... ... 2
ACKNOW LEDGEM ENTS ... 3
LIST OF FIGURES ... LIST OF TABLES ... 6
CHAPTER I: INTRODUCTION ... 8
1.1 PRO BLEM D ESCRIPTIO N ... ... 9
1.2 PR O B LEM SO LV IN G ... ... 9
1.3 T H E SIS O U T L IN E ... ... 10
CHAPTER II: REVIEW OF COMPUTAITONAL FLUID MECHANICS ... 11
2.1 THEORETICAL BACKGROUND ... ... 12
2 .1.1 F low E q u a tion s ... ... ... 12
2.1.2 Computational Fluid Dynamics... ... 14
2.1.3 The History and Literature Survey of CFD ... ... 16
2.2 M A JO R A PPLIC A TIO N S ... ... 16
2.2.1 How CFD Applies to Civil Engineering ... 16
2.3 HOW DOES CFD MAKE PREDICTIONS ... ... 17
2.3.1 Can CFD be Trusted . ... ... 17
2.3.2 Where CHAM and PHOENICS Serve for CFD... 17
2.4 PERSONAL COMPUTER TO PARALLEL PROCESSOR... 18
2.4.1 The Benefits of Parallel CFD ... 18
2.4.2 Platforms ... 19
2.5 WHAT PHOENICS DOES ... 19
2.5.1 How the Problem Is Defined ... ... 20
2.5.2 How PHOENICS Make the Predictions ... ... ... 20
2.5.3 How the Results Are Displayed ... ... ... ... 21
2.5.4 H ardw are... ... 2 1 CHAPTER III: INDOOR ENVIRONMENT MODELING ... 23
3.1 CFD INVESTIGATION OF VENTILATION SYSTEM ... 24
3.2 EXAMPLES OF HIGH PERFORMANCE STRUCTURAL FACILITIES... 24
3.2.1 Semiconductor Micro-fabrication Clean Room... 24
3.2.2 Fundamental D esign Criteria for Clean room ... 28
3.3 ACADEMIC BUILDING DESIGN REQUIREMENT... ... 31
3.3.1 Office M odule ... ... 31
3.3.2 Classroom ... ... ... ... 31
3.3.3 Design Requirement of Lab Facilities ... 32
3.4 ULTIMATE DESIGN OF STRUCTURAL PROFILE ... ... 32
3.4.1 Overall Conceptual D esign ... 32
3.4.2 Intelligent M aterials ... 34
3.4.3 Smart Structural Profile ... 35
3.5 VIRTUAL PERSONAL ENVIRONMENTAL CONTROL ... ... 36
3.6 CFD SIMULATION FOR A SIMPLE CASE STUDY... 39
3.6.1 Objective... ... 39
3.6.2 P roblem D efinition ... 39
Computational Fluid Dynamics for High Performance Structural Facilities
CHAPTER IV: OUTDOOR WIND FLOW ... ... 45
4.1. SOME FACTS ABOUT AIR FLOW... ... 46
4.2 PREDICTION OF WIND LOAD EFFECT TO BUILDING STRUCTURE... . 47
4.2.1 Investigation of the Computed wind Flow Field... ... 48
4.2.2 Applied Solution Methodology ... 48
4.2.3 Computed Wind Flow Field ... 49
4.3 M O D EL V A LID A T IO N ... 55
4.3.1 Application of the Model for a Design Case study ... ... 60
4.3.2 Modeled Configuration for the Case Study ... ... 60
4.3.3 Animated Turbulent Air Flow Fields ... ... 62
4.4 SUMMARY AND REMARKS ... ... 65
4.5 NOM ENCLATURE ... ... ... 68
CHAPTER V: WIND ENGINEERING... ... 69
5.1 W IN D LOA D ... ... 70
5.2 ADVANCED WIND ENGINEERING ... ... 72
5.2.1 Model Scale Wind Tunnel Testing... ... 72
5.2.2 Measurement and Prediction ofIndoor Ventilation ... 77
5.3 AIRFLOW VISUALIZATION IN WIND TUNNELS ... ... 77
5.3.1 Site Wind Speed and Loading Predictions... 77
5.3.2 Wind-Driven Rain characteristics on Building Envelope... 78
5.4 ADVANCED WIND LOADING STUDIES... 79
5.4.1 Pressure-Equalization Study on Curtain Walls ... .. ... 79
5.4.2 Durability of Composite Wall Panels under Differential Movements ... 80
5.4.3 Accelerated Tropical Weathering Test on Construction Materials ... 81
5.4.4 Aero-elastic Response of Bridge Decks ... 81
5.5 WIND LOAD ESTIMATION AROUND BUILDING COMPLEX ... 83
5.5.1 Sim ulation Procedure ... 84
5.5.2 D iscussion ... ... 8 5 5.5.3 Summ ary and D iscussion... ... 85
CHAPTER VI: CONCLUSIONS AND FUTURE OUTLOOK ... ... 96
6.1 CAPABILITY OF COMPUTATIONAL FLUID DYNAMICS ... ... 97
6.2 BUILDING AND ENVIRONMENTAL PERFORMANCE ANALYSIS ... 98
6.3 APPLICATION IN THE BUILT ENVIRONMENT ... 98
6.4 CONCLUSION... ... ... ... ... ... 100
APPENDICES APPENDIX A: INPUT DATA FILE OF CFD SIMULATION RESULT ... 107
APPENDIX B: OUTPUT ASCII CODE FILE OF THE CFD SIMULATION RESULT ... 109
Computational Fluid Dynamics for High Performance Structural Facilities
LIST OF FIGURES
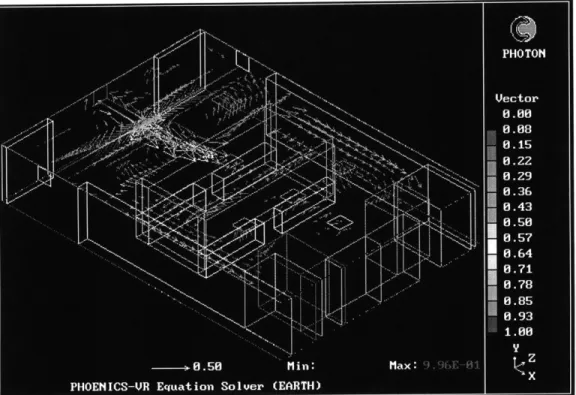
FIGURE 1: THE APPLICATION OF CFD ON INDOOR ENVIRONMENT MODELING. ... 22
FIGURE 2: SEMICONDUCTOR CHIP PROCESSING PROCEDURE. ... ... 25
FIGURE 3: CHIP DESIGNERS IN THE DUST-FREE SEMICONDUCTOR FABRICATION CLEAN ROOM ... 26
FIGURE 4: PAD ON THE FLOOR SYSTEM... . ... ... 28
FIGURE 5: GRATED IRON FRAME PANEL FOR UNDER-FLOOR VENTILATION ... ... 29
FIGURE 6: FACILITY ARRANGEMENT OF THE BIOCHEMISTRY LAB... ... 32
FIGURE 7: CELLULAR DECKS FOR INTEGRATED FLOORING SYSTEM ... ... 33
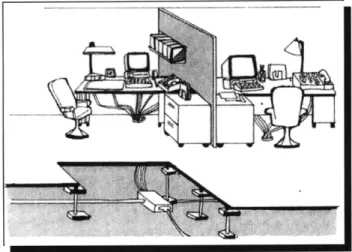
FIGURE 8: RAISED-FLOOR SLAB OF INTEGRATED CABLING SYSTEM FOR INTELLIGENT BUILDING ... 34
FIGURE 9: SMART MATERIALS FOR INTEGRATED UNDER FLOOR ACCESS SYSTEMS. ... 34
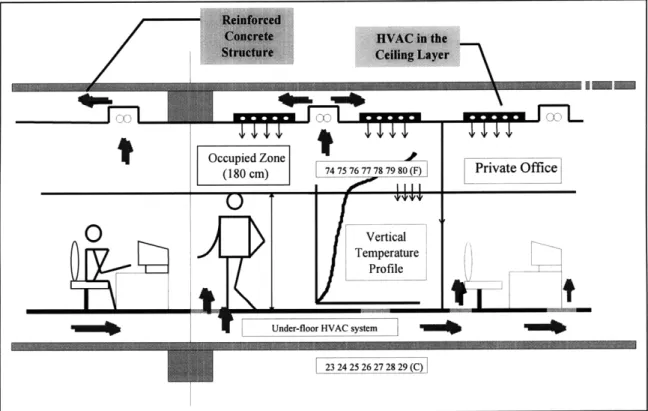
FIGURE 10: OPTIMIZATION DESIGN OF HVAC SYSTEM INTEGRATED WITH STRUCTURAL COMPONENTS... 35
FIGURE 11: VIRTUAL INDOOR ENVIRONMENT MODELING WITH SMART HVAC CONTROL ... 37
FIGURE 12: SMART HVAC CONTROL SYSTEM USING FUZZY LOGIC... 38
FIGURE 13: ROOM ARRANGEMENT AND GRID SETTING FOR THE CFD PRE-PROCESSING ... 40
FIGURE 14: FORCED VENTILATION IN THE OFFICE ROOM CHAMBER. ... 40
FIGURE 15: PRESSURE DISTRIBUTION PROFILE ON A RANDOM CROSS-SECTION. ... 41
FIGURE 16: ISO-VELOCITY SURFACE CONTOUR AT A SPECIFIC POINT... 41
FIGURE 17: TEMPERATURE DISTRIBUTION AROUND RADIATOR ... ... 42
FIGURE 18: INDOOR TEMPERATURE DISTRIBUTION WITH ADDING OF THE WINDOWS ... 42
FIGURE 19: VORTEX PHENOMENA BETWEEN FENCE AND COLUMNS. ... 43
FIGURE 20: RELATIVE NEGATIVE PRESSURE CAUSED BY NATURAL VENTILATION ... 43
FIGURE 21: FLOW VELOCITY DISTRIBUTION ON A CERTAIN CROSS-SECTION OF THE ROOM. ... 44
FIGURE 22: COMPUTED AIR FLOW AROUND A BUILDING WITH DIFFERENT GRID ARRANGEMENTS ... 49
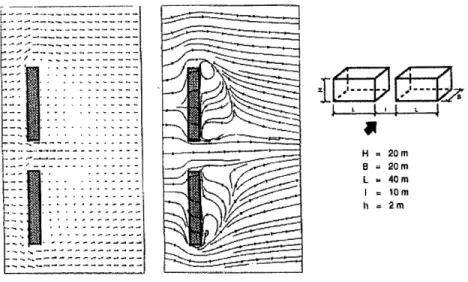
FIGURE 23: VELOCITY VECTORS AND STREAMLINE PLOTS OF AIR FLOW BETWEEN TWO BUILDINGS ... 51
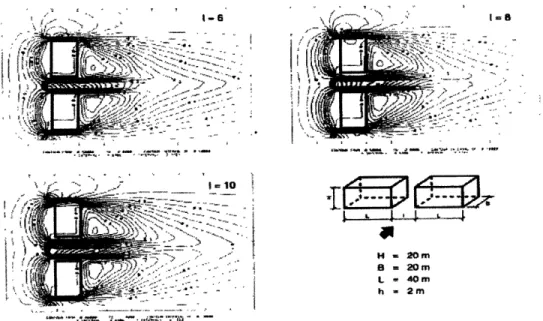
FIGURE 24: EFFECT OF PASSAGE WIDTH BETWEEN TWO BUILDINGS ON VELOCITY RATIOS ... 52
FIGURE 25: THREE DIMENSIONAL GRID ARRANGEMENT FOR NORMAL WIND FLOW IN ... 53
FIGURE 26: VELOCITY VECTORS AROUND MULTIPLE BUILDING CONFIGURATIONS FOR NORMAL WIND FLOW ... . 4
FIGURE 27: VELOCITY VECTORS AROUND MULTIPLE BUILDING CONFIGURATIONS FOR OBLIQUE WIND FLOW. ... FIGURE 28: MODEL VALIDATION IN PREDICTING THE CHANNELING EFFECT BETWEEN TWO BUILDINGS ... 57
FIGURE 29: MODEL VALIDATION IN PREDICTING THE CHANNELING EFFECT BETWEEN TWO BUILDINGS ... 57
FIGURE 30: MODEL VALIDATION IN PREDICTING THE VERTICAL FLOW VARIATION BETWEEN TWO BUILDINGS. .. 58...
.. 58
FIGURE 31: MODEL VALIDATION IN PREDICTING THE FLOW AROUND MULTIPLE BUILDING CONFIGURATIONS ( N ORM A L W IN D ). ... ... ... 59
FIGURE 32: MODEL VALIDATION IN PREDICTING THE FLOW AROUND MULTIPLE BUILDING CONFIGURATIONS (OBLIQUE WIND). ... 60
FIGURE 33: AERIAL VIEW OF THE SITE FOR THE CASE STUDY. ... ... 61
FIGURE 34: COMPUTATIONAL DOMAIN, PROXIMITY REGION AND BUILDINGS MODELED FOR THE CASE STUDY ... 6 1 FIGURE 35: PRESENTS THE W-COMPONENT VALUES AROUND BLDG 1 FOR THE NE WIND DIRECTION ... 63
FIGURE 36: ANIMATED CONTOUR IMAGES OF W COMPONENT VELOCITY - WEST WIND ... 66
FIGURE 37: ANIMATED CONTOUR IMAGES OF W COMPONENT VELOCITY - SW WIND ... 67
FIGURE 38: ANIMATED CONTOUR IMAGES OF TURBULENCE INTENSITY FOR VARIOUS WIND DIRECTIONS... 67
FIGURE 39: WIND LOAD WILL EFFECT THE DESIGN OF THE BUILDING ... ... 70
FIGURE 40: WIND-PRESSURE DISTRIBUTION OF DIFFERENT KINDS OF BUILDING SHAPES ... 71
Computational Fluid Dynamics for High Performance Structural Facilities
FIGURE 41: BUILDING COMPLEX MODEL FOR WIND TUNNEL TESTING. ... ... 72
FIGURE 42: WIND PRESSURE DISTRIBUTION ON THE BUILDING ... 74
FIGURE 43: FLOW CHART OF DATA ACQUISITION SYSTEM OF WIND PRESSURE MEASUREMENT. ... 76
FIGURE 44: GLASS CLADDING FACADE OF LOW-RISE ACADEMIC BUILDING ... 80
FIGURE 45: WIND TUNNEL TEST ARRANGEMENT OF A BRIDGE DECK MODEL ... 82
FIGURE 47: COMPARISON OF DEFLECTION OF ORDINARY BUILDING AND HIGH-RISE... 83
FIGURE 48: USER INTERFACE OF PHOENICS-A COMPUTER PACKAGE FOR COMPUTATIONAL FLUID DYNAMICS. ... ... 86
FIGURE 49: INPUT AND OUTPUT INFORMATION OF PHOENICS ... ... 86
FIGURE 50: CONTROL PANEL OF THE CFD PRE-PROCESSING ... 87
FIGURE 51: PSEUDO WIND LOAD ARRANGEMENT AND DISTRIBUTION... ... 87
FIGURE 52: GRID SETTING OF THE WIND DOMAIN AND BUILDING COMPLEX ... 88
FIGURE 53: ROUGH SIMULATION RESULT AT 11sT ITERATION TIME STEP ... ... 88
FIGURE 54: INTERMITTENT SIMULATION RESULT AT 42N D ITERATION TIME STEP. ... 89
FIGURE 55: VARIABLES SPECTRUM OF COMPLETE SIMULATION RESULT... 89
FIGURE 56: WIND TUNNEL EFFECT OF THE BUILDING COMPLEX. ... 90
FIGURE 57: WIND PRESSURE DISTRIBUTION IN THE X-DIRECTION ... 90
FIGURE 58: ISO-THERMAL CONTOUR OF THREE BUILDINGS UNDER HOT SUMMER WIND FLOW. ... 91
FIGURE 59: EQUAL-VELOCITY DISTRIBUTION PROFILE AROUND THE BUILDING COMPLEX... 91
FIGURE 60: WIND VELOCITY DISTRIBUTION IN FRONT OF A HIGH-RISE BUILDING ... 92
FIGURE 61: HORIZONTAL WIND DISTRIBUTION ON THE TOP OF THE TALL BUILDING ... 92
FIGURE 62: INCREASING THE SIZE OF THE WIND EFFECT DOMAIN ... 93
FIGURE 63: COMPLETE SIMULATION RESULT OF THE NEW CASE ... 93
FIGURE 64: ENHANCEMENT OF WIND CHANNEL EFFECT AT THE ENTRANCE OF THE TALL BUILDING... 94
FIGURE 65: ISO-PRESSURE CONTOUR AROUND THE BUILDING COMPLEX. ... 94
FIGURE 66: ISO-VELOCITY CONTOUR OF THE THREE BUILDINGS UNDER BID WIND LOAD ... 95
FIGURE 67: DESIGN FLOW CHART OF HIGH PERFORMANCE STRUCTURAL FACILITIES... 101
LIST OF TABLES TABLE 1: SOURCE TERMS OF THE FLOW EQUATIONS... ... 13
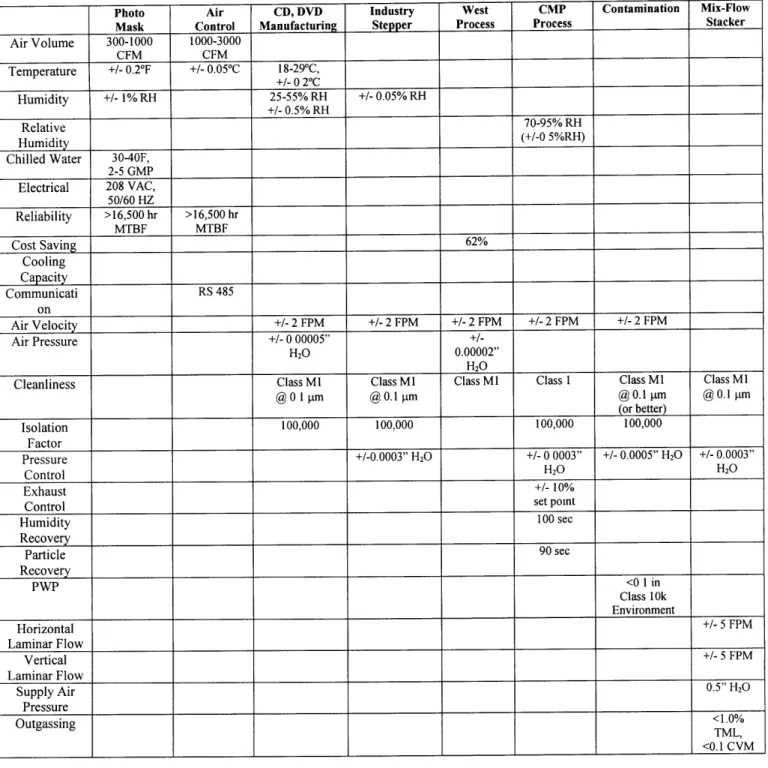
TABLE 2: INDOOR ENVIRONMENT SPECIFICATION FOR DIFFERENT MANUFACTURING HIGH PERFORMANCE FACILITIES ... 27
Computational Fluid Dynamics for High Performance Structural Facilities
Chapter
I
INTRODUCTION
Computational Fluid Dynamics for High Performance Structural Facilities
1.1 PROBLEM DESCRIPTION
Civil engineers in the coming twenty-first century need better methodologies to increase the performance level of structures with respect to constructablity, durability, and response to various environmental load conditions. Although solid mechanics has contributed substantially to structural engineering, fluid-structural interaction in building facilities still remains an interesting area to be investigated by civil and environmental engineers. For example, the performance of indoor air quality is hard to predict before the completion of the building and the installation of the ventilation facilities. Besides, the wind flow around the building complex is relatively unpredictable and often causes problems with both the structural envelope and adjacent structures.
The purpose of this work is to apply Computational Fluid Dynamics technology to improve design methodology for interior and exterior regions of structures with exacting environmental and mechanical design criteria. Widely applied to solve the fluid-structural interaction problem in the fields of aerodynamical and mechanical engineering, CFD technology was introduced to civil and environmental engineering in the early 1990's. Owing to the complexity and difficulty of doing in-field flow measurements, CFD provides an alternative way of simulating wind velocity, pressure distribution, and contaminant dispersion.
1.2 PROBLEM SOLVING
Computational Fluid Dynamics (CFD) and the simulation of a wide range of fluid flow problems are now becoming an integral part of the design cycle in many civil and environmental engineering projects. In the design of an industrial mixing or manufacturing facilities, or transient simulation of the operation of a hydraulic structure, the benefits which CFD techniques bring to decreasing the development time from idea to prototype are now well appreciated by many organizations working in industrial, environmental and scientific application areas.
Computational Fluid Dynamics for High Performance Structural Facilities
A number of computer systems, such as PHOENICS, have been used for the prediction of fluid flow, heat transfer, and related flow phenomena. For example, the smart HVAC system solves the fundamental flow equations and provides output of important characteristics of the flow regime including velocity, distribution, pressure loss, flow circulation, multi-phase interaction and mixing rate. CFD provides information that complements field and laboratory testing and reduces costs and time scales on development project.
The PHOENICS system provides advice and also builds and simulates the model using 3-D CFD codes and grid generation sub-functions. Basically, this unique method solves the problem concerning fluid-structural interaction behavior. Also, simulation results can be generated quickly to allow engineers and designers to modify the structural layout with minimal time delay.
1.3 THESIS OUTLINE
This thesis is divided into six chapters. Starting from the introduction of on-going computational fluid dynamics technology, the theoretical background and the use of computer tools is presented in the second chapter. Detail knowledge and examples of indoor environmental regulation is discussed in the third chapter with some simulation results of CFD models. In the fourth chapter, a case study about how CFD predicts the air flow around buildings and the impact of wind load to structural facilities is presented. Next, advanced wind engineering is discussed in the fifth chapter together with a calculation generated by CFD model. Conclusions and the future outlook of the advantage of using CFD for high performance structural facilities are elaborated in the last chapter.
Computational Fluid Dynamics for High Performance Structural Facilities
Chapter
II
REVIEW OF COMPUTAITONAL
FLUID MECHANICS
Computational Fluid Dynamics for High Performance Structural Facilities
The theoretical background of computational fluid dynamics and the supporting computer technology are reviewed in this chapter.
2.1 THEORETICAL BACKGROUND 2.1.1 Flow Equations
The general transport equation for steady, incompressible and turbulent flow of air referred to a Cartesian Coordinate frame has the form:
S(pU,) =
+ S
(1)
where the first term is associated with convection, the second with diffusion, and the third represents an input source.
Equation (1) is the governing equation for a number of processes. The generalized variable 0 represents different variables depending on process considered, such as the
velocity components U, V and W, the temperature T, the concentration of chemical species C, and the turbulence scales used in the turbulent model. Table 1 lists the form of
17 and S, for the various transport processes.
The turbulent model used in the k- e model is based on the Boussinesq turbulence viscosity hypothesis [1] for isotropic turbulence and uses the kinetic energy of turbulence and its dissipation rate e as the two scales. Hence, two additional transport equations for k and e need to be solved, i.e. a two-equation turbulent model.
Computational Fluid Dynamics for High Performance Structural Facilities
U-Momentum
V-Momentum
W-Momentum
Notes
Table 1: Source terms of the flow equations.
) 0 -g(P- Po) T F1, g C C F, Sc k Fk G, - CDpe + GB C, - (G + GB)-C 2 P-k k Pe PU+ u, G, = ~
+ay
ax
y 8xCz
+ ax+-8z ax)(V
+- -+ 8z= kinetic energy generated by shear
G, = fg p, aT = kinetic energy generated by bouyancy
q = heat production (W/m2)
p = volumetric expension coefficient P0 = fluid density at a reference point
Empirical constant in the equations
Ct CD CCe 1 CC2 rT C Uk t
0.09 1.0 1.44 1.92 0.9 0.9 1.0 1.22 0.9
Computational Fluid Dynamics for High Performance Structural Facilities
The governing flow equations are strongly inter-linked with no obvious equation available for the static pressure that appears in the momentum equations. Due to the complexity of the equations, analytic solutions are possible for very limited cases, and it is necessary to use numerical method in order to solve realistic problems. The numerical solution for the governing flow equations requires a discretization of the flow domain into a finite set of elemental or control volumes, define by a computational grid [2]. The differential equations may be integrated over each elemental volume of the computational grid. This leads to a set of algebraic equations in the following finite-volume form:
(ap -S'pp = _a, + Sp (2)
n
a, = DnaPen )+ O,±C,] ap = a (3)
n
where indices p and n denotes the central computational grid point and its neighboring points respectively, C and D indicated the strength of the convection and diffusion respectively. The source term So in Equation (1) is evaluated using a linearized
expression (S, + S', Op,) in order to enhance numerical stability.
These algebraic equations are solved in an iterative manner. The iterative solution continues until the imbalance or error in the equation is sufficiently small to be considered negligible.
2.1.2 Computational Fluid Dynamics
The physical aspects of any fluid flow are governed by the three fundamental principles: conservation of mass; Newton's second law; and conserved of energy. These fundamental principles can be expressed in term of mathematical equations which, in their most general form, are usually partial differential equations. Computational Fluid Dynamics (CFD) is the science of determining a numerical solution to the governing equations of fluid flow by advancing the solution through space or time to obtain a numerical description of the complete flow field interest.
Computational Fluid Dynamics for High Performance Structural Facilities
The governing equations for Newtonian fluid dynamics, the unsteady Navier-Stokes equations, have been known for over a century. However, the analytical investigation of reduced forms of these equations is still an active area of research, as is the problem of turbulent closure for the Reynolds average form of the equations. For non-Newtonian fluid dynamics, chemically reacting flows, and multiphase flows, theoretical
developments are at less advanced stages.
Experimental fluid dynamics has played an important role in validating and delineating the limits of the various approximations to the governing equations [2]. The wind tunnel, for example, as a piece of experimental equipment, provides an effective means of simulating real flows. Traditionally this has provided a cost-effective alternative to full scale measurement. In the design of high performance structural facilities and equipment that depends critically on the flow behavior, for example the aerodynamics design of an aircraft or long-span cable-stayed bridge, full-scale measurement as part of the design process is economically impractical and impossible. This situation has led to an increasing interest in the development of a numerical wind tunnel.
The steady improvement in the speed of computers and the available memory size since the 1950's has led to the emergence of computational fluid dynamics [3]. This branch of fluid dynamics complements experimental and theoretical fluid dynamics by providing an alternative cost-effective means of simulating real flows. As such it offers the means of testing theoretical advances for conditions unavailable on an experimental basis. The role of CFD in engineering predictions has become so strong that today it may be viewed as a new third dimension of fluid dynamics, the other two dimensions being the above stated classical cases of pure experiment and pure theory. The development of more powerful computers has furthered the advances being made in the filed of computational fluid dynamics. Consequently CFD is now the preferred means of testing alternative design in many engineering companies before final, if any, experimental testing takes place.
Computational Fluid Dynamics for High Performance Structural Facilities
2.1.3 The History and Literature Survey of CFD
The basic techniques of CFD were established in 1960's and employed first for aerodynamical and mechanical engineering applications. Its first successes in predicting indoor air modeling achieved in the 1970's. The CFD-service industry started in the 1980's, and expanded significantly in the 1990's with the innovation in computer technology [3]. Further expansion is likely during the next decade. One of the most significant changes will involve the use of electronic communication, to couple with field measurement and real time simulation.
2.2 MAJOR APPLICATIONS
CFD is concerned with predicting what will happen, quantitatively, when fluids flow, often with the complications of:
* Simultaneous flow of heat
* Mass transfer (e.g. perspiration, dissolution) * Phase change (e.g. melting, freezing, boiling) * Chemical reaction (e.g. combustion, rusting) * Mechanical movement (e.g. pistons, fans, rudders)
* Stress in and displacement of immersed or surrounding solids
2.2.1 How CFD Applies to Civil Engineering
Knowing how a fluid will flow, and what will be the quantitative effects on the solids with which the fluid is in contact, especially how a building performs under fluid-structural interaction is important to engineering design. CFD assists building-services engineers and architects to provide comfortable and safe human environment [4]. For example, applying CFD in preliminary design, power-plant constructors can attain maximum energy efficiency of the operation facilities and reduce the dispersion of pollutants in the building structure. Furthermore, risk and hazard analysis can be obtained to predict how much damage to structures, equipment, and human beings will be caused
Computational Fluid Dynamics for High Performance Structural Facilities
by fires, explosions and blast waves. Especially, CFD-based flow simulation enables metropolitan authorities to determine where a pollutant-emitting industry plant may be safely located, and under what condition motor-vehicles access must be restricted so as to preserve air quality. Meanwhile, meteorologist and oceanographers can foretell winds and water current while hydrologists and other environmental engineers concerned with ground-water will be able to forecast the effects of changes in ground-surface cover, the creation of dams, and aqueducts on the quantity and quality of water supplies.
2.3 HOW DOES CFD MAKE PREDICTIONS
The CFD approach starts by developing a physical model appropriate for the actual problem. The mathematical response of the physical model is generated using a computational software package, and the response is displayed visually to the user.
2.3.1 Can CFD be Trusted
CFD-based predictions are never 100%-reliable because the input data may involve too much guess work or imprecision. Currently the available computer power may be too small for high numerical accuracy. Also, the scientific knowledge in this field may be inadequate and unsophisticated. However, the reliability is greater for laminar as turbulent flow, and for single-phase as multiple-phase flow.
2.3.2 Where CHAM and PHOENICS Serve for CFD
CHAM was the first provider of general-purpose CFD software. The original PHOENICS appeared in 1981 [5]. CHAM has also originated many if the mathematical techniques and physical models which have become generally adopted by the industry, especially in connection with turbulence, multi-phase flow and chemical reaction.
The innovating tradition continues, with the result that today's PHOENICS contains many unique features, e.g.: (1) Simultaneous stress in solids. (2) Simulation of
Computational Fluid Dynamics for High Performance Structural Facilities
multi-fluid turbulence models. (3) The LVEL and IMMERSOL models for interspersed solids and fluids. (4) The virtual-reality user interface and (5) Potential use via Internet (share-ware on the net).
2.4 Personal Computer to Parallel Processor
The phrase "PC to parallel" has a double significance. First, it is a reminder that PHOENICS has for many years operated with full functionality on the whole range of hardware platforms, from personal computers (first DOS, now Windows or Unix) to supercomputers.
An across-the-board parallelization of PHOENICS [6] was effected during the 1990's. The adoption of the domain-decomposition technique enabled a single version to be employed for the entire commonly employed parallel-computer configuration. These may be of shared-memory or distributed-memory configuration. Recently, the second significance of the phrase has been realized: parallel PHOENICS now operates successfully, and with high efficiency, on cluster of personal computers linked by fast Ethernet, under the LINUX operating system.
2.4.1 The Benefits of Parallel CFD
Accuracy:
For CFD predictions to be realistic, the use of fine grids is essential requiring powerful computer with large memory resources [7].
Speed:
For CFD techniques to be used routinely in design and production cycles, fast computers are required to achieve reasonable iteration times.
Stability:
As computing demands increase one can upgrade the parallel system by adding more processors, thereby enhancing rather repeating on the initial investment.
Computational Fluid Dynamics for High Performance Structural Facilities
Economy:
Parallel computers give better price/performance ratios than vector supercomputers.
The performance and speed for the simulation of the airflow around building will be increased versus number of processors using parallel technique. The speed increase is
seen to be almost linear with the number of processors.
2.4.2 Platforms
PHOENICS has now been ported and benchmarked on a wide range of parallel machines. Indeed, all MPP and SMP computers that support message passing (MPI or PVM) can now run parallel PHOENICS. For example, NASA has employed PHOENICS on a CRAY T3m T3D and T90 NEC S-4 machine for complex aerodynamic calculation
[8].
2.5 WHAT PHOENICS DOES
PHOENICS, operated by its user, performs three main functions:
1. Problem definition, in which the user prescribes the situation to be simulated and the question to which he wants to answer.
2. Simulation, by means of computation, of what the laws of science indicate will probably taken place in the prescribed circumstances.
3. Presentation of the results of the computation, by way of graphical display, tables of numbers, and other means.
PNOENICS, like many but not all CFD codes, has a distinct software module for each function. This sub-division allows function (1) and (3), say, to be performed on the user's home computer, while the computationally intensive function (2) is carried out on another machine.
Computational Fluid Dynamics for High Performance Structural Facilities
2.5.1 How the Problem Is Defined
Problem definition normally involves making statement about: (1) Geometry, i.e. shapes sizes and positions of objects and domain spaces. (2) Material, i.e. thermodynamic, transport and other properties of the fluids and solids involved. (3) Processes, for example, whether the material are inert or reactive; whether turbulence is to be simulated and if so by what model; whether temperature are to be computed in both fluid and solid; and whether stresses in solid are to be computed. (4) Grid, i.e. the manner and fineness of the sub-division of space and time, i.e. what is called the "discretization" and other numerical (i.e. non-physical) parameters affecting the speed, accuracy and economy of the simulation.
2.5.2 How PHOENICS Make the Predictions
PHOENICS simulates the prescribed physical phenomena by expressing the relevant laws of physics and chemistry, and the "models" which supplement them, in the form of equations linking the values of pressure, temperature, concentration, etc which prevail at clusters if points distributed through space and time. PHOENICS makes the CFD calculation possible by locating these point-clusters (which constitute the computational grid) sufficiently close to each other to represent adequately the continuity of actual objects and fluids [3]. Most importantly, it solves the equations by systematic, iterative, error-reduction methods and enables the computation to be interrupted, and the controlling settings to be modified, as the user desired. This is very important when the user figures out that there are some problems in the rough iteration. Moreover, modifying the model enables users to save the iteration time for detail calculation. Finally, the program will be terminated when the errors have been sufficiently reduced and the calculation result approaches convergent.
Unlike those other CFD codes which cope with geometrically complexity by the use of "unstructured grids", PHOENICS retains the computational economy of the
Computational Fluid Dynamics for High Performance Structural Facilities
orderly "structured grid", while utilizing "multi-block" and "fine-grid-embedding", i.e. "cut-cell" techniques for handling geometric complexity [7].
PHOENICS possesses a unique EXPERT feature, which automatically optimizes the numerical parameters as the computation proceeds. The PHOENICS grid has lent itself particularly well to "domain-decomposition", which is what is needed for parallel computers.
2.5.3 How the Results Are Displayed
PHOENICS can display the results of its flow simulations in a wide variety of forms. It has its own stand-alone graphics package called PHOTON [9]; and it can also export results to such third-party packages as TECPLOT, AVS, and FEMVIEW. Unique to PHOENICS is its ability to take the results of its flow prediction back into the same Virtual Reality environment as is used for setting up the problem at the start. Numerical results are also provided, in which these physical processes are represented in the computer language, Fortran, are visible and accessible to users, by calling out the input Q1 file and output RESULT file.
2.5.4 Hardware
PHOENICS runs satisfactorily, with full functionality, on all hardware platforms, from personal computers, through UNIX workstations, to single- or multi-processor supercomputers. On personal computers, the operating system may be DOS,
Windows-95, Windows-NT or LINUX [10].
The parallel version of PHOENICS has been successfully ported to the most-frequently-encountered shared-memory parallel machine, as well as to those employing distributed memory.
Computational Fluid Dynamics for High Performance Structural Facilities
Of special interests, because of the high power/cost ratio, is the use of PHOENICS on networked clusters of personal computers. So far as is known from published information, PHOENICS is the only general-or-special-purpose CFD to be capable of working in this way.
PHOTON Vector 0.00 0.08 0.15 0.22 0.29 0.36 0.43 0.50 0.57 0.64 0.71 0.78 0.85 1,211 0.93 1.00 Y Z x
Figure 1: The application of CFD for indoor environmental modeling.
Computational Fluid Dynamics for High Performance Structural Facilities
Chapter
III
INDOOR ENVIRONMENT
MODELING
Computational Fluid Dynamics for High Performance Structural Facilities
3.1 CFD INVESTIGATION OF VENTILATION SYSTEM
Computational Fluid Dynamics (CFD) technique plays an important role in investigating the ventilation rate of Carbon Dioxide or other toxic gases in academic building or laboratory facilities. The computer software package PHOENICS, which is written with basic Fortran Code, formulates a numerical model using the 3D Navier-Stokes Equations together with the standard k-s turbulence model to simulate the indoor environment model [11]. For the model development, the control volume technique is employed to discretize the differential equations into difference form and the developed model has been used to simulate the ventilating process. The optimum design predicted by CFD provides a better configuration for the indoor air handling. Recommendations are made based on the system efficiency in ventilation.
Environmental scientists have applied experimental procedures to predict the dispersion of air born pollutants such as hydrogen gas propagation. Thorough understanding of air flow behavior, civil and environmental engineers can significantly help in identifying gas pollution dispersion process. This knowledge is usually obtained through laboratory experiments and field measurements. Alternatively, advancement in Computational Fluid Dynamics (CFD) offers a new non-hazardous method of analysis to understand, visualize and quantify flow field distribution and hence gas dispersions.
3.2 EXAMPLES OF HIGH PERFORMANCE STRUCTURAL FACILITIES 3.2.1 Semiconductor Micro-fabrication Clean Room
In the past decade, people have benefited from advances in electrical engineering and computer science. The development of the integrated circuit and micro devices replaced the conventional vacuum tube, and started size reduction and speed fastening for computer hardware components. The Very Large Scale Integrated Circuit (VLSI) is made from silicon chips and is comprised of electronic switches, or gates. The gates are
Computational Fluid Dynamics for High Performance Structural Facilities
measured by microns. diameter.
A micron is approximately one sixtieth of the human hair
Figure 2: Semiconductor chip processing procedure.
Clean rooms are spaces where strict control of air contamination is required for quality control processes. There are normally two types of clean rooms depending on the flow direction, the down-flow type and the cross-flow type. The class of a clean room represents the number of particles of certain size (usually _ 0.5ym in diameter) that can
be permitted in a unit volume of air. Down-flow type clean rooms can usually produce lower contaminant concentration levels then cross-flow type clean rooms. In the down-flow type clean room air is supplied downward from the ceiling through filters. A CFD simulation of the flow and contaminant distribution provides better suggestion of the design of down-flow type clean room by predicted flow pattern.
These types of high performance facilities that develop and manufacture integrated circuits require high level control of environmental factors. They also prevent potential health hazards that personnel may encounter while working in these fabrication facilities. The major environmental concerns are particle size and number, temperature,
Computational Fluid Dynamics for High Performance Structural Facilities
relative humidity, airflow velocity, and room temperature and pressure. Clean rooms are the special building facilities that provide these forms of control for better chip processing quantity and quality [12]. Also, an evolution of optical-electrical devices, such as Compact Disk (CD) and Digital Video Display (DVD) require even more restriction of vibration and dust level control. The design of clean rooms is playing an important role nowadays in microelectronic industries.
The technique of computational fluid dynamics presents an improved methodology for clean room design and construction. Research shows that vertical laminar flow plays a very important role in providing effective mean velocity for removing particles from the clean room. By comparison, the conventional air flow system only contributes the random aspect of room ventilation. Though the applying of vertical laminar flow from ventilation system has its limitations, it is essential in removing the particles that might damage the chip processing. In an empty room, the laminar flow operates well by itself. However, people and equipment cause turbulence that disturbs the flow's effectiveness and the performance of the filter and diffuser system. Working with these variables through CFD simulation will develop a better conceptual design procedure. The results, displayed by color figures, show an alternative for dealing with the turbulence and eddy caused by the operations in the clean room. This thesis will discuss several different CFD models, and their application to case studies.
Figure 3: Chip designers in the dust-free semiconductor fabrication clean room.
Computational Fluid Dynamics for High Performance Structural Facilities
Table 2: Indoor environment specification for different manufacturing high performance facilities
Photo Air CD, DVD Industry West CMP Contamination Mix-Flow
Mask Control Manufacturing Stepper Process Process Stacker
Air Volume 300-1000 1000-3000 CFM CFM Temperature +/- 0.20F +/- 0.050C 18-290C, +/- 0 20C Humidity +/- 1% RH 25-55% RH +/- 0.05% RH +/- 0.5% RH Relative 70-95% RH Humidity (+/-0 5%RH) Chilled Water 30-40F, 2-5 GMP Electrical 208 VAC, 50/60 HZ Reliability >16,500 hr >16,500 hr MTBF MTBF Cost Saving 62% Cooling Capacity Communicati RS 485 on Air Velocity +/- 2 FPM +/- 2 FPM +/- 2 FPM +/- 2 FPM +/- 2 FPM Air Pressure +/- 0 00005" +/-H20 0.00002" H20
Cleanliness Class Ml Class M1 Class Ml Class 1 Class M1 Class MI
@ 0 1 Im @ 0.1 tm @ 0.1 lm @ 0.1 Vtm (or better) Isolation 100,000 100,000 100,000 100,000 Factor Pressure +/-0.0003" H20 +/- 0 0003" +/- 0.0005" H20 +/- 0.0003" Control H20 H20 Exhaust +/- 10%
Control set point
Humidity 100 sec Recovery Particle 90 sec Recovery PWP <0 1 in Class 10k Environment Horizontal +/- 5 FPM Laminar Flow Vertical +/- 5 FPM Laminar Flow Supply Air 0.5" H20 Pressure Outgassing <1.0% TML, <0.1 CVM
Revisions of the Federal Standard 209B are currently being proposed to control particles 0.1 micron in diameter and larger to less than 10 particles per cubic foot (Class 10), and also for particles 0.1 micron in diameter and larger to less than 1 particle per cubit foot (Class 1) [12].
Computational Fluid Dynamics for High Performance Structural Facilities
3.2.2 Fundamental Design Criteria for Clean room
In the clean room, airborne particles can be organic or inorganic. Normally they range in size from 0.01 microns to several microns. Conditions for clean space vary widely with industrial and requirements. With a CFD model, a pollution source can be modeled with specific contamination density and location. By setting boundary conditions and modeling fluid simulations, interior or exterior air quality determined by particle distribution can be calculated and presented with arrow line graphs [9]. Thus, clean room designers will have a better idea of where to place the HVAC system and its components to create efficient operating conditions.
External contamination is primarily brought into buildings through the air-conditioning system that supplies working space with outdoor ventilation makeup air. In addition to the air-conditioning system, external contamination can infiltrate internal space through doors, windows, and cracks in the structure. The contamination generated from the chip processing procedure is controlled by the type of filter being used. On the other hand, the greatest source of internal contamination is the personnel themselves. All people continuously shed particles, organic and inorganic. The amount can vary from several hundred particles per hour to several thousand particles per hour.
Figure 4: Pad on the floor system.
Computational Fluid Dynamics for High Performance Structural Facilities
In addition to contaminating sources including people and chip processing, every activity involving friction of surfaces creates some type of contamination. Besides the toxic pollution from organic or inorganic chemical reaction during wet etching process, a certain dynamic situation exists in the air and causes movement of the particles. This includes people walking, rotation and vibration of service equipment within the operation area, and of course fan blowing and motor pumping.
Air pattern control should be directed to obtain the cleanest air at the most critical working area. As contaminants are entrained, they are easier to remove from the room. Thus, a large quantity of air at low velocity should be brought in the area of the most critical zone. In laminar flow system, air is introduced evenly from one entire area of the room, such as ceiling or wall, with flow at constant velocity across the room. Laminar flow provide a direct, predictable path which a micron size particle will follow through the cleanroom, with the minimum opportunity for contaminating the room occupancy.
Figure 5: Grated iron frame panel for under-floor ventilation.
Vertical flow consists of an entire ceiling which functions as a filter. Ideally, a grated floor serves the air exhaust. As it moves through the ceiling, it is filtered essentially free of all particles with 0.3 microns or greater. This type of airflow provides a uniform shower of air, which bathes the entire room in a downward flow of clean air. Contamination generated in the space will not move laterally against the downward flow of clean air and will not contribute to a contamination level buildup in the room. This type of design provides the cleanest working environment that has been applied in the cleanroom design for more than fifteen years.
Computational Fluid Dynamics for High Performance Structural Facilities
Lateral flow uses the same filtration airflow technique as the vertical flow system, except that the air flows from one wall of the room to the opposite walls. The supply wall contributes to the entire section of the room. This air then exists at the wall or ceiling at the opposite end of the room and is recalculated within the system. This type of flow has the same degree of filtration and the same air flow characteristics as the vertical air flow
system.
To generate an eddy effect which provides good air movement to prevent setting of particles, airflow velocity of approximately 100 feet per minute (FPM) is recommended as standard design of laminar flow for cleanroom system. The air velocity in the cleanroom design can be used as laminar state because local high velocity is minimized. It has been stated that air velocities below 70 FPM will prevent particles from setting. Normal dust particle movement has little effect above 70 FPM, while air velocities above 110-120 FPM contribute little contamination control advantages.
An arrangement for conventional flow air distribution is absolutely essential in the clean room design. Since air is supplied through large ceiling outlets, flow goes generally downward, and air is removed near the floor level. Air velocity across the room should be approximately 50 FPM. Lower floor velocities may permit particles to settle, while with conventional distribution, higher velocity may generate local turbulence and drafts. Although the contamination level is greatly reduced, this method does not offer the same protection as laminar flow [2].
Pressurization in the cleanroom facility is required to provide a potential migration of air from the cleanest space to areas with dust and dirt. The design should be based on a nominal 0.05 in pressure differential between clean and less uncontaminated zones. Pressures greater than the above value will result in greater make-up air and can begin creating problem with doors. There are two primary consideration to determine where to apply pressurization. The first one is differential pressure between functional space and the second one is building differential pressure. Pressure between functional space will be influenced by both recalculation air quality and make up airflow, while
Computational Fluid Dynamics for High Performance Structural Facilities
building pressurization is ultimately affected only by make-up air flow quantity. To provide control over room pressure, airflow variation should be minimized.
3.3 ACADEMIC BUILDING DESIGN REQUIREMENT 3.3.1 Office Module
In recent years the air conditioning of office buildings has become very essential due to the expansion in the use of business machines, such as computer and telecommunication facilities. These machines together with artificial lighting generate a significant heat load within the space (internal gain) and air conditioning is sometimes required to offset this gain. The demand for 24-hour air conditioning has also increased because of the tendency to build deep office spaces where internal gains are more significant than external heat gain. Most air conditioning systems for offices employ ceiling supply air terminals to utilize the ceiling surface for diffusing the air jet. A slot diffuser is often used for supplying the air over the ceiling. A typical ceiling supply for an office module has, therefore, been selected to demonstrate the potential of CFD in room movement prediction.
3.3.2 Classroom
Building service engineers should always be aware of the importance of placing good HVAC system in the classroom since students as well as teaching faculties spend most of their time there. In the design of academic building with high performance facilities, natural or passive ventilation is still the most common way of driving fresh air for people. The air flow into or out of a naturally ventilated building is produced by the action of wind on the building and the effort of buoyancy caused by the temperature difference between the air inside and the air outside. Although this method of ventilation is very common in the moderate climates, the air flow patterns produced by natural ventilation openings should be investigated before constructing the classroom. Moreover, in cold climate it may be necessary to place ventilation openings at high level in order to
Computational Fluid Dynamics for High Performance Structural Facilities
avoid draughts in the occupied zone. CFD can be applied to size ventilation opening in this case and predict the airflow movement and comfort level in the room under more critical weather condition than the summer ventilation case.
3.3.3 Design Requirement of Lab Facilities
Among all types of facilities in academic buildings, laboratories play a more important role and require special design compared to ordinary classrooms, cafeteria, and multipurpose conference rooms. For example, the concrete material testing lab, structural mechanics operation lab, hydraulic real scale field lab and nondestructive evaluation lab for civil engineering research have higher demand for indoors environmental control in addition to building structure performance requirements.
Figure 6: Facility arrangement of the biochemistry lab.
3.4 ULTIMATE DESIGN OF STRUCTURAL PROFILE
3.4.1 Overall Conceptual Design
Besides applying the efficiently pre-designed HVAC operation system, structural engineers can make better consideration of the increased space between two floor slabs.
Computational Fluid Dynamics for High Performance Structural Facilities
For example, advances in flooring systems and building controls allow engineers and architects more flexibility, creativity, and cost efficiency in their design.
The "integrated under-floor" system, which is very important to the design of high-performance building, combines mechanical, electrical, and telecommunication systems in compact under-floor zones that allow these discrete components to be managed in modules [13]. In terms of building automation systems, the phrase "integrated" means the tying together of wiring, hardware, software, and electronic devices required for monitoring and controlling such building functions as lighting, temperature, humidity, and security.
Integrated building automation and access floors are more complicated to deal with in renovations, such as the possible retrofit of Parson's Lab of Building 48 at MIT. Technical needs must be balanced against the constraints imposed by structure depends long before central air conditioning or computerized telecommunications of the new CEE Building.
Header trench cover
Prese inserts
Ltg htw*ght concrts
Header trench (power, computer srign
Computer l-Tna /
Telephon~ Fit#re proofing
Fire proofing around steel beam
Figure 7: Cellular decks for integrated flooring system.
Access floors have long proved their worth in the delivery of electrical power and voice-and-data hookup to individual workstation and personal computer. Recently, new products and revision in cabling standards are making access floors more appropriate for
Computational Fluid Dynamics for High Performance Structural Facilities
a wider range of applications to merge into structural frameworks. Moreover, an European trend toward using under-floor spaces in air-displacement ventilation systems is beginning to catch on in North America. Especially, for computer rooms in office or academic buildings, integrated under-floor access brings and approaches to the flexibility of using high-strength composite material in a wide variety of applications.
Figure 8: Raised-floor slab of integrated cabling system for intelligent building.
3.4.2 Intelligent Materials
To improve the performance of a clean room as well as an intelligent office building, innovative material can be applied in fabricating new structural facilities such as utility penetration, pedestals, access panels and half-inch wall system. With those
smart construction materials, higher strength floor slabs are possible, resulting in more efficient partition systems and structural space layouts, and consequently better indoor ventilation.
Figure 9: Smart materials for integrated under floor access systems.
MIT Department of Civil and Environmental Engineering 3z
Computational Fluid Dynamics for High Performance Structural Facilities
3.4.3 Smart Structural Profile
With the improved technology of interior building facilities, it is feasible to achieve a better design scheme for high performance building structure combined with HVAC system, under-floor cabling for telecommunication and vibration isolation assemblage [14]. Meanwhile, accurate preliminary design will reduce the difficulty of construction and also changing of the design. Without increasing the height of each story, HVAC components can be inserted in the ceiling space and under floor panels to provide indoor ventilation of the office space. Thus, engineers are able to overcome the conflict between room ventilation design and basic structural layout. For example, in Figure 10 on this page, room temperature will be controlled within certain height of each story and energy will be saved by efficient HVAC system.
Occupied Zone -(180 cm) 74 75 76 77 78 79 80 (F) Private Office
-C,-n
O
Vertical Temperature ProfileUnder-floor HVAC system m 7
S23 24 25 26 27 28 29 (C)
Figure 10: Optimization design of HVAC system integrated with structural components.
Computational Fluid Dynamics for High Performance Structural Facilities
3.5 VIRTUAL PERSONAL ENVIRONMENTAL CONTROL
People are very sensitive to room temperature and humidity especially in the space where they have to stay most of the time. As a consequence, with the on-going CFD technology, we can build up a pseudo model for personal environmental control to monitor and regulate the desired microclimate factors.
Table 2: Weekly HVAC control schedule.
FAN I (SCHEDULE) ON OFF ON OFF
SUNDAY MONDAY 08:00 17:00 19:00 22.00 TUESDAY 08:00 17:00 19.00 22'00 WEDNESDAY 08'00 17'00 19:00 22:00 THURSDAY 08:00 17:00 19:00 22:00 FRIDAY 08:00 17:00 SATURDAY 08-00 17:00 HOLIDAY SUMMER 10:00 14.00
It is hard to satisfy every individual in the entire building because each room will have completely different temperature owing to location of the chamber and the material being used for construction and remodeling. Some building materials do absorb heat and some reflect or transfer radiation energy to increase room temperature. Thus, fuzzy logic is very suitable to apply in the microclimate control system in the intelligent building [15]. For example, sensors will be placed in each room to record the temperature fluctuation of the space during 24 hours. Then the fuzzy logic panel will determine the optimal solution for keeping the room cold during the summer time and maintaining the room warm during the winter. Finally, signals will be sent to the HVAC system to actuate the valve dampers in order to control the inlet and exhaust air volume [16].
Computational Fluid Dynamics for High Performance Structural Facilities
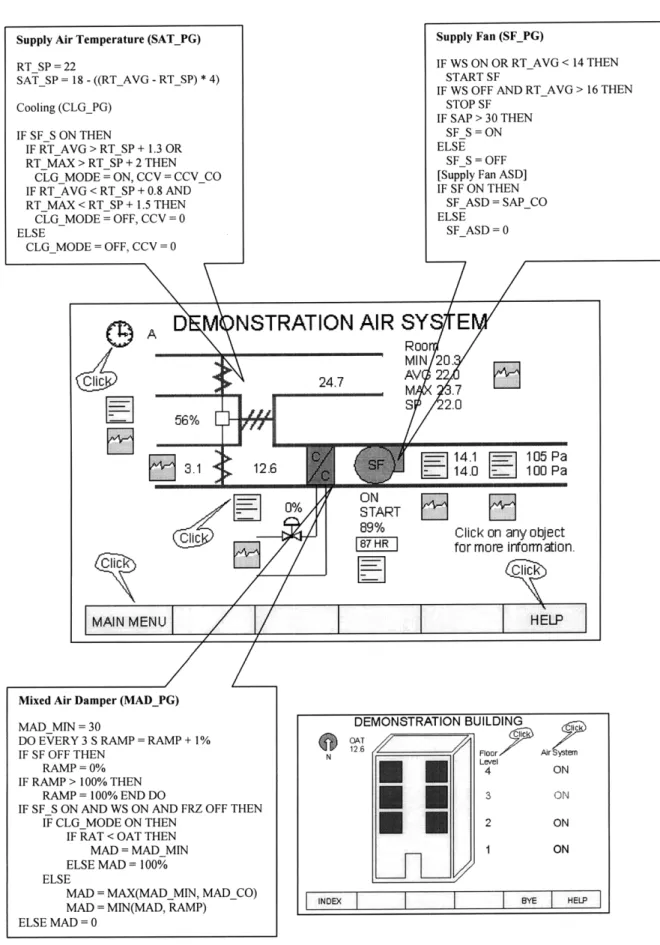
Supply Air Temperature (SAT_PG) RT SP = 22 SATSP = 18 - ((RTAVG - RTSP) * 4) Cooling (CLGPG) IF SF S ON THEN IF RT AVG > RT SP + 1.3 OR RT MAX > RT SP + 2 THEN
CLG MODE = ON, CCV = CCV_CO IF RT AVG < RT SP + 0.8 AND RT MAX < RT SP + 1.5 THEN CLG MODE = OFF, CCV = 0 ELSE CLG MODE = OFF, CCV = 0 Supply Fan (SF_PG) IF WS ON OR RTAVG < 14 THEN START SF
IF WS OFF AND RT AVG > 16 THEN STOP SF
IF SAP > 30 THEN SF S = ON ELSE
SFS = OFF [Supply Fan ASD] IF SF ON THEN SF ASD = SAPCO ELSE SF ASD = 0
/7
/-A
NSTRATION AIR SY
E
MI24.7N 20 56% S 2.0 r"- 4 I ,4n . 14.0 5100 Pa ON START 89%Mixed Air Damper (MAD_PG) MAD MIN = 30
DO EVERY 3 S RAMP = RAMP + 1% IF SF OFF THEN
RAMP = 0% IF RAMP > 100% THEN
RAMP = 100% END DO
IF SF S ON AND WS ON AND FRZ OFF THEN IF CLG MODE ON THEN
IF RAT < OAT THEN MAD = MAD MIN ELSE MAD = 100% ELSE
MAD = MAX(MAD MIN, MAD CO) MAD = MIN(MAD, RAMP)
ELSE MAD = 0
Click on any object for more information.
Figure 11: Virtual indoor environment modeling with smart HVAC control.
MIT Department of Civil and Environmental Engineering 3; DEMONSTRATION BUILDING OAT N Floor AlrSystem Le'vel 4 ON 3 ON 2 ON I ON
INDEX BYE HELP
r----W 1-4Nt ::: 171 rrrrr = 3.1 12.6
Computational Fluid Dynamics for High Performance Structural Facilities
10.0
-05.0 00.0
1200 24:00 1200 24:00 12:00 24:00
Apri26 Apr/25 Apr124 Apr23
HELP SCREEN
System Schematics
The dolloWng iconsareused Dynamic Data
(i Wedy Schedule - Water Acuia - On Top 21.8 375CFM 7 Air Setpont - On Bottom 22.0 350 CFM TrendLog CertiglFan Status-OnTop ONIOFF OC Progam HC -HeatingCol Command-On Botom STARTISTOP
CC -Cooing Coil AfM- AutDManual Indtion Runtime Tots - Pumnp
Ditifs "i"- Damper
Temperature Sensor and Electric 2-Way C ontro Valve
Space Trend Icon Command Mode - Ext graphic mode go to text mode. Press F to return to graphic mode. Main Menu - Retum access for ea reen Bye -Exit computer syster returnto
Previous - Return to previous screen DOS or Wndovw or hang up if S connedto system by modem. Spaceforrcutiombttons Help- Returns to
for partcua grah s s tisscreen
a M Prev. .. I mnd I te- H
Figure 12: Smart HVAC control system using fuzzy logic
MIT Department of Civil and Environmental Engineering 38
Exhaust Inlet - Setpoint
m---m Measured vanriable
Frequency: 01:00:00 wnwm Controlled Variable
Computational Fluid Dynamics for High Performance Structural Facilities
3.6 CFD SIMULATION FOR A SIMPLE CASE STUDY 3.6.1 Objective
The main goal of this project design and analysis is to obtain preliminary indoor environmental data such as temperature distribution, flow velocity and pressure distribution by using Computational Fluid Dynamics methodology. With PHOENICS available on Athena workstation, 3-D model of the room chamber being examined can be modeled with pre-processing VR-Editor and rough indoor environment factor after running Earth. Finally, the graphical visual displays were printed with colors to present the indoor environmental parameters simulated by the computer package. As a result, engineers can get better ideas of how fluid flows in the room chamber and predict the proper location of high performance ventilation facilities of the building structure.
3.6.2 Problem Definition
The building material being used and the boundary condition being applied can be defined by the graphical user interface and the database in the "TR324-Starting with PHOENICS -VR" tutorial menu [17].
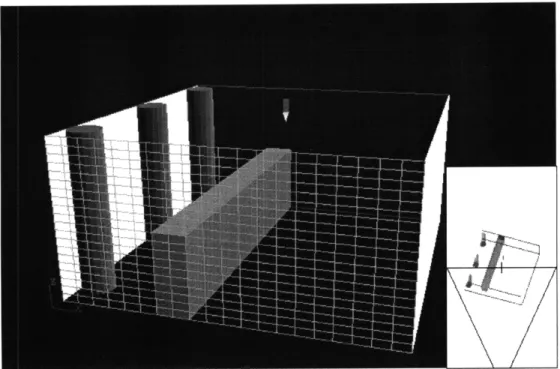
Figure 13 displays the setting of the office room domain, It is 10 feet wide, 10 feet deep and 5 feet high. The grid dimension used for space meshing system is 20, 15, 20 divisions in X, Y, Z direction respectively. The indoor air flow model to be applied is laminar since the iteration time and accuracy is limited. Iteration number for this case study is defined as 200, and it takes 6 minutes and 5 seconds to reach the 6 8th calculation step.
Simulation results are presented in Figure 14 to Figure 21. It is obvious to see the pressure distribution of the room is co-related to velocity profile. Also, temperature distribution is illustrated with color diagram, which shows the hot, worm and cold parts within the room.
Computational Fluid Dynamics for High Performance Structural Facilities
Figure 13: Room arrangement and grid setting for the CFD pre-processing.
Figure 14: Forced ventilation in the office room chamber.
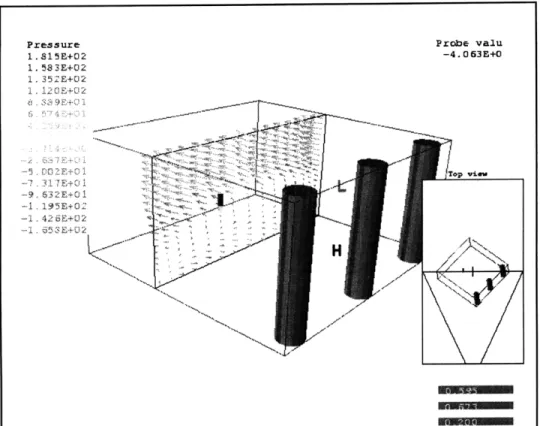
Computational Fluid Dynamics for High Performance Structural Facilities Probe valu -4.0 63E+0 Pressure .815E+02 1. 352E+02 S 3 9 Y 4. +'01 -19, 32E 0 - . ..02253 Un- --Flmoellell u Figure 15: Pressure distribution profile on a random cross-section.
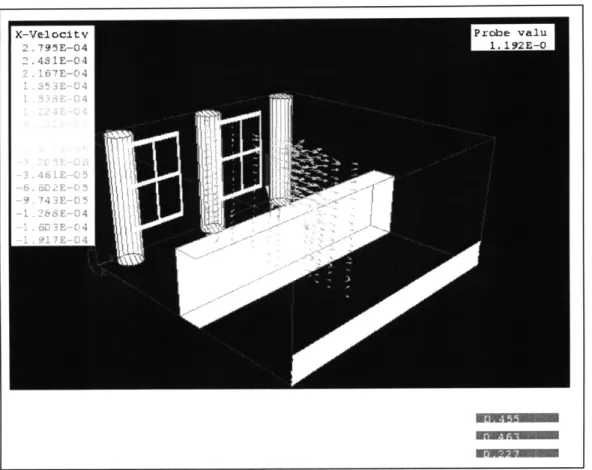
Figure 16: Iso-velocity surface contour at a specific point.