HAL Id: hal-01829876
https://hal.archives-ouvertes.fr/hal-01829876
Submitted on 4 Jul 2018
HAL is a multi-disciplinary open access
archive for the deposit and dissemination of
sci-entific research documents, whether they are
pub-lished or not. The documents may come from
teaching and research institutions in France or
abroad, or from public or private research centers.
L’archive ouverte pluridisciplinaire HAL, est
destinée au dépôt et à la diffusion de documents
scientifiques de niveau recherche, publiés ou non,
émanant des établissements d’enseignement et de
recherche français ou étrangers, des laboratoires
publics ou privés.
Relationship between primary producers and bacteria in
an oligotrophic sea-the Mediterranean and
biogeochemical implications
C. M. Turley, M Bianchi, U Christaki, P Conan, J. R. W. Harris, S Psarra, G
Ruddy, E. D. Stutt, A Tselepides, France van Wambeke
To cite this version:
C. M. Turley, M Bianchi, U Christaki, P Conan, J. R. W. Harris, et al.. Relationship between primary
producers and bacteria in an oligotrophic sea-the Mediterranean and biogeochemical implications.
Marine Ecology Progress Series, Inter Research, 2000, �10.3354/meps193011�. �hal-01829876�
Vol. 193: 11-18,2000 MARINE ECOLOGY PROGRESS SERIES
Mar Ecol Prog Ser Published February 28
Relationship between primary producers
and bacteria in an oligotrophic sea-the
Mediterranean and biogeochemical implications
C. M. Turleylr:
M. ~ i a n c h i ~ ,
U. Christaki3, P. Conan4, J.
R.
W.
Harrisl, S. psarras,
G. ~ u d d y ' ,
E.
D. Stuttl,
A. Tselepides5, F. Van Wambeke2
'Centre for Coastal & Marine Sciences, Plymouth Marine Laboratory, Citadel Hill, Plymouth PL1 2PB. England 'Microbiologie Marine. C. N. R. S., UPR.
223.
Campus de Luminy, Case 907, 13288 Marseille Cedex9.
France3NCMR, National Centre for Marine Research. 16604 Aghios, Kosmas, Hellinikon, Greece 4Centre d'oceanologie de Marseille, LOB, Campus de Luminy, Case 901, 13288 Marseille Cedex 9, France
SInstitute of Marine Biology of Crete, PO Box 2214, 71003 Heraklion, Crete, Greece
ABSTRACT: The proverbial blue colour of the Mediterranean reflects some of the most extreme oligo- trophic waters in the world. Sea-surface Sea-viewing Wide Field-of-view Sensor (SeaWiFS) satelhte data show the relatively clear, pigment poor, surface waters of the Mediterranean with a generally increasing oligotrophy eastward, apparent even from space. Integrated over depth, however, the east and west Mediterranean show similar amounts of phytoplankton and bacterial biomass. By contrast, primary production and bacterial production are 2 to 3 times lower in the eastern Mediterranean than in the west. However, the relationship between bacterial production and primary production in the east
and west are significantly different. While bacterial production is hrectly proportional to primary pro- duction in the east, in the west it increases as approximately the square root of primary production. This suggests that the bacteria in the west are relatively decoupled from local contemporaneous primary production. In contrast, the gradient of close to 1 in the log bacterial production versus log primary pro- duction relationship in the east suggests less temporal decoupling and, therefore, less seasonal accu- mulation of DOC. In addition, the constant proportionahty between bacterial and primary production of 0.22, whlch, if all primary products are respired, gives an estimated geometric mean bacteria growth efficiency of 22% (95% confidence limits of 17 and 29%) for data in the eastern Mediterranean. Our data suggest that the degree of bacteria-phytoplankton coupling has an important effect on apparent trends between bacterial and phytoplankton production in high frequency data. The combination of low primary production and bacterial dominance of secondary production in the east is also of signifi- cance as it could account for the low fisheries production, the low vertical flux of material and low bio- mass of benthic organisms in the region.
KEY WORDS: Bacteria
.
Phytoplankton.
Bacterial growth efficiency.
Ocean productivity . OLigotrophy - MediterraneanINTRODUCTION
The Mediterranean Sea has high evaporation rates
and low land run-off, resulting in a deficit in its hydro-
logical balance. Nutrient-depleted Atlantic water flows
into the Mediterranean through the narrow (ca
4km2)
Strait of Gibraltar (Bethoux et al. 1992) and, after cir-
culating the basin, exits the same way with nearly 10
%more salt content (Milliman et al.
1992).There is
increasing nutrient depletion from west to east, with
a particularly pronounced gradient for phosphorus
(Krom et al. 1991). The basin-wide cyclonic circulation
of nutrient-depleted water (Dugdale
&Wilkerson 1988),
hot, dry and seasonal climate and low land run-off con-
tribute to the low productivity of the sea and the west-
east trend in oligotrophy (Fig. 1, Table
1).The aim of
this paper is to investigate the coupling between bac-
Q Inter-Research 2000Turley et al.: Primary producers and bactena in an ohgotropbc sea 13
Fig. 1. Ocean colour Sea-viewing Wide Field-of-view Sensor (SeaWiFS) from Orbital Sciences Coorporations' SeaStar satehte estimates of chlorophyll a concentrations (mg m-3) in a monthly composite during (a) October 1997, (b) April 1998 and (c) May 1998
terial and primary production in the western and east-
ern Mediterranean and evaluate its significance to the
west-east trend in productivity.
METHODS
Basin-wide and regional sea-surface chlorophyll
a
concentrations were estimated using a Sea-viewing
Wide Field-of-view Sensor (SeaWiFS) Version 2 chloro-
phyll product from NASA (Fig. 1) in order to examine
seasonal sea surface concentrations in the western and
eastern Mediterranean basins (Table 1).
Chlorophyll was determined from water samples
using a fluorometric method (Yentch
&Menzel 1963,
Holm-Hansen
&Riemann 1978). Primary production
was measured using the NaH14C03 method (Steeman-
Nielsen 1953, Dandonneau
&Le Bouteiller 1992) and
the phytoplankton efficiency (PE) estimated by pri-
mary production/chlorophy11.
Bacteria were enumerated directly by epifluorescent
microscopy and staining with the DAPI fluorochrome
(Porter
&Ferg 1980) on freshly preserved, filtered
(Turley
&Hughes 1992) and sonicated samples (Turley
et al. 1996). Bacterial biomass was calculated from cell
numbers using the conversion factor 20 fg C cell-' (Lee
&Fuhrman 1987).
Bacterial production was calculated using the theo-
retical approach of Kirchman (1993) by measuring leu-
cine incorporation into bacterial protein after the addi-
tion of 10 nM 3H-leucine (Chin-Leo
&Kirchman 1988).
The above analyses were carried out at the sites in
the western and eastern Mediterranean basins shown
in
Fig. 2 .
T-tests were carried out on logged data, where
appropriate, to test for significant differences for west-
ern and eastern integrated data used in Table 2.
Regression analysis (Table 3) was applied to the west-
ern and eastern bacterial and primary production data
in Fig. 3 to test for
a
significant difference between the
2 regressions of the data from the 2 regions.
RESULTS
AND DISCUSSION
Both nitrogen and phosphorous can be limiting nut-
rients for phytoplankton and bacterial growth
in
the
Mediterranean during summer (Dugdale
&Wilkerson
1988, Bhthoux et al. 1992, Berland et al. 1990, Krom et
al. 1991, Estrada et al. 1993, Thingstad
&Rassoulzade-
gan
1995).Despite the deep chlorophyll maximum
(DCM) characteristic of the Mediterranean (Estrada et
al. 1993, Lef&vre et al. 1997), there is a west-east trend
in surface chlorophyll
a
concentration seen from space
during spring and summer (Fig. 1, Table 1). This is
even more apparent if the anthropogenically enriched
waters of the Adriatic are excluded from the eastern
basin (Table 1). The DCM is, in general, over 30 m
deeper in the east but, in contrast to the SeaWiFS
images of surface chlorophyll, the integrated chloro-
phyll is similar in the west and east (Table 2). The
integrated primary production in the west, however,
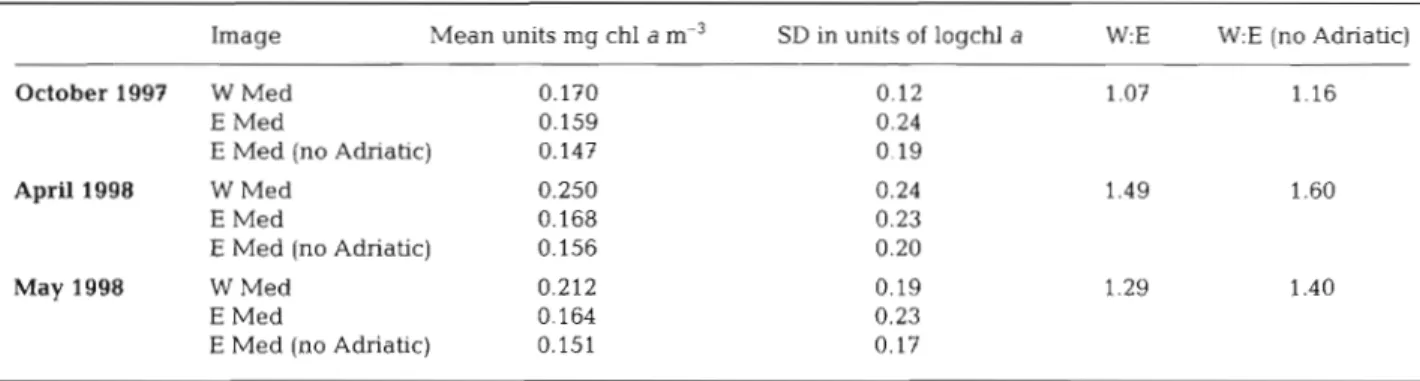
Table 1 . Comparison of sea surface chlorophyll a (cN a) concentrations between the western and eastern Medterranean. The re- gional sea-surface chl a data were extracted from the SeaWiFS images shown in Fig. 1 using hand drawn masks. W Med. is the geometric mean of all data west of a line between Sicily and Africa. E Med is the geometric mean of all data east of the line. E Med (no Adriatic) is the E Med excluding the Adriatic (area north of a Line between the closest point of the heel of Italy and the Balkans). The raw scaled data were converted to logchl a and statistics calculated for data points greater than zero (logchl a > 0.01). SD (sqrt variance) is in units of logchl a. Data used is from SeaWiFS Version 2 chlorophyll product from NASA Image Mean units mg chl a m-3 SD in units of logchl a W:E W:E (no Adriatic)October 1997 W Med 0.170 0.12 1.07 1.16
E Med 0.159 0.24
E Med (no Adriatic) 0.147 0.19
April 1998 W Med 0.250 0.24 1.49 1.60
E Med 0.168 0.23
E Med (no Adriatic) 0.156 0.20
May 1998 W Med 0.212 0.19 1.29 1.40
E Med 0.164 0.23
14 Mar Ecol Prog Ser 193: 11-18, 2000
=
,a G .2 a 3E
e a
9 2cr5
2
a) rd U , m V) - m2
?!
Cx
K
0E
-G-
0 c m5
v- mG
2
kE
.5 D%
E
5
DF :
C O G G Z k G - a , g C C a) '-73$ 5
;
3 5$ 2
g
G Na . 5 ;
3 m 9 0 3 Z dE b e
n 0 a ) a y- 5 5
'D $ C S m 0E
3"'Gz
.2
2
5 0 3 - - U 0 3 a, m ~ S C U P - 5 2 C & - m 5 : ;"U, 5 - 2 m m r n z.5
a, a, E Z 5E o 5
S ,
m C C a,5
$ 0-
5 ;
q
V]2
2
g
S
g
2
2;
:
2 sz:
3
kg
0 c a :. m2:
"
8
m C E8
is over 3 times that in the east (Table 2). In other
words, the phytoplankton efficiency in the eastern
Mediterranean is a third of that in the west (Table 2).
The phytoplankton efficiency may be an indication
of the degree of nutrient and light limitation.
Similarly, the biomass of bacteria integrated to the
base of the DCM (DCMb) is only slightly higher
in the east than the west, but their growth rate is
significantly lower in the east than in the west
(Table 2). Hence, measures of biomass (chlorophyll
a
and bacterial counts) are similar in the east and
west, but activities (production and growth rates) are
different.
Organic matter flux into bacteria is one of the ma-
jor pathways of material and energy flow in pelagic
foodwebs (Azam et al. 1983, Cole et al. 1988, Azam
&Smith 1991, Azam et al. 1992, Ducklow
&Carlson
1992). Dissolved organic carbon (DOC) generated
from primary production by a variety of means is
taken up by bacteria and used for their growth and
metabolism (Azam
&Smith 1991, Azam et al. 1992,
Ducklow
&Carlson 1992). The proportion of pri-
mary production supporting bacterial production in
marine environments is reported to vary from 10%
to over 100
%with a mean of 30 to 40
%(Cole et al.
1988, Ducklow
&Carlson 1992). In the western
Mediterranean, bacterial production integrated to
the DCMb comprises 9 to 46% (mean 21
%)of the
integrated primary production (Table 2). Assuming a
bacterial growth efficiency of 20% (del Georgio et al.
1997 calculated a global median value of 24
%),then
44 to 228
%(mean 110
% )of primary production may
be routed through the DOC reservoir and support the
bacterial carbon demand (BCD). Significantly, when
primary production is low, BCD may therefore ex-
ceed primary production in the western Mediter-
ranean (Fig. 3). Similar calculations for the east re-
veal integrated bacterial production of 18 to 54
%(mean 34
%)of the integrated primary production
(Table
2)and suggest that at a bacterial growth effi-
ciency
(BGE)of 20%, around 89 to 268% (mean
170%) of primary production is required to support
the BCD. Hence, net heterotrophy may be observed
in both east and west during certain times of the year.
The calculations suggest that either a greater propor-
tion of the primary production may flow to the micro-
bial food web in the eastern Mediterranean than in
the western Mediterranean despite lower rates of
bacterial production or that
BGEis generally lower in
the east than the west. These estimates are conserva-
tive as BGEs in oligotrophic waters may be lower
(Kirchman et al. 1991, Carlson
&Ducklow 1996).
The direct proportionality of bacterial production
and primary production in the eastern Mediter-
ranean, demonstrated in Fig.
3,suggests that bacte-
Turley et al.: Primary producers and bacteria in a n oligotrophic sea 15
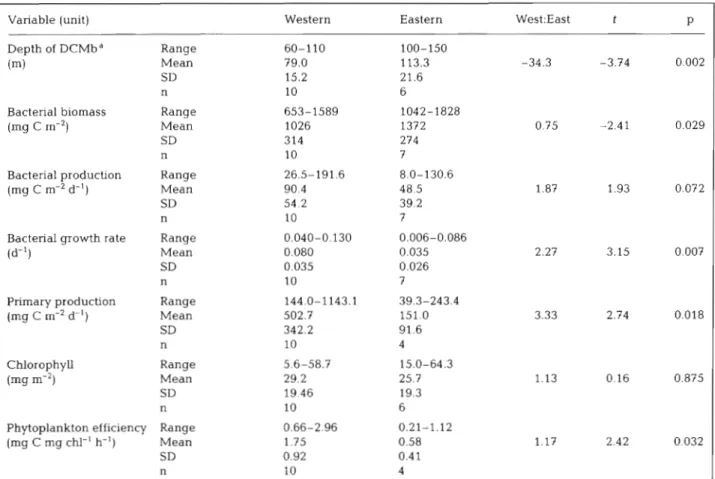
Table 2. Concentrations and rates of measurements integrated from the sea surface to the base of the deep chlorophyll maximum (DCMb) in the western and eastern Medterranean Sea. The depths of the DCMb are also glven. T-tests were carried out to indicate the significance of the difference between western and eastern data using logged data where appropriate. Original data sets are available in the EMPS (Bianchi et al. 1997) and CINCS (Tselepides et al. 1997) Mediterranean Targeted Project
Final Reports
Variable (unit) Western Eastern West:East t P
Depth of DCMbd Range 60-110 100-150
(m) Mean 79.0 113.3 -34.3 -3.74 0.002
SD 15.2 21.6
n 10 6
Bacterial biomass Range 653-1589 1042-1828
(mg C m-') Mean 1026 1372 0.75 -2.41 0.029
SD 314 274
n 10 7
Bacterial producbon Range 26.5-191.6 8.0-130.6
(mg C m-2 d-') Mean 90.4 48.5 1.87 1.93 0.072
SD 54.2 39.2
n 10 7
Bacterial growth rate Range 0.040-0.130 0.006-0.086
(d-') Mean 0.080 0.035 2.27 3.15 0.007
SD 0.035 0.026
n 10 7
Primary production Range 144.0-1 143.1 39.3-243.4
(mg C m-' d-
'
) Mean 502.7 151 0 3.33 2.74 0.018 SD 342.2 91.6 n 10 4 Chlorophyll Range 5.6-58.7 15.0-64.3 (mg m-2) Mean 29.2 25.7 1.13 0.16 0.875 SD 19.46 19.3 n 10 6Phytoplankton efficiency Range 0.66-2.96 0.21-1.12
(mg C mg chl-' h-') Mean 1.75 0.58 1.17 2.42 0.032
SD 0.92 0.41
n 10 4
aIn the case of 1 eastern station, in the absence of chlorophyll, the depth of the DCMb was taken to correspond with that of the nearest comparable station
Table 3. Regression analysis of log bacterial production on log primary produc- tion relationships shown in Fig. 3. In each case the top line gives the vanance due to the regression, whose significance is tested by the Fratio to the variance withln regions. The second line gives the additional variance accounted for by using separate regressions for east and west. The significance is obtained here by lookmg at the ratio between this and the additional amount accounted for by using a separate regression for each site within either region (within region vari- ance). Finally, the significance of the variation between hauls (vertical sections)
at the same site (within region variance) is tested by taking the ratio of this to the pooled error variance for individual regressions on each haul (within haul vari- ance). This variation within regions is always significant, i.e. all the relations are different for each haul you take. Compared with this variation between hauls, the relation of bacterial production to primary production is highly significantly
different between east and west
Source of variation df SS Variance F P
Regression 1 13.21278 13.21278 90.35963 <0.001 Between regions 2 1.757998 0.878999 6.011301 <0.01 Within regions 24 3.509385 0.146224 2.460079 <0.005 Within hauls 51 3.031384 0.059439
rial production is entirely dependent
on primary production products. The
regression line in Fig. 3 for the east
shows a constant proportionality be-
tween bacterial and primary produc-
tion of 0.22, which, if all primary
products are bacterially respired, is
equivalent to a geometric mean
BGEof 22
%(95
%confidence limits are
17and 29
%).This novel method of esti-
mating bacterial growth efficiencies
gives a BGE value similar to that used
in the above calculations and by del
Giorgio et al. (1997) and supports the
recent measurements of lower esti-
mates (Carlson
&Ducklow 1996, del
Giorgio et al. 1997). Bacteria therefore
play a major role in organic carbon
flow in both the east and west, but this
16 Mar Ecol Prog Ser 193: 11-18.2000
because bacterial populations may be
Fig. 3. The relation of log bacterial production to log primary production above
the base of the deep chlorophyll maximum. The difference between west and
respond
theeast is significant (F2,24 = 6.01, p c 0 01, Table 3). Regression equations, statis-
production of DOC, due, perhaps, to
1 .O
c
0 .- c. U 0.5 3-
z
0.0 -E
-0.5.-
b
Ll
+g
F - l 0m -
C3
-1.53
-2.0tics and lines are given for western (*; -) and eastern (U; ----) Mediterranean
nutrient limitation or predation result-
data collected at different times of year (see Fig. 2 legend). Also see Table 3 foring in DOC
( ~ i ~ k i ~
&further statistical analysis
Anderson 1997, Thingstad et al. 1997).
In contrast, the gradient of close to 1
inrole is greater in the east, where microheterotrophs to-
the log bacterial production versus log primary pro-
tally dominate the food web. In addition, small photo-
duction relationship in the east (Fig. 3) suggests very
trophs dominate photosynthesis
inoligotrophic waters
little spatio-temporal decoupling of this kind and,
favouring the dominance of a microbial loop, acting as
hence, little seasonal accumulation of DOC.
a n energy sink in the foodweb (Hagstrom et al. 1988).
One explanation for the tight coupling between pri-
The highly significant positive relationships between
mary and secondary production in the east, may be
log bacterial production and log primary production
exudation of carbon as mucopolysaccarides by nutrient
(Fig. 3) for both the west and east Mediterranean indi-
stressed phytoplankton. Under extreme P-deficiency,
cate that primary production is a significant source of
as occurs particularly in the eastern Mediterranean
DOC for bacterial production in both areas. However,
(Krom et al. 1991), such production can be the main
the relationship between bacterial production and pri-
photosynthetic activity (Myklestad 1977). This may
mary production in the east and west are significantly
provide a better substrate for bacteria than for larger
different (Table 3). While bacterial production is di-
organisms (Azam
&Smith 1991). Indeed, bacterial
rectly proportional to primary production in the east, in
nutrient regeneration coupled with phytoplankton
the west it increases as approximately the square root
production of cell surface polysaccharides on this
of primary production (Fig. 3). Integrated primary pro-
micrometer scale has been proposed as a self-sustain-
duction in the west is over 3 times higher than in the
ing mutualism between bacteria and phytoplankton
east (Table
2) and a DOC and DON reservoir is known
especially
in
oligotrophic waters (Azam
&Smith 1991).
to accumulate in the west during the summer (Copin-
In contrast, the higher surface pigment concentration
Montegut & Avril 1993, Pujo-Pay et al. 1997). The rela-
off southern France and Spain (Fig. la-c), due to high
tion observed in Fig. 3 is consistent with periods or
nutrient input from the Rhone, other rivers and local
areas of high primary production effectively subsidis-
upwelling (Minas
&Minas 1989), may act as a further
ing bacterial production in periods or areas of low pri-
source of DOC for bacteria in the western Mediter-
mary production. In the west, when primary produc-
ranean. In addition, the decoupling in the west may be
tion is low, bacterial production is higher than it is in
exacerbated by high dispersion rates, seasonal vertical
the east.
If we assume the ecological efficiency of the
mixing, high settling rates, the production of relatively
conversion from photosynthetic products to bacteria to
refractory DOC and changes in
BGE.
be similar in the east and west and that bacteria in the
Despite the strong coupling between individual mea-
east are uslng essentially all the current primary pro-
surements of bacterial production and primary pro-
duction, this suggests that, when primary production
duction, the average integrated measurements of bac-
in the west is low, bacteria are using some additional
terial and primary production (Fig. 3) for the eastern
source of carbon. Conversely, when primary produc-
Mediterranean fall on the general relationship de-
tion is high, bacterial production in the west tends to
scribed for a range of freshwater, estuarine and marine
remains to be utilised when or where
-1.5 -1.0 -0.5 0.0 0.5 1.0 1.5
2'0
primary production is low.
LOG Primary Production (mg
C
m-3
d-l)
This decline in efficiency may occur
West:
y
= 0.4923~-
0.3365-
r = 0.780-
.
-
,..
a 0-
U m I . 0 DEast:
y
= 0 . 9 7 0 4 ~-
0.6562-
6 . 0 r = 0.793be lower than would be predicted
fromthe relation found in the east. It is
notable that the maximum primary
production in the east roughly corre-
sponds with the point of intersection of
the 2 lines.
The explanation w e would suggest
for these observations is that, when
primary production is high (exceeding
about 0.8 mg C m-3 d-l), the ecological
efficiency of its bacterial utilisation de-
clines and the excess organic carbon
Turley et al.. Primary producers and bacterid in an oligotrophic sea 17
habitats (del Giorgio et al. 1997), where there is net
heterotrophy during oligotrophy. In contrast, the west-
ern Mediterranean appears to support a biological
system in which primary production and bacterial pro-
duction are on average more balanced, despite being
decoupled in spacehime. As del Giorgio et al. (1997)
suggest, some caution is required i n such generalisa-
tions a s the averaged integrated data used in their
analysis masks the small spatial and temporal variabil-
ity as seen in our high frequency data (Fig.
3)(see also
Williams 1998). In the terms used by del Giorgio et al.
(1997), the region we have sampled in the western
Mediterranean may be regarded as in balance or
as
a
net sink of CO2, whereas the eastern Mediterranean
may be regarded as a net source, reflecting the net
autotrophic and heterotrophic oceanic provinces men-
tioned by Duarte
&Agusti (1998), respectively.
Given that the bacteria above the DCMb in the east
a r e utilising such a high proportion of the primary pro-
duction, it
isnot surprising that there is little material
remaining for the higher trophic levels and that there
is a substantial west-east decrease in vertical mass flux
which has also been linked to the increasing degree of
oligotrophy (Heussner
&~Monaco 1996, Bianchi et al.
1996). Therefore, the degree of coupling between bac-
terial and primary production, in combination with the
west-east decrease in primary production and the size
of primary producers, may determine the lower pelagic
and demersal fisheries
(W:Eratio in fish production of
2.7:l) (Caddy
&Oliver 1996), the lower vertical particle
flux
(W:E ratio about 9 : l ) (Heussner &Monaco 1996)
and consequently the lower benthic biomass
(W:E ratio
in benthic biomass between
200 and
1000 m of 4 6 : l )(Sara 1983) in the east.
Acknowledgements. Thanks to the officers and crew on the research vessels. Also thanks to B. Ayo and M. Unanue for chlorophyll data from the W Mediterranean in November 1995. Richard Geider for comments on the manuscript and Gemma Sandison and Julie Shackleford for their help with the manuscript and figures. The SeaWiFS images are cour- tesy of Gene Feldman. NASA Goddard Space Flight Center. and the Remote Sensing Group at CCIMS, Plymouth Marine Laboratory. This research was undertaken within the frame- work of the Mediterranean Targeted Project (MTP) EMPS, EUROMARGE-NB and CINCS projects supported by the European Commissions's Marine Science and Technology (MAST) Programme.
LITERATURE CITED
Azam F. Smith DC (1991) Bacterial influence on the variability in the ocean's biogeochemical state: a mechanistic view. In: Demers S (ed) Particle analysis in oceanography. NATO AS1 Ser, Vol G27. Springer-Verlag. Berlin, p 213-236 Azam F, Fenchel T, Field JG, Gray JS, Meyer-Reil LA,
Thingstad F (1983) The ecological role of water-column microbes i.n the sea. Mar Ecol Prog Ser 10.257-263
Azam F, Smith DC, Carlucci AF (1992) Bacterial transforma- tion and transport of organic matter in the Southern Cali- fornia Bight. Prog Oceanogr 30:155-166
Berland BR, Maestrini SY, Burlakova ZP, Georgieva LV, Kholodov W, Krupatkina DK (1990) Limtation de la croissance dans les eaux ultra-oligotrophes de la mer du Levant (Mediterranee orientale). Mem Biol Mar Oceanogr 18:5-28
BCthoux JP, Morin P, Madec C, Gentili B (1992) Phosphorus and nitrogen in the Mediterranean Sea: specificities and forecasting Deep-Sea Res 39.1641-1654
Bianchi M , Turley CM, Van Wambeke F, Stutt E, Chr~staki U,
Psarra S , Conan P (1996) A first, and preliminary, descrip- tion of a relationship between the cycling of the primary production by bacteria in the photic zone and the extent of particle flux measured during the MTP pilot phase. MTP News 4:B-10
Bianchi M, Eonin P, Gorsky G , Chnsten R, Poulicek M, Hofle M, Iribern J , Turley C, Prosser J , Herndl G (1997) Euro- pean rmcrob~ology of particulate systems. hlediterranean Targeted Project (MTP)-EMPS project. ln: Lipiatou E (ed) Interdisciplinary research in the Mediterranean Sea. A synthesis of scientific results from the Mediterranean tdr- geted project (MTP) phase 1, 1993-96. European Com- mission Science Research Development MAST. Research in Enclosed Seas, Ser 1, p 221-251
Caddy JF, Oliver P (1996) Some future perspectives for as- sessment and management of Mediterranean fisheries for demersal and shellfish resources, and small pelagic fish. In: JF Caddy (ed) Studies and reviews. General Fisheries Council for the Mediterranean, Rome, FAO, p 19-60 Carlson C A , Ducklow HMI (1996) Grobvth of bacterioplankton
and consumption of dissolved organic carbon in the Sar- gasso Sea. Aquat Microb Ecol 10:69-85
Chin-Leo G, Kirchman DL (1988) Estimating bacterial pro- duction in marine waters from the simultaneous incor- poration of thymidine and leucine. Appl Environ Micro- biol 54:1934-1939
Cole J J , Findlay S, Pace ML (1988) Bacterial production in fresh and saltwater ecosystems: a cross-system overview. Mar Ecol Prog Ser 43:l-10
Copin-Montegut G, Avril B (1993) Vertical distribution and temporal variation of dissolved organic carbon in the North-Western Mediterranean Sea. Deep-Sea Res 1 40: 1963-1972
Dandonneau Y, Le Bouteiller A (1992) A simple and rapid device for measuring planktonic primary production by in situ sampling, and Cl4 injection and incubation. Deep- Sea Res 39:795-803
del Giorgio PA, Cole JJ, Cimbleris A (1997) Respiration rates in bacteria exceed phytoplankton production in unpro- ductive aquatic systems. Nature 385:148-151
Duarte CM, Agusti S (1998) The CO2 balance of unproductive a q u a t ~ c ecosystems. Sclence 281:234-236
Ducklow HW, Carlson CA (1992) Oceanic bacterial produc- tion. In: Marshal1 KC (ed) Advances in microbial ecology. Plenum Press, New York, p 113-181
Dugdale RC, Wilkerson FP (1988) Nutrient sources and pri- mary production in the Eastern Mediterranean. Ocean01 Acta 9.179-184
Estrada M, Marrase C, Latasa M, Berdalet E, Delgado M. Riera T (1993) Variability of deep chlorophyll maximum characteristics in the Northwestern Mediterranean. Mar Ecol Prog Ser 92:289-300
Hagstrom
A,
Azam F, Andersson A, Wikner J, Rassoulza- degan F (1988) Microbial loop in a oligotrophic pelagic marine ecosystem: possible roles of cyanobacteria and18 Mar Ecol Prog Ser 193: 11-18, 2000
nanoflagellates in the organic fluxes. Mar Ecol Prog Ser 49:1?1-178
Heussner S, Monaco A (1996) The MTP sediment trap exper- iments: highlights on particle fluxes through the eutrophic and oligotrophlc systems of the Mediterranean Sea. In: Wassmann P, Tselepides T (eds) Second workshop of the Mediterranean Targeted Project: extended abstracts. Institute of Marine Biology of Crete, Iraklio, p 233-239 Holm-Hansen 0, Riemann B (1978) Chlorophyll a deterrnina-
tion: improvements in methodology. Oikos 30:438-447 hrchman D (1993) Microbial breathing lessons. In: Kemp PF,
Sherr BF, Sherr EB, Cole J J (eds) Handbook of methods in aquatic microbial ecology. Lewis Publishers, Boca Raton, p 509-512
Kirchman DL, Suzuki Y, Garside C, Ducklow HW (1991) High tornover rates of dissolved organic carbon during a spring phytoplankton bloom. Nature 352512-614
Krom MD, Kress N, Brenner S, Gordon L1 (1991) Phosphorus hutation of primary productivity in the eastern Medi- terranean Sea. Lirnnol Oceanogr 36:424-432
Lee S, Fuhrman JA (1987) Relationship between biovolume and biomass of naturally derived bacterioplankton. Appl Environ Microbiol 53:1298-1303
Lefhvre D, Minas HJ, Minas M, Robinson C, Williams PJLeB, Woodward EMS (1997) Review of gross community pro- duction, primary production, net community production and dark respiration in the Gulf of Lions. Deep-Sea Res 44.801-832
M&an JD, Jeftic L, Sestini G (1992) The Mediterranean Sea and climate change-an overview. In: Jeftic L, Milliman JD, Sestini G (eds) Climatic change and the Mediterra- nean. Edward Arnold, London, p 1-14
Minas M, Minas HJ (1989) Primary production in the Gulf of Lions with considerations to the Rhone River inputs. In: Martin JM, Barth H (eds) CEC Water Poll Res Rep 13: 112-125
Myklestad S (1977) Production of carbohydrates by marine planktonic diatoms. 11. Influence of the N/P ratio in the growth medium on the assimilation ratio, growth rate, and production of cellular and extracellular carbohydrates by Chaetoceros affjm's Var. Willei (Gran) Hustedt and Skele- tonema costatum (Grev.) Cleve. J Exp Mar Biol Ecol 29: 161-179
Porter KG. Feig YS (1980) The use of DAPI for identifying and counting aquatic microflora. Limnol Oceanogr 25: 943-948
Pujo-Pay M, Conan P, Raimbault P (1997) Excretion of dis- Editorial responsibility: Otto Kinne (Editor),
Oldendorf/Luhe, Germany
solved organic nitrogen in the North Western Medlter- ranean Sea. Mar Ecol Prog Ser 153:99-111
Raimbault P, Taupier-Letage I, Rodier M (1988) Vertical size distribution of phytoplankton in the eastern Mediterranean Sea during early summer. Mar Ecol Prog Ser 45:153-158 Rivkin RB. Anderson MR (1997) Inorganic nutrient limitation of oceanic bacterioplankton. Lirnnol Oceanogr 42:730-740 Sara M (1983) Ecological factors and their biogeographic con-
sequences in the Mediterranean ecosystems. In: Morai- tou-Apostolopoulou M, Kiortsis V (eds) Mediterranean marine ecosystems. NATO Scientific Series, Series I: 8. Ecology. Plenum Press, London, p 1-18
Steemann-Nielsen EJ (1953) The use of radio-active carbon
(Cl4) for measuring organic production in the sea. Cons Perm Int Explor Mer 18:117-140
Thingstad TF, Hagstrom A, Rassoulzadegan F (1997) Accu- mulation of biodegradable DOC in surface waters: is it caused by a malfunctioning microbial loop? Limnol Oceanogr 42:398-404
Thingstad TF, Rassoulzadegan F (1995) Nutrient limitations, microbial food webs, and 'biological C-pumps': suggested interactions in a P-limited Mediterranean. Mar Ecol Prog Ser 11?:299-306
Tselepides A, Chronis G, de Wilde PAWJ, Duineveld G, Rice A, Bett B, Wassman P, Della Croce N, Danovaro R, Eleftheriou (1997) Pelagic-benthic coupling in the oligo- trophic Cretan Sea. Mediterranean Targeted Project (MTP)-CINCS Project. In: Lipiatou E (ed) Interdisciplinary research in the Mediterranean Sea. A synthesis of scien- tific results from the Mediterranean Targeted Project (MTP) phase 1. 1993-96. European Commission Science Research Development MAST. Research in Enclosed Seas Ser 1, p 253-296
Turley CM. Hughes DJ (1992) Effects of storage on direct esti- mates of bacterial numbers of preserved seawater sam- ples. Deep-Sea Res 39:375-394
Turley CM, Borsheim K, Iriberri J , Prosser J (1996) The esti- mation of bacterial biomass in Mediterranean seawater. In: Turley CM (ed) The handbook of method protocols for the quality assurance pilot study of selected methods used in the Mediterranean Targeted Project. CEC-MAST Office, Brussels, p 27-34
Williams PjleB (1998) The balance of plankton respiration and photosynthesis in the open oceans. Nature 39455-57 Yentch CS, Menzel DW (1963) A method for the determina-
tion of phytoplankton chlorophyll and phaeophytin by fluorescence. Deep-Sea Res 10:221-231
Submitted: April 21, 1999; Accepted: July 23, 1999