HAL Id: hal-00316233
https://hal.archives-ouvertes.fr/hal-00316233
Submitted on 1 Jan 1996
HAL is a multi-disciplinary open access
archive for the deposit and dissemination of sci-entific research documents, whether they are pub-lished or not. The documents may come from teaching and research institutions in France or abroad, or from public or private research centers.
L’archive ouverte pluridisciplinaire HAL, est destinée au dépôt et à la diffusion de documents scientifiques de niveau recherche, publiés ou non, émanant des établissements d’enseignement et de recherche français ou étrangers, des laboratoires publics ou privés.
Gravity wave signatures at mesopause heights
R. Rüster, P. Czechowsky, P. Hoffmann, W. Singer
To cite this version:
R. Rüster, P. Czechowsky, P. Hoffmann, W. Singer. Gravity wave signatures at mesopause heights. Annales Geophysicae, European Geosciences Union, 1996, 14 (11), pp.1186-1191. �hal-00316233�
Received: 18 March 1996/Revised: 5 June 1996/Accepted: 6 June 1996
Abstract. The ALOMAR SOUSY Radar operated at 53.5 MHz has been used in a five-beam configuration to study dynamical processes at gravity wave periods in the summer polar mesosphere. A case study of a gravity wave with a period of about 9 min is presented and analysed in some detail. The three-dimensional wave number vector is determined from the phase information of the 9-min velo-city oscillations obtained in all beam directions and all range gates. The horizontal wavelengths in the north and east direction are estimated to be about 60 and 50 km, respectively. The echo power variations, simultaneously observed at different beam pointing positions, are investi-gated using cross—correlation analysis. The results show that these wave—associated variations lead to horizontal and vertical deformation of the echoing layers. The hori-zontal wavelength in the north-south direction, derived from the echo power modification, is in good agreement with the one obtained from the velocity analysis.
1 Introduction
It is well known that gravity waves play an important role in the dynamical behaviour of the middle atmosphere (e.g. Vincent, 1984; Reid, 1986; Vincent and Fritts, 1987). For studying these kind of processes at different temporal and spatial scales, VHF radars are powerful tools (e.g. Wood-man and Guillen, 1974; Schmidt et al., 1979; Balsley and Gage, 1980; Tsuda et al., 1990; Ru¨ster et al., 1986; Thomas et al., 1992). Using the ALOMAR SOUSY Radar (Singer et al., 1995), a successor of the mobile SOUSY VHF Radar (Czechowsky et al., 1984), measurements have been car-ried out near Andenes in northern Norway (69°N, 16°E) in the summer of 1994 during the ECHO-94-Campaign (e.g. Lu¨bken et al., 1996) to investigate gravity waves in the summer polar mesosphere. Preliminary results have
Correspondence to: R. Ru¨ster
been discussed by Ru¨ster et al. (1995). The radar was operated at a frequency of 53.5 MHz, corresponding to a wavelength of about 6 m. The peak pulse power used during the observational period was 150 kW and the duty cycle 4%. The range resolution used in the measurements presented here was 300 m. The phased antenna array consists of 148 four-element Yagis. The resulting main beam with a one-way-beam width of 6.5° was sequentially steered into five independent positions: vertically (V), and at 8° off-zenith towards north (N), east (E), south (S) and west (W). In each position measurements were made for about 6.4 s such that one cycle lasted 32 s. The pulses were phase coded using a 16-bit complementary code.
2 Observational results
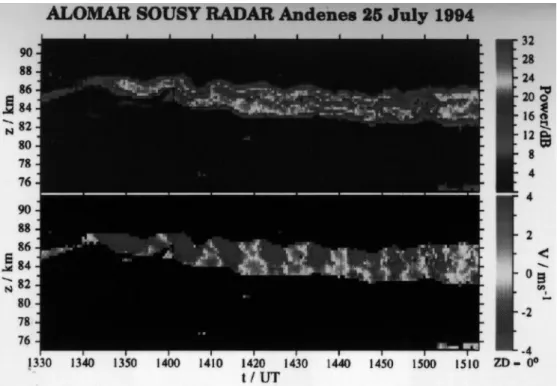
VHF radar echoes from the mesosphere at high latitudes in summer are known to be very strong (e.g. Carter and Balsley, 1982; Czechowsky et al., 1989; Ru¨ster and Reid, 1990). These polar mesosphere summer echoes (PMSE) on average occur between about 80 and 90 km, centred around 86 km. An overview of the observations and a dis-cussion of possible generation mechanisms is given by Cho and Kelley (1993). These PMSE greatly facilitate the continuous observation of gravity waves at mesopause heights. One particularly interesting example of such a wave event is presented in Fig. 1. It shows in a colour intensity plot the signal-to-noise ratio (upper panel) and the radial velocity (lower panel) as a function of height and time, obtained from measurements with a vertically pointing antenna beam. The echo intensity exhibits strong temporal and spatial variations, and the vertical velocity shows pronounced periodic oscillations with a period of about 9 min which will be subject to a subsequent detailed analysis.
2.1 Wave structures in the velocity field
The time series of the radial velocities measured in the vertically pointing beam are presented in Fig. 2. Velocities
Fig. 1. Height-time intensity plots of the signal-to-noise ratio (upper part) and the radial velo-city (lower part) measured in the vertically pointing beam
Fig. 2. Low-pass-filtered time series of the vertical velocity at heights between 82 and 88 km, starting at 1340 UT (missing data are due to low signal-to-noise ratio)
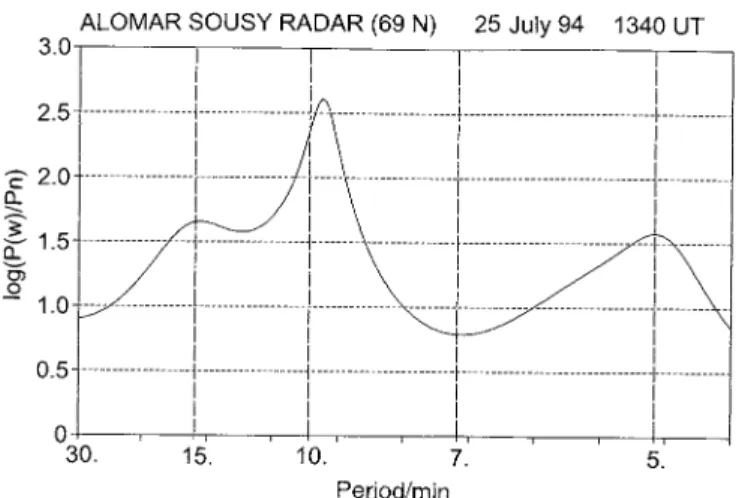
have only been derived from the measurements if the signal-to-noise ratio exceeded a level of 2 dB. For reasons of clarity in the presentation the velocities have been low-pass filtered, with the 3-dB point of the filter being at 4 min. Due to the filtering, parts of the original data are missing in this plot. The results clearly reveal the presence of periodic oscillations at all range gates. The phase pro-gression with height indicates a propagating wave. In order to determine accurately the period of the wave, the maximum entropy method has been applied to the unfil-tered velocity time series. As an example, Fig. 3 shows the resulting spectrum for a height of 86 km. The dominating period is 9.6 min. The same procedure has been used to analyse the respective measurements in the oblique beams, confirming the same wave period.
When studying the various wave parameters, the height variations of amplitude and phase of the wave are impor-tant quantities. Due to unavoidable gaps in the data, harmonic fitting procedures instead of Fourier transforms have been applied. Figure 4 shows the resulting height profiles of amplitude and phase of the 9.6-min wave, obtained from the original unfiltered data measured in the vertically pointing beam. The fitting procedure has been applied where at least 1/3 of the data is available. This relatively low limit may influence the estimate of the amplitude but hardly the phase, as can be seen in Fig. 4. The decrease of the amplitude above about 86.2 km, in-dicated by a dashed line, seems to be due to this effect. The phase, however, which later will be used for determining the wave number vector, seems not to be affected.
Fig. 4. Height profiles of amplitude and phase of the vertical velocity for the 9.6-min wave. The dashed curves represent the 90% significance levels
Fig. 3. Maximum entropy spectrum of the vertical velocity mea-sured at a height of 86 km for the 90-min observational period, starting at 1340 UT
plitudes at the respective range gates. From the total phase information /(x, y, z) at all beams and all range gates, the three-dimensional wave number vector of the
total data set has been subdivided into three equal parts. For each the same analysis has been carried out, yielding three sets of wavelength values. The resulting standard deviations for the horizontal components are about 10 km, and 20 km for the vertical component. This latter value, which does not affect the final conclusion, may result from the small height interval of 4 km only, as well as from the fact that the vertical wave number might be expected to vary with altitude at mesopause heights due to temperature changes. A division of the data set into more than three parts has not been chosen in order to avoid too short data sets for the sine fitting procedures. The results are further supported by a second approach in estimating the horizontal wavelength values by only using the res-pective phases from coplanar beam measurements.
2.2 Associated variations in the radar echo intensity
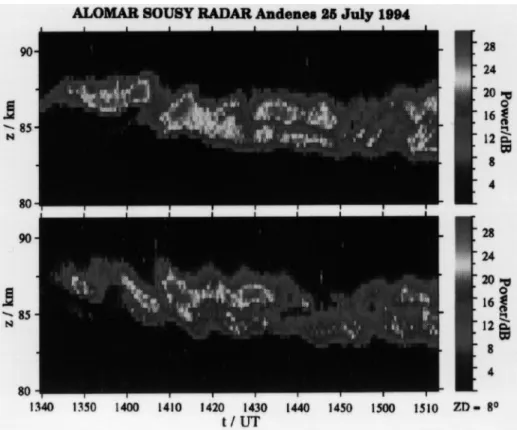
In addition to the wave-induced velocity oscillations discussed already, it is interesting to note that the signal-to-noise ratio also undergoes spatial and temporal variations. Figure 5 presents in a colour intensity plot the signal-to-noise ratios as a function of height and time
Fig. 5. Intensity plots of the signal-to-noise ratio as a function of height and time observed in the northward (upper
part) and the southward (lower part)
directed beam for the 90-min observa-tional period
Fig. 6. Temporal variation of the height of the echo power max-imum observed in the northward (upper part) and the southward (lower part) directed beam for the 90-min observational period, starting at 1340 UT
received in the northward (upper panel) and the south-ward (lower panel) pointing beam. By comparing both plots it becomes evident that the variations are approxi-mately in antiphase. This relationship is particularly clear between about 1358—1405 UT, 1408—1415 UT, and 1418—1425 UT. During these periods the height of the peak intensities increases in the northward-pointing beam and at the same time decreases in the southward-pointing beam.
For a more accurate analysis the height zmax of the maximum signal-to-noise ratio has been determined for each time step and both beam directions. The results are shown in Fig. 6. Where zmax could not be determined unambiguously, no data are plotted. The periodic struc-ture is -clearly visible, thereby reflecting the influence of the gravity wave on the temporal and spatial variation of the radar echo intensity. Apart from the gravity wave, additional temporal variations of different origin are superimposed, which may slightly mask the dominant 9.6-min oscillation. Additional confirmation of the sugges-ted variation in the meridional plane is provided by the respective variation of the signal-to-noise ratio observed in the vertically pointing beam as shown in Fig. 1 (upper panel). The temporal variation of the height of the peak intensity fits between the respective curves for the north-ward- and southnorth-ward-pointing beams shown in Fig. 6.
A possible, and most likely, explanation has been sum-marised schematically in Fig. 7. In order to demonstrate the effect more clearly the sketch is not to scale. The mesospheric echoing layers (or PMSE-structures) may undergo strong modifications by atmospheric waves as observed in the velocity field. If in particular, the distance
Fig. 7. Schematic sketch of the variation of the height of the echo power maximum in the meridional plane for five consecutive time steps
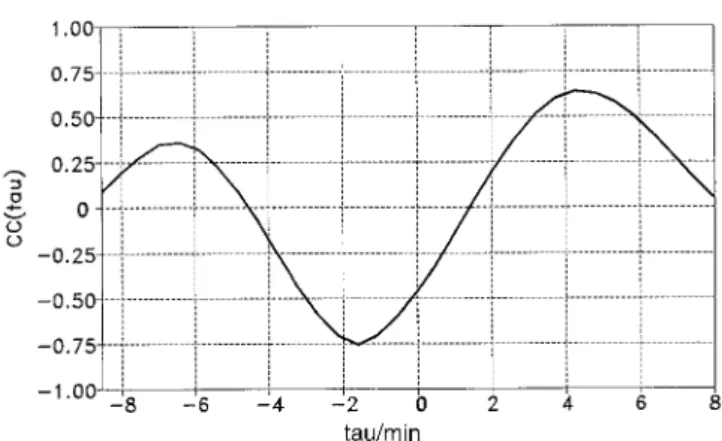
between two coplanar beams is comparable to half the horizontal wavelength, i.e., the phase differences are close to 180°, as observed, a bending of the layers may occur as shown in Fig. 7. Consequently, the height zmax at which the signal-to-noise ratio has its maximum may vary with the period of the wave, as demonstrated in the time steps 1 to 5 in the sketch. Figure 8 presents the cross-correlation function of the two time series zmax(t) shown in Fig. 6 for the time interval from 15 to 50 min after linear trends have been removed. From the distance D between the two beams and the times of the minimumqmi and maximum qma of the cross—correlation function, the horizontal wavelengthjy in this direction can be estimated:
jy 2" D 1# qmi qma!qmi . (2)
With D"24 km,qmi"!1.6 min, and qma"4.2 min, the wavelengthjy in the meridional direction becomes 66 km. This value is in good agreement with that of 60 km, calculated from the phases of the velocities.
The maximum tilt angle sm of the layer can be esti-mated from
tgsm"w0
u ky, (3)
where w0+2—3 m/s is the average wave amplitude of the vertical velocity, u the wave frequency (2n/¹ ; ¹"9.6 min) and ky the wave number in the north-south direction (2n/jy; jy"60 km). The resulting angle of about 1° is small compared to the radar beam width of 6.5°. Additional power variations due to tilt angle changes, therefore, are not significant.
3 Concluding remarks
Using multibeam configurations of VHF radars with at least five independent beam pointing positions, gravity waves in the velocity field, their signatures in the signal-to-noise ratios, as well as their possible interrelation can be studied in detail. They are frequently observed in the mesosphere and hence contribute essentially to the dy-namical behaviour of the mesopause region (e.g. Vincent and Reid, 1983). Wave-induced perturbations of the echo-ing layers at mesopause heights observed with VHF radars can lead to strong asymmetries in the measure-ments obtained at coplanar beam pairs. The estimation of those quantities for which horizontal homogeneity is required (e.g. horizontal wind), therefore, can only be derived for averaging periods that are large enough compared to the respective wave periods.
Acknowledgements. The authors thank the staff of the Andoya
Rocket Range as well as the engineers and technicians of the Insti-tute for Atmospheric Physics and the Max-Planck-InstiInsti-tute for Aeronomy for their assistance in obtaining the radar measurements. Additional thanks are due to the referees for very valuable com-ments and to Dr. J. Klostermeyer for fruitful discussions.
Topical Editor F. Vial thanks L. Thomas and another referee for their help in evaluating this paper.
References
Balsley, B. B., and K. S. Gage, The MST radar technique: potential for middle atmospheric studies, Pure Appl. Geophys., 118, 452—493, 1980.
Bartels, J., Zufallszahlen fu¨r statistische Zwecke, Ann. Meteorol., 1, 209, 1948.
Carter, D. A., and B. B. Balsley, The summer wind field between 80 and 93 km observed by the MST radar at Poker Flat, Alaska (65°N), J. Atmos. Sci., 39, 2905—2915, 1982.
Cho, J. Y. N., and M. C. Kelley, Polar mesosphere summer radar echoes: observations and current theories, Rev. Geophys., 31, 243—265, 1993.
CIRA, COSPAR International Reference Atmosphere, Akademie, Berlin, 1972.
Czechowsky, P., G. Schmidt, and R. Ru~ ster, The mobile SOUSY Doppler radar: technical design and first results, Radio Sci., 19, 441— 450, 1984.
Czechowsky, P., I. M. Reid, R. Ru~ ster, and G. Schmidt, VHF radar-echoes observed in the summer and winter polar mesosphere over Andoya, Norway, J. Geophys. Res., 94, 5199 —5217, 1989. Lu~ bken, F.-J., K.-H. Fricke, and M. Langer, Noctilucent clouds and
the thermal structure near the Arctic mesopause in summer,
J. Geophys. Res., 101, 9489—9508, 1996.
Reid, I. M., Gravity-wave motions in the upper middle atmosphere (60—110 km), J. Atmos. ¹err. Phys., 48, 1057—1072, 1986. Ru~ ster, R., and I. M. Reid, VHF radar observations of the dynamics
of the summer polar mesopause region, J. Geophys. Res., 95, 10,005—10,016, 1990.
Ru~ ster, R., J. Klostermeyer, and J. Ro~ttger, SOUSY VHF radar measurements in the lower and middle atmosphere, IEEE ¹rans.
Geosci. Remote Sensing, GE-24, 966 — 974, 1986.
Ru~ ster, R., P. Czechowsky, P. Hoffmann, and W. Singer, First results of mesospheric structures and dynamics observed with the ALOMAR SOUSY radar, Proc. of the 12th ESA Symp.,
¸illeham-mer, ESA. sp-370, 67—71, 1995.
Schmidt, G., R. Ru~ ster, and P. Czechowsky, Complementary code and digital filtering for detection of weak VHF radar signals from the mesosphere, IEEE ¹rans. Geosci. Electron, GE-17, 154 —161, 1979.
Singer, W., D. Keuer, P. Hoffmann, P. Czechowsky, and G. Schmidt, The ALOMAR SOUSY radar: technical design and further de-velopments, Proc. of the 12th ESA Symp., ¸illehammer, ESA sp-370, 409 — 415, 1995.
Thomas, L., I. Astin, and I. T. Prichard, The characteristics of VHF echoes from the summer mesopause region at mid-latitudes,
J. Atmos. ¹err. Phys., 54, 969—977, 1992.
Tsuda, T., S. Kato, T. Yokoi, T. Inoue, M. Yamamoto, T. E. Van Zandt, S. Fukao, and T. Sato, Gravity waves in the meso-sphere observed with the MU radar, Radio Sci., 26, 1005—1018, 1990.
Vincent, R. A., Gravity-wave motions in the atmosphere, J. Atmos. ¹err. Phys., 46, 119—128, 1984.
Vincent, R. A., and D. C. Fritts, A climatology of gravity-wave motions in the mesopause at Adelaide, Australia, J. Atmos. Sci., 44, 748—760, 1987.
Vincent, R. A., and I. M. Reid, VHF Doppler measurements of mesospheric gravity wave momentum fluxes, J. Atmos. Sci., 40, 1321—1333, 1983.
Woodman, R. F., and A. Guillen, Radar observations of winds and turbulence in the stratosphere and mesosphere, J. Atmos. Sci., 31, 493—505, 1974.
.