HAL Id: insu-02433197
https://hal-insu.archives-ouvertes.fr/insu-02433197
Submitted on 4 Mar 2021
HAL is a multi-disciplinary open access
archive for the deposit and dissemination of
sci-entific research documents, whether they are
pub-lished or not. The documents may come from
teaching and research institutions in France or
abroad, or from public or private research centers.
L’archive ouverte pluridisciplinaire HAL, est
destinée au dépôt et à la diffusion de documents
scientifiques de niveau recherche, publiés ou non,
émanant des établissements d’enseignement et de
recherche français ou étrangers, des laboratoires
publics ou privés.
B. Franco, Lieven Clarisse, T. Stavrakou, Jean-françois Müller, Domenico
Taraborrelli, Juliette Hadji-Lazaro, J.W. Hannigan, F. Hase, Daniel
Hurtmans, N. Jones, et al.
To cite this version:
B. Franco, Lieven Clarisse, T. Stavrakou, Jean-françois Müller, Domenico Taraborrelli, et al..
Spaceborne Measurements of Formic and Acetic Acid: A Global View of the Regional Sources.
Geophysical Research Letters, American Geophysical Union, 2020, 47 (4), pp.e2019GL086239.
�10.1029/2019GL086239�. �insu-02433197�
B. Franco1 , L. Clarisse1 , T. Stavrakou2, J.-F. Müller2, D. Taraborrelli3 , J. Hadji-Lazaro4, J. W. Hannigan5 , F. Hase6, D. Hurtmans1, N. Jones7 , E. Lutsch8 , E. Mahieu9, I. Ortega5 , M. Schneider6, K. Strong8 , C. Vigouroux2, C. Clerbaux1,4 , and P.-F. Coheur1
1Université libre de Bruxelles (ULB), Spectroscopy, Quantum Chemistry and Atmospheric Remote Sensing
(SQUARES), Brussels, Belgium,2Royal Belgian Institute for Space Aeronomy, Brussels, Belgium,3Institute of Energy
and Climate Research, Forschungszentrum Jülich GmbH, Jülich, Germany,4LATMOS/IPSL, Sorbonne Université, UVSQ, CNRS, Paris, France,5National Center for Atmospheric Research, Boulder, CO, USA,6Institute for Meteorology
and Climate Research (IMK-ASF), Karlsruhe Institute of Technology (KIT), Karlsruhe, Germany,7School of Chemistry,
University of Wollongong, Wollongong, New South Wales, Australia,8Department of Physics, University of Toronto,
Toronto, Ontario, Canada,9Institute of Astrophysics and Geophysics, University of Liège, Liège, Belgium
Abstract
Formic (HCOOH) and acetic acids (CH3COOH) are the most abundant carboxylic acids inthe Earth's atmosphere and key compounds to aqueous-phase chemistry. Here we present the first distributions of CH3COOH retrieved from the 2007–2018 satellite observations of the nadir-looking infrared atmospheric sounding interferometer (IASI), using a neural network-based retrieval approach. A joint analysis with the IASI HCOOH product reveals that the two species exhibit similar distributions, seasonality, and atmospheric burden, pointing to major common sources. We show that their abundance is highly correlated to isoprene and monoterpenes emissions, as well as to biomass burning. Over Africa, evidence is provided that residual smoldering combustion might be a major driver of the HCOOH and CH3COOH seasonality. Earlier seasonal enhancement of HCOOH at Northern Hemisphere middle and
high latitudes and late seasonal secondary peaks of CH3COOH in the tropics suggest that sources and
production pathways specific to each species are also at play.
1. Introduction
Formic (HCOOH) and acetic acids (CH3COOH) are the primary atmospheric acids contributing to the cloud and rainwater acidity in remote environments (Galloway et al., 1982; Keene et al., 2015). They affect the oxi-dant concentrations and the pH-dependent reaction rates in cloud water (Chameides & Davis, 1983; Jacob, 1986; Vet et al., 2014). Due to the mitigation of the anthropogenic emissions of inorganic acid precursors like nitrogen (NOx) and sulfur oxides (SOx), the cloud and precipitation acidity is expected to be increas-ingly steered by organic acids (Galloway et al., 1982; Keene et al., 2015). Also present in the aerosol phase as formate and acetate ions, these organic acids serve as substrates for the formation of effective cloud conden-sation nuclei (Yu, 2000). Current knowledge indicates that the global sources of HCOOH and CH3COOH
are dominated by atmospheric photochemical production via the sunlight-induced degradation of biogenic, anthropogenic, and biomass burning precursors (Khan et al., 2018; Millet et al., 2015; Müller et al., 2019; Paulot et al., 2011; Stavrakou et al., 2012). In particular, oxidation by the hydroxyl radical (OH) and ozonoly-sis of isoprene and several monoterpenes are thought to be the main formation pathways. The contribution from HCOOH and CH3COOH direct emissions is estimated not to exceed ∼30% of the total sources (Müller
et al., 2019; Paulot et al., 2011).
However, state-of-the-art global models incorporating the known emissions and secondary sources under-predict the measured atmospheric abundance of HCOOH and CH3COOH (Ito et al., 2007; Khan et al., 2018;
Millet et al., 2015; Paulot et al., 2011; Stavrakou et al., 2012; von Kuhlmann et al., 2003). Since both acids are by-products of major biogenic hydrocarbons like isoprene and monoterpenes, these discrepancies might point to large gaps in our understanding of the atmospheric reactive carbon oxidation chains, and/or to the existence of one or several as-yet-unidentified source(s) of organic acids. In this framework, continuous and homogeneous global satellite observations may provide information on the nature of the missing sources and more constraints on their atmospheric budget. For instance, the first global distributions of HCOOH
Key Points:
• First atmospheric distributions of acetic acid are obtained from IASI/Metop observations • In emission regions, formic and
acetic acids highly correlate with each other and with biogenic hydrocarbon emissions and biomass burning
• Residual smoldering combustion appears to be a major driver of the formic and acetic acids seasonality in Africa Supporting Information: • Supporting Information S1 Correspondence to: B. Franco, bfranco@ulb.ac.be Citation:
Franco, B., Clarisse, L., Stavrakou, T., Müller, J.-F., Taraborrelli, D., Hadji-Lazaro, J., et al. (2020). Spaceborne measurements of formic and acetic acids: A global view of the regional sources. Geophysical Research
Letters, 47, e2019GL086239. https:// doi.org/10.1029/2019GL086239
Received 14 NOV 2019 Accepted 4 JAN 2020
Accepted article online 8 JAN 2020
©2020. American Geophysical Union. All Rights Reserved.
(Pommier et al., 2016; Razavi et al., 2011) obtained from the nadir-looking Infrared Atmospheric Sounder Interferometer (IASI) satellite sensors (Clerbaux et al., 2009) and assimilated by the chemistry-transport model IMAGES, led to the identification of sizeable missing sources of HCOOH from the tropical and boreal forests (Stavrakou et al., 2012). The CH3COOH budget remains less constrained since, until now, CH3COOH
has only been detected in IASI spectra recorded in exceptionally large fire events (Clarisse et al., 2011; Coheur et al., 2009). Its retrieval at large scale has so far not been attempted, due to the weak CH3COOH
signature in the thermal infrared spectral range.
The development of the retrieval algorithm Artificial Neural Network for IASI (ANNI), version 3, recently allowed flexible retrievals for a suite of oxygenated volatile organic compounds (OVOCs) from the IASI observations (Franco et al., 2018, 2019), including new, robust daily global distributions of HCOOH columns. Relying on the ANNI framework, here we also perform the retrieval of CH3COOH vertical abundance
throughout the observational time series of IASI/Metop–A (since 2007) and –B (since 2013). We present, for the first time, large scale daily maps of CH3COOH total columns from space, which we use to characterize the regional sources and seasonal variability of this compound. We also investigate the spatial correlations and ratios between the HCOOH and CH3COOH columns. Finally, regional time series of both species are studied alongside terrestrial biogenic emission fluxes and a biomass burning tracer.
2. Methods and Data
2.1. CH3COOH Detection in IASI Spectra
In the thermal infrared spectral range, the main absorption feature of CH3COOH away from water vapor
interferences corresponds to its𝜈8 band (CO stretching mode) in the 1,120–1,220 cm−1spectral window.
This broad absorption band has already been identified in IASI spectra recorded during strong fire events in Eastern Siberia (Coheur et al., 2009) and the 2009 Australian bushfires (Clarisse et al., 2011). To demonstrate the detection of CH3COOH with IASI outside fire plumes, we selected over regional sources (section 3)
IASI spectra with a high CH3COOH spectral index (see section 2.2), avoiding the fire plumes. This was done by filtering out measurements with elevated concentrations of biomass burning tracers, like carbon monoxide (CO) and ammonia (NH3). Examples are presented in supporting information Figure S10, which
demonstrate the presence of the CH3COOH signature in IASI spectra. The spectral demonstration follows
the same approach as Coheur et al. (2009), which consists in reconstructing the observed spectra successively with and without accounting for CH3COOH, the difference between the spectra visualizing the target gas
signature (see Figure S10 for details).
2.2. Neural Network Retrieval
Retrieval of CH3COOH using traditional physical inversion is nonetheless very challenging to perform at the global scale, primarily due to the broadband, low-intensity CH3COOH absorption, and because of the presence in that spectral range of other broadband absorbers like PAN and acetone. Moreover, the difficulty of forward models to simulate accurately atmospheric infrared spectra over large spectral ranges constitutes an additional hindrance for the retrieval of such trace gases. Here, we adapt the ANNI retrieval method, initially developed for the retrieval of NH3(Van Damme et al., 2017; Whitburn et al., 2016) and dust (Clarisse
et al., 2019) from IASI observations, and which has recently allowed global retrieval of HCOOH, methanol, PAN, and acetone (Franco et al., 2018, 2019). For the CH3COOH retrieval performed here, we follow closely the ANNI v3 procedure (Franco et al., 2018), for which an extended overview—including the steps and evaluation specific to CH3COOH—are provided in section 1 of the supporting information.
The ANNI retrieval method relies on two elements. The first is the so-called hyperspectral range index (HRI), which quantifies for each spectrum the magnitude of the target gas absorption in a given spectral range. Detection methods based on an HRI are typically much more sensitive than other detection methods, as the HRI can exploit the full information content of all spectral channels contained in a broad spectral range (Clarisse et al., 2013; Walker et al., 2011; Whitburn et al., 2016). Another advantage is that the HRI has a weak dependence on the forward model as it is only used for the calculation of a Jacobian (the covariance matrix can be estimated from real observed IASI spectra). In particular, using the HRI to quantify the absorption avoids relying on a full reconstruction of the spectrum and all the associated problems.
The other element of ANNI is a feedforward neural network (NN), which is used to convert the unitless HRI into a gas column abundance. While the HRI provides the ANNI method with its sensitivity to the
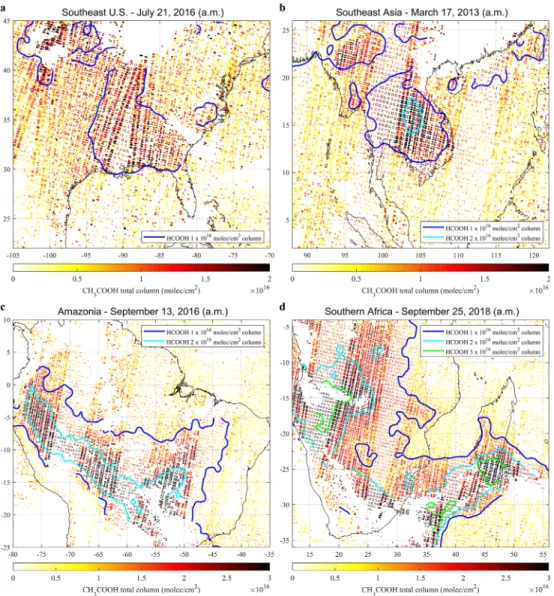
Figure 1. Regional CH3COOH total column enhancements derived from individual days of IASI/Metop–A and –B
observations (a.m. overpasses). The shape of each dot corresponds to the footprint on ground of an individual IASI measurement. The IASI/Metop–A and –B HCOOH column levels are displayed in contour lines.
target gas, the accuracy of the retrieval is brought by the NN that models as accurately as possible the func-tional relationship between the HRI and the target gas column. NNs are increasingly used for satellite data inversion as a robust, computationally efficient alternative to physical approaches (e.g., Aires et al., 2002; Di Noia et al., 2015; Müller et al., 2003; Piscini et al., 2014). They have the ability to accurately approximate complex systems at a fraction of the original computational cost. For this reason, they can replace atmo-spheric models and radiative transfer models (Krasnopolsky et al., 2005), which is the case here. Moreover, the NN computing efficiency permits the processing of the entire IASI/Metop–A and –B observational time series. Other advantages of the ANNI retrieval scheme are specifically discussed by Clarisse et al. (2019) and Whitburn et al. (2016).
Examples of regional CH3COOH (and superimposed HCOOH) column distributions from individual days of
IASI/Metop–A and –B observations are shown in Figure 1. The areas without data are due to measurements excluded because of clouds or poor retrieval performance. These distributions illustrate enhancements over Southeast United States and Southeast Asia (Figures 1a–1b) and transported plumes originating from Amazonia and Southern Africa (Figures 1c–1d), with column values of 0.3–0.4 × 10¹⁶molec/cm2in remote
regions and 1.5–3 × 10¹⁶molec/cm2over source areas and in the middle of the plumes. Note the strong
typically range between 2 and 8 × 10¹⁵molec/cm2, whereas the HCOOH uncertainties are a factor 2–3 lower
(Figures S11–S12).
Independent column measurements of HCOOH are unfortunately sparse and do not even exist for CH3COOH. We nonetheless provide in section 2 of the supporting information a first comparison between
the IASI products, HCOOH total columns derived from ground-based Fourier transform infrared (FTIR) observations made at Network for the Detection of Atmospheric Composition Change (NDACC) sites, and CH3COOH columns calculated from composite aircraft-model profiles. For HCOOH, these initial
compar-isons indicate a good agreement at most FTIR sites (with correlation coefficients usually higher than 0.6) and also biases at high-altitude stations or uncaptured local enhancements that will require further inves-tigations. For CH3COOH, these comparisons are relatively inconclusive because of the lack and limited
representativity of the comparison data, as well as the many uncertainties that are propagated throughout the comparison process.
2.3. Biogenic Emission Fluxes and Fire Data
Hereafter, the correlations between biogenic hydrocarbon emissions, biomass burning, and the HCOOH and CH3COOH seasonal cycle are investigated. To represent the emissions of their main biogenic precursors, we use the fluxes of isoprene and monoterpenes—lumped together—calculated by the Model of Emissions of Gases and Aerosols from Nature (MEGAN; Guenther et al., 2012) coupled with the MOdel of HYdrocarbon emissions by the CANopy (MOHYCAN; Bauwens et al., 2018; Müller et al., 2008). To account for biomass burning, we rely on the detected fire radiative power (FRP) taken from the Level 2 Fire Products, Collec-tion 6, of the MODerate resoluCollec-tion Imaging Spectroradiometer (MODIS) onboard the NASA Terra and Aqua satellites (Giglio et al., 2006). From this data set, we have computed monthly cumulative FRP by summing up all the individual fire contributions over specific areas. This quantity is a better indicator of the integrated biomass combustion than, for example, the fire count (which disregards the fire magnitude) or the average FRP (which ignores the number of fires).
3. Results
3.1. HCOOH and CH3COOH Distributions
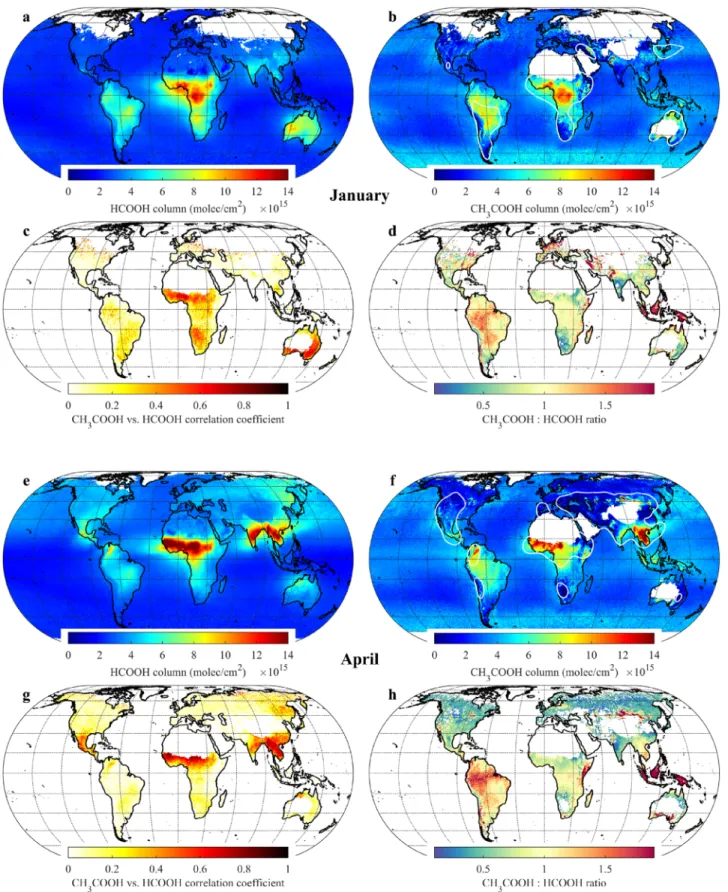
Monthly global distributions of HCOOH and CH3COOH total columns, computed over the 2007–2018
IASI/Metop–A time series, are presented for January, April, July, and October in Figures 2–3 (all months are displayed in Figures S13–S14). Compared to the other OVOCs retrieved from IASI, the CH3COOH
prod-uct is noisier and more sensitive to local spurious biases related to, for example, deserts, clouds, or water vapor. In addition, the CH3COOH signal is relatively close to the detection threshold, especially over remote
areas (∼3–5 × 10¹⁵molec/cm2for individual observations). Therefore, the applied post-filter was chosen
quite conservatively. For instance, most of the observations above Europe are removed during winter. How-ever, even with this filter in place, small biases over land can still be present (e.g., in the Gobi desert) and the data over sea exhibit local spurious features due to persistent cloud coverage (e.g., around Antarctica). For these reasons also, the analysis focuses hereafter on regions with large CH3COOH enhancements.
Typ-ically, those are included in the areas delimited by the white contour lines in Figures 2–3 and S14, which correspond to the areas where the absolute uncertainty on a single-measurement basis (Figure S15) is below 5 × 10¹⁵molec/cm2or where the relative uncertainty (Figure S16) does not exceed 100%. Provided that the
measurements are not systematically biased, note that the actual data uncertainties are significantly lower owing to the numerous IASI measurements that are averaged in these CH3COOH distributions. Outside
these areas, the confidence in the measurement is lower. It is worth mentioning that HCOOH is not affected to the same degree by these issues. Figures 2–3 also provide, for each month and over the 2007–2018 time period, the spatial correlation coefficients (R) between the daily HCOOH and CH3COOH column time
series, and the CH3COOH:HCOOH column ratios.
The HCOOH and CH3COOH distributions exhibit strong continental enhancements which primarily take
place in isoprene- and monoterpenes-dominated environments, namely, the tropical forests, Southeast Asia in spring, and Southeast United States and the boreal forests in summer (Figures 2–3). This is consistent with the major photochemical production pathways already identified for these acids that are the ozonolysis of VOCs with a double-bond moiety (Calvert & Stockwell, 1983; Neeb et al., 1997), the OH-oxidation of enol compounds (Lei et al., 2018; So et al., 2014) originating from acetaldehyde (Andrews et al., 2012) and isoprene by-products (e.g., Liu et al., 2018), and the reactions of the peroxyacetyl radical (CH3C(O)O2) with
Figure 2. (a–b) Means (on a 0.5◦×0.5◦grid) of the HCOOH and CH3COOH total columns from the 2007–2018 IASI/Metop–A observations over January. The empty spaces at high latitudes are regions where no measurements passed the pre- and post-filtering. The CH3COOH data over deserts are not displayed. The white contour lines delimit the areas with high CH3COOH measurement confidence (see text). (c) Correlation coefficients between the daily 0.5◦×0.5◦gridded HCOOH and CH3COOH total columns and (d) CH3COOH:HCOOH column ratios, over January throughout the 2007–2018 time period. (e–h) Same as (a–d), but for April.
the hydroperoxyl radical (HO2) and other peroxy radicals (RO2) in low NOxconcentration (Dillon & Crowley, 2008; Hasson et al., 2004; Moortgat et al., 1989). These enhancements are also due to biomass burning with occurrence, for example, in October over Southern Africa and Amazonia, in March–April in Southeast Asia and in summer in the boreal regions (Figures 2–3). Both organic acids and several of their precursors can indeed be directly emitted from fires, especially CH3COOH which has 3 to 10 times higher biomass burning emission factors than HCOOH (Akagi et al., 2011; Andreae, 2019).
Overall, the IASI CH3COOH measurements present spatial distributions and total columns that resem-ble those of HCOOH, with typical monthly averages of 1–2 × 10¹⁵ molec/cm2 in remote areas and
>14 × 1015molec/cm2over hot spots. Over source regions, where the CH
3COOH data are more reliable, the
CH3COOH:HCOOH ratios are close to 1 and the correlation coefficients higher than 0.5–0.6, for example,
at Northern Hemisphere middle and high latitudes in July and over the biomass burning areas in October (Figure 3). This is in agreement with most field measurements that show a noticeable correlation between both species (e.g., Chebbi & Carlier, 1996; Keene & Galloway, 1988; Khare et al., 1999). Based on the emis-sions and photochemical production identified so far, the total CH3COOH sources have been estimated
at 73–134.3 Tg/year, against 32–61.5 Tg/year for HCOOH (Ito et al., 2007; Khan et al., 2018; Millet et al., 2015; Müller et al., 2019; Paulot et al., 2011; Stavrakou et al., 2012; von Kuhlmann et al., 2003). However, the CH3COOH degradation in the free troposphere through OH-induced oxidation is thought to proceed
more rapidly than for HCOOH (∼10 days against ∼25 days; Atkinson et al., 2006; Huang et al., 2009), which may partly explain the similar observed columns between the two species. Efficient removal from the atmospheric boundary layer via wet and dry deposition reduces their global lifetime to ∼2.3 and 3.2 days, respectively (Paulot et al., 2011); therefore, the abundance of both compounds drops off outside the source regions. Over the biomass burning areas, the ratios are similarly close to 1, although higher fire emission factors for CH3COOH than for HCOOH are reported in the literature (Akagi et al., 2011; Andreae, 2019).
While we cannot rule out potential retrieval biases, another explanation is a rapid secondary HCOOH for-mation, as suggested by space-based pyrogenic HCOOH enhancement ratios that are significantly higher than expected (Chaliyakunnel et al., 2016; Pommier et al., 2017), and which would not be present to the same degree for CH3COOH.
IASI HCOOH and CH3COOH distributions do not exhibit clear enhancements over polluted regions (e.g., East Asia and Europe). Indeed, only a few mechanisms of carboxylic acid production involving anthro-pogenic compounds have been identified so far, such as the HCOOH formation via the OH-oxidation of acetylene (Hatakeyama et al., 1986) and the ozonolysis of propene and higher alkenes leading to CH3COOH.
Moreover, whereas the CH3C(O)O2+HO2/RO2reactions yielding CH3COOH dominate in clean and remote environments, in polluted conditions (high NOxconcentration) CH3C(O)O2primarily reacts with NOxto produce methyl peroxy radical (CH3O2) and peroxyacyl nitrates. Although large direct CH3COOH emissions
have been reported locally from fossil fuel and biofuel burning (e.g., Kawamura et al., 1985; Liggio et al., 2017), altogether the primary and secondary anthropogenic sources are estimated not to contribute signif-icantly to the HCOOH and CH3COOH burden (Khan et al., 2018; Müller et al., 2019; Paulot et al., 2011),
leaving the indirect biogenic source as the main known driver throughout the year.
Over all regions, we observe high background columns (1–2 × 10¹⁵molec/cm2) for both HCOOH and
CH3COOH. Although the background values of the IASI HCOOH measurements are generally trustworthy,
as pointed out before the IASI CH3COOH background data should be treated with caution. Interestingly, elevated concentrations in carboxylic acids over remote areas have also been reported by independent mea-surements (e.g., Chebbi & Carlier, 1996; Keene & Galloway, 1988; Khare et al., 1999; Mungall et al., 2018), but remain largely unexplained.
3.2. Regional Sources
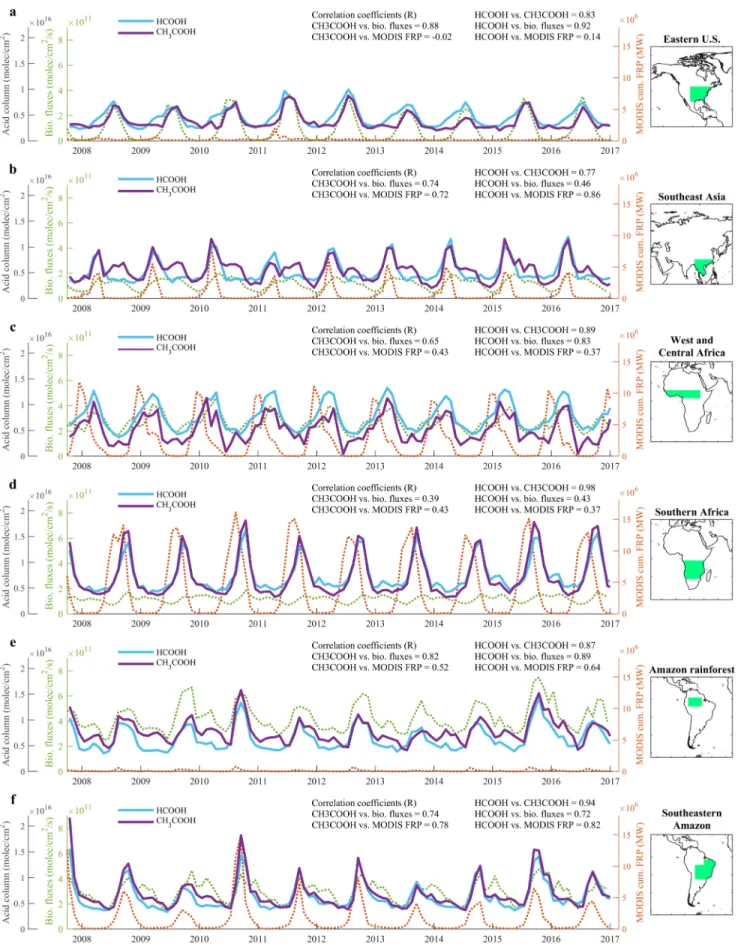
Regional time series of monthly averaged IASI/Metop–A HCOOH and CH3COOH columns are displayed
in Figure 4, along with the cumulative MODIS FRP and MEGAN–MOHYCAN isoprene and monoter-penes fluxes. The gas columns show a clear peak in summer at Northern Hemisphere middle and high latitudes (Figures 4a and S17a), in spring over Southeast Asia, West and Central Africa, and Central America (Figures 4b–4c and S17b), and during the second half of the year in the Southern Hemisphere (Figures 4d–4f). The peak usually represents a factor 2–3 increase relative to the background levels. Overall, both species exhibit a similar seasonal cycle over all regions, which indicates the common origin of their
Figure 4. Time series of monthly mean HCOOH and CH3COOH total column (blue and purple solid lines, respectively), MEGAN–MOHYCAN isoprene and
sources and sinks. This is reflected in the large monthly correlation coefficients between the two species, with the lowest value (R = 0.77) reached over Southeast Asia and the highest (R = 0.98) over Southern Africa. The HCOOH and CH3COOH columns seem to be dominantly driven by the terrestrial biogenic hydrocarbon
emissions over Eastern United States and the Amazon rainforest (Figures 4a and 4e), where the cumulated FRP remains weak. The Amazon rainforest area has been separated from the southeastern part based on the known biogenic sources of carboxylic acids, but fire plumes originating from the Amazon deforestation area also contribute to their seasonal enhancements. In contrast, despite a time lag (see below), the dependence on biomass burning seems to be the strongest over Southern Africa where the relatively constant biogenic fluxes cannot explain the HCOOH and CH3COOH seasonality (Figure 4d). In other regions, the data suggest
a joint contribution from both terrestrial vegetation and fires. Indeed, whereas the biogenic emissions do not show strong interannual variability, a more intense yearly fire energy often translates into a stronger annual peak of organic acids, such as over Southeast Asia, the Amazon deforestation area, and the boreal forests (Figures 4b, 4f, and S17a).
Even if both organic acids highly correlate with each other, some differences are noticeable on a regional scale. For instance, HCOOH columns in Southeast United States (Figure 4a) starts increasing in late winter–early spring, that is, ∼2 months earlier than CH3COOH. The same feature is observed over the
boreal forests (Figure S17a). Indeed, the CH3COOH:HCOOH ratio is significantly lower than 1 in April at
Northern Hemisphere middle and high latitudes (Figure 2h). Another major difference is seen over the low latitude regions (except over Africa), where the post-peak return of the CH3COOH columns to the
back-ground values is slower than for HCOOH. This slow decrease furthermore exhibits a secondary peak over Southeast Asia, the Amazon rainforest, and Central America (Figures 4b, 4e, and S17b), which does not exist for HCOOH. Owing to the limited sensitivity of IASI to the CH3COOH detection outside the enhancement
periods, we cannot at this stage rule out the possibility that these differences in the time evolution are arti-facts. However, should independent measurements corroborate these observations, this would imply that one or several direct source(s) and/or chemical mechanism(s) are seasonally active which do not lead to the production of the other species.
Over Africa (Figures 4c–4d), the HCOOH and CH3COOH seasonality seems to be closely related to
the fire seasonal cycle (Figures 2–3), which typically starts with the savanna fires in the northern sub-Saharan regions in November–December, proceeds southward, and finishes in Southern Africa in October–November the next year. The peak of HCOOH and CH3COOH columns rather occurs in the late regional fire season, that is, 1–2 month(s) later than the peak of MODIS FRP taking place usually in the early dry season. This time lag has been reported in the literature for other fire tracers, for example, with IASI CO and NH3column measurements (Whitburn et al., 2015). Recently, this has been ascribed to the transition
from flaming- to smoldering-dominated combustion during the course of a fire season (Zheng et al., 2018); the late season shows more precipitation and declining FRP, which decreases the combustion efficiency and increases the emission factors of incompletely oxidized products, like CO, organic acids, and several of their precursors. A shift from grassland to woodland fires lowering the combustion efficiency has also been evoked (van der Werf et al., 2006). It is worth mentioning that the observed enhancements match also with the biogenic emissions over west and central Africa (Figure 4c). Interestingly, no clear time lag is observed over other typical biomass burning areas, such as Southeast Asia and Southeastern Amazonia (Figures 4b and 4f). The same time lag over Africa is observed for CO with bottom-up fire emission inventories that rely on satellite-derived FRP and burned area (e.g., Zheng et al., 2018). Since these inventories implement sea-sonally static emission factors and do not account for the flaming to smoldering transition, this suggests an underestimation of the HCOOH and CH3COOH emissions and/or precursors during the late fire season.
4. Conclusions
We have produced and characterized the first distributions of CH3COOH total columns obtained from IASI
observations. The IASI CH3COOH product complements the suite of ANNI OVOCs retrieved globally.
Study-ing the IASI HCOOH and CH3COOH columns together indicates a strong dependence of both species to the major hydrocarbon emissions from the terrestrial vegetation over almost all the regions where organic acid enhancements are detected. Biomass burning emissions of HCOOH and CH3COOH and of their precursors
Africa. Conversely, the absence of clear enhancements over major polluted regions sustains the hypothesis that anthropogenic emissions contribute little to the atmospheric burden of carboxylic acids.
Although HCOOH and CH3COOH share common sources, the IASI observations suggest the existence of
emissions and/or routes leading specifically to the production of each species, which should be verified by independent data. Differentiated measurements of biogenic tracers would also be required to identify the HCOOH and CH3COOH biogenic precursors and the mechanisms that are at play. Also, a more advanced proxy of combustion efficiency would help to better represent the transition between dominant flaming combustion and residual smoldering, which is most likely the cause of the 1–2 month time lag over Africa between the peaks of MODIS fire tracer and of IASI organic acid columns.
References
Aires, F., Rossow, W. B., Scott, N. A., & Chédin, A. (2002). Remote sensing from the infrared atmospheric sounding interferometer instru-ment 2. Simultaneous retrieval of temperature, water vapor, and ozone atmospheric profiles. Journal of Geophysical Research, 107(D22), 4620. hppts://doi.org/10.1029/2001jd001591
Akagi, S. K., Yokelson, R. J., Wiedinmyer, C., Alvarado, M. J., Reid, J. S., Karl, T., et al. (2011). Emission factors for open and domes-tic biomass burning for use in atmospheric models. Atmospheric Chemistry and Physics, 11(9), 4039–4072. hppts://doi.org/10.5194/ acp-11-4039-2011
Andreae, M. O. (2019). Emission of trace gases and aerosols from biomass burning—An updated assessment. Atmospheric Chemistry and
Physics Discussions, 19, 8523–8546. hppts://doi.org/10.5194/acp-2019-303
Andrews, D. U., Heazlewood, B. R., Maccarone, A. T., Conroy, T., Payne, R. J., Jordan, M. J. T., & Kable, S. H. (2012). Photo-tautomerization of acetaldehyde to vinyl alcohol: A potential route to tropospheric acids. Science, 337(6099), 1203–1206. hppts://doi.org/10.1126/science. 1220712
Atkinson, R., Baulch, D. L., Cox, R. A., Crowley, J. N., Hampson, R. F., Hynes, R. G., et al. (2006). Evaluated kinetic and photochemical data for atmospheric chemistry: Volume II—Gas phase reactions of organic species. Atmospheric Chemistry and Physics, 6(11), 3625–4055. hppts://doi.org/10.5194/acp-6-3625-2006
Bauwens, M., Stavrakou, T., Müller, J.-F., Schaeybroeck, B. V., Cruz, L. D., DeTroch, R., et al. (2018). Recent past (1979–2014) and future (2070–2099) isoprene fluxes over Europe simulated with the MEGAN–MOHYCAN model. Biogeosciences, 15(12), 3673–3690. hppts:// doi.org/10.5194/bg-15-3673-2018
Calvert, J. G., & Stockwell, W. R. (1983). Acid generation in the troposphere by gas-phase chemistry. Environmental Science & Technology,
17(9), 428A–443A. hppts://doi.org/10.1021/es00115a727
Chaliyakunnel, S., Millet, D. B., Wells, K. C., Cady-Pereira, K. E., & Shephard, M. W. (2016). A large underestimate of formic acid from tropical fires: Constraints from space-borne measurements. Environmental Science & Technology, 50(11), 5631–5640. hppts://doi.org/10. 1021/acs.est.5b06385
Chameides, W. L., & Davis, D. D. (1983). Aqueous-phase source of formic acid in clouds. Nature, 304(5925), 427–429. hppts://doi.org/10. 1038/304427a0
Chebbi, A., & Carlier, P. (1996). Carboxylic acids in the troposphere, occurrence, sources, and sinks: A review. Atmospheric Environment,
30(24), 4233–4249. hppts://doi.org/10.1016/1352-2310(96)00102-1
Clarisse, L., Clerbaux, C., Franco, B., Hadji-Lazaro, J., Whitburn, S., Kopp, A. K., et al. (2019). A decadal data set of global atmospheric dust retrieved from IASI satellite measurements. Journal of Geophysical Research: Atmospheres, 124, 1618–1647. hppts://doi.org/10.1029/ 2018jd029701
Clarisse, L., Coheur, P.-F., Prata, F., Hadji-Lazaro, J., Hurtmans, D., & Clerbaux, C. (2013). A unified approach to infrared aerosol remote sensing and type specification. Atmospheric Chemistry and Physics, 13(4), 2195–2221. hppts://doi.org/10.5194/acp-13-2195-2013 Clarisse, L., R'Honi, Y., Coheur, P.-F., Hurtmans, D., & Clerbaux, C. (2011). Thermal infrared nadir observations of 24 atmospheric gases.
Geophysical Research Letters, 38, L10802. hppts://doi.org/10.1029/2011GL047271
Clerbaux, C., Boynard, A., Clarisse, L., George, M., Hadji-Lazaro, J., Herbin, H., et al. (2009). Monitoring of atmospheric composi-tion using the thermal infrared IASI/Metop sounder. Atmospheric Chemistry and Physics, 9(16), 6041–6054. hppts://doi.org/10.5194/ acp-9-6041-2009
Coheur, P.-F., Clarisse, L., Turquety, S., Hurtmans, D., & Clerbaux, C. (2009). IASI measurements of reactive trace species in biomass burning plumes. Atmospheric Chemistry and Physics, 9(15), 5655–5667. hppts://doi.org/10.5194/acp-9-5655-2009
Di Noia, A., Hasekamp, O. P., van Harten, G., Rietjens, J. H. H., Smit, J. M., Snik, F., et al. (2015). Use of neural networks in ground-based aerosol retrievals from multi-angle spectropolarimetric observations. Atmospheric Measurement Techniques, 8(1), 281–299. hppts://doi. org/10.5194/amt-8-281-2015
Dillon, T. J., & Crowley, J. N. (2008). Direct detection of OH formation in the reactions of HO2 with CH3C(O)O2 and other substituted peroxy radicals. Atmospheric Chemistry and Physics, 8(16), 4877–4889. hppts://doi.org/10.5194/acp-8-4877-2008
Franco, B., Clarisse, L., Stavrakou, T., Müller, J.-F., Pozzer, A., Hadji-Lazaro, J., et al. (2019). Acetone atmospheric distribution retrieved from space. Geophysical Research Letters, 46, 2884–2893. hppts://doi.org/10.1029/2019GL082052
Franco, B., Clarisse, L., Stavrakou, T., Müller, J.-F., Van Damme, M., Whitburn, S., et al. (2018). A general framework for global retrievals of trace gases from IASI: Application to methanol, formic acid, and PAN. Journal of Geophysical Research: Atmospheres, 123, 13,963–13,984. hppts://doi.org/10.1029/2018JD029633
Galloway, J. N., Likens, G. E., Keene, W. C., & Miller, J. M. (1982). The composition of precipitation in remote areas of the world. Journal
of Geophysical Research, 87(C11), 8771. hppts://doi.org/10.1029/jc087ic11p08771
Giglio, L., van der Werf, G. R., Randerson, J. T., Collatz, G. J., & Kasibhatla, P. (2006). Global estimation of burned area using MODIS active fire observations. Atmospheric Chemistry and Physics, 6(4), 957–974. hppts://doi.org/10.5194/acp-6-957-2006
Guenther, A. B., Jiang, X., Heald, C. L., Sakulyanontvittaya, T., Duhl, T., Emmons, L. K., & Wang, X. (2012). The model of emissions of gases and aerosols from nature version 2.1 (MEGAN2.1): An extended and updated framework for modeling biogenic emissions. Geoscientific
Model Development, 5(6), 1471–1492. hppts://doi.org/10.5194/gmd-5-1471-2012
Acknowledgments
The research has been supported by the project OCTAVE (Oxygenated Compounds in the Tropical Atmosphere: Variability and Exchanges (http://octave.aeronomie. be/) of the Belgian Research Action through Interdisciplinary Networks (BRAIN–be; 2017–2021; Research project BR/175/A2/OCTAVE) and by the IASI.Flow Prodex arrangement (ESA–BELSPO). L. Clarisse and E. Mahieu are research associates supported by the F.R.S.–FNRS. The French scientists are grateful to CNES and Centre National de la Recherche Scientifique (CNRS) for financial support. IASI is a joint mission of Eumetsat and the Centre National d'Etudes Spatiales (CNES, France). The IASI Level-1C data are distributed in near real-time by Eumetsat through the EumetCast distribution system. The authors acknowledge the AERIS data infrastructure (https://www. aeris-data.fr/) for providing access to the IASI Level-1C data and Level–2 temperature data. The IASI HCOOH and CH3COOH data presented in this paper are publicly available on the AERIS repository (https://iasi. aeris-data.fr/carboxacids/). The MEGAN–MOHYCAN biogenic fluxes are available on the BIRA–IASB website (http://emissions.aeronomie. be/). The MODIS data have been downloaded from the NASA's LANCE Fire Information for Resource Management System (FIRMS) website (https://firms.modaps.eosdis.nasa.gov/ download/). The FTIR multi-decadal monitoring program of ULiège at Jungfraujoch has been primarily supported by the F.R.S.–FNRS, BELSPO, the Fédération Wallonie-Bruxelles (all in Brussels), and by the GAW-CH program of MeteoSwiss. We acknowledge the International Foundation High Altitude Research Stations
Jungfraujoch and Gornergrat (HFSJG, Bern) for supporting the facilities needed to perform the FTIR observations at Jungfraujoch. The National Center for Atmospheric Research (NCAR) is sponsored by the National Science Foundation. The NCAR FTS observation programs at Thule, GR and Boulder, CO, are supported under contract by the National Aeronautics and Space Administration (NASA). The Thule work is also supported by the NSF Office of Polar Programs (OPP). We wish to thank the Danish
Meteorological Institute for support at the Thule site. We would like to thank Uwe Raffalski, IRF, for his support of FTIR measurements at IRF Kiruna. The FTIR instrument at Izana has been operated by Omaira García and Eliezer Sepúlveda. The FTIR data were obtained from the Network for the
Hasson, A. S., Tyndall, G. S., & Orlando, J. J. (2004). A product yield study of the reaction of HO2 radicals with ethyl peroxy (C2H5O2), acetyl peroxy (CH3C(O)O2), and acetonyl peroxy (CH3C(O)CH2O2) radicals. The Journal of Physical Chemistry A, 108(28), 5979–5989. hppts://doi.org/10.1021/jp048873t
Hatakeyama, S., Washida, N., & Akimoto, H. (1986). Rate constants and mechanisms for the reaction of hydroxyl (OD) radicals with acetylene, propyne, and 2-butyne in air at 297 .+-. 2 K. The Journal of Physical Chemistry, 90(1), 173–178. hppts://doi.org/10.1021/ j100273a039
Huang, Y., Dransfield, T. J., Miller, J. D., Rojas, R. D., Castillo, X. G., & Anderson, J. G. (2009). Experimental study of the kinetics of the reaction of acetic acid with hydroxyl radicals from 255 to 355 K. The Journal of Physical Chemistry A, 113(2), 423–430. hppts://doi.org/ 10.1021/jp808627w
Ito, A., Sillman, S., & Penner, J. E. (2007). Effects of additional nonmethane volatile organic compounds, organic nitrates, and direct emissions of oxygenated organic species on global tropospheric chemistry. Journal of Geophysical Research, 112, D06309. hppts://doi. org/10.1029/2005JD006556
Jacob, D. J. (1986). Chemistry of OH in remote clouds and its role in the production of formic acid and peroxymonosulfate. Journal of
Geophysical Research, 91(D9), 9807. hppts://doi.org/10.1029/jd091id09p09807
Kawamura, K., Ng, L. L., & Kaplan, I. R. (1985). Determination of organic acids (C1-C10) in the atmosphere, motor exhausts, and engine oils. Environmental Science & Technology, 19(11), 1082–1086. hppts://doi.org/10.1021/es00141a010
Keene, W. C., & Galloway, J. N. (1988). The biogeochemical cycling of formic and acetic acids through the troposphere: An overview of current understanding. Tellus B, 40B(5), 322–334. hppts://doi.org/10.1111/j.1600-0889.1988.tb00106.x
Keene, W. C., Galloway, J. N., Likens, G. E., Deviney, F. A., Mikkelsen, K. N., Moody, J. L., & Maben, J. R. (2015). Atmospheric wet deposition in remote regions: Benchmarks for environmental change. Journal of the Atmospheric Sciences, 72(8), 2947–2978. hppts://doi.org/10. 1175/jas-d-14-0378.1
Khan, M. A. H., Lyons, K., Chhantyal-Pun, R., McGillen, M. R., Caravan, R. L., Taatjes, C. A., et al. (2018). Investigating the tropospheric chemistry of acetic acid using the global 3-D chemistry transport model, STOCHEM-CRI. Journal of Geophysical Research: Atmospheres,
123, 6267–6281. hppts://doi.org/10.1029/2018JD028529
Khare, P., Kumar, N., Kumari, K. M., & Srivastava, S. S. (1999). Atmospheric formic and acetic acids: An overview. Reviews of Geophysics,
37(2), 227–248. hppts://doi.org/10.1029/1998RG900005
Krasnopolsky, V. M., Fox-Rabinovitz, M. S., & Chalikov, D. V. (2005). New approach to calculation of atmospheric model physics: Accurate and fast neural network emulation of longwave radiation in a climate model. Monthly Weather Review, 133(5), 1370–1383. hppts://doi. org/10.1175/mwr2923.1
Lei, X., Chen, D., Wang, W., Liu, F., & Wang, W. (2018). Quantum chemical studies of the OH-initiated oxidation reactions of propenols in the presence of O2. Molecular Physics, 117(6), 682–692. hppts://doi.org/10.1080/00268976.2018.1537527
Liggio, J., Moussa, S. G., Wentzell, J., Darlington, A., Liu, P., Leithead, A., et al. (2017). Understanding the primary emissions and secondary formation of gaseous organic acids in the oil sands region of Alberta, Canada. Atmospheric Chemistry and Physics, 17(13), 8411–8427. hppts://doi.org/10.5194/acp-17-8411-2017
Liu, Z., Nguyen, V. S., Harvey, J., Müller, J.-F., & Peeters, J. (2018). The photolysis of𝛼-hydroperoxycarbonyls. Physical Chemistry Chemical
Physics, 20(10), 6970–6979. hppts://doi.org/10.1039/c7cp08421h
Millet, D. B., Baasandorj, M., Farmer, D. K., Thornton, J. A., Baumann, K., Brophy, P., et al. (2015). A large and ubiquitous source of atmospheric formic acid. Atmospheric Chemistry and Physics, 15(11), 6283–6304. hppts://doi.org/10.5194/acp-15-6283-2015 Moortgat, G., Veyret, B., & Lesclaux, R. (1989). Absorption spectrum and kinetics of reactions of the acetylperoxy radical. The Journal of
Physical Chemistry, 93(6), 2362–2368. hppts://doi.org/10.1021/j100343a032
Müller, M. D., Kaifel, A. K., Weber, M., Tellmann, S., Burrows, J. P., & Loyola, D. (2003). Ozone profile retrieval from global ozone mon-itoring experiment (GOME) data using a neural network approach (neural network ozone retrieval system (NNORSY)). Journal of
Geophysical Research, 108(D16), 4497. hppts://doi.org/10.1029/2002JD002784
Müller, J.-F., Stavrakou, T., & Peeters, J. (2019). Chemistry and deposition in the model of atmospheric composition at global and regional scales using inversion techniques for trace gas emissions (MAGRITTE v1.1) – Part 1: Chemical mechanism. Geoscientific Model
Development, 12(6), 2307–2356. hppts://doi.org/10.5194/gmd-12-2307-2019
Müller, J.-F., Stavrakou, T., Wallens, S., Smedt, I. D., Roozendael, M. V., Potosnak, M. J., et al. (2008). Global isoprene emissions esti-mated using MEGAN, ECMWF analyses and a detailed canopy environment model. Atmospheric Chemistry and Physics, 8(5), 1329–1341. hppts://doi.org/10.5194/acp-8-1329-2008
Mungall, E. L., Abbatt, J. P. D., Wentzell, J. J. B., Wentworth, G. R., Murphy, J. G., Kunkel, D., et al. (2018). High gas-phase mixing ratios of formic and acetic acid in the High Arctic. Atmospheric Chemistry and Physics, 18(14), 10,237–10,254. hppts://doi.org/10.5194/ acp-18-10237-2018
Neeb, P., Sauer, F., Horie, O., & Moortgat, G. K. (1997). Formation of hydroxymethyl hydroperoxide and formic acid in alkene ozonolysis in the presence of water vapour. Atmospheric Environment, 10, 1417–1423. hppts://doi.org/10.1016/s1352-2310(96)00322-6
Paulot, F., Wunch, D., Crounse, J. D., Toon, G. C., Millet, D. B., DeCarlo, P. F., et al. (2011). Importance of secondary sources in the atmospheric budgets of formic and acetic acids. Atmospheric Chemistry and Physics, 11(5), 1989–2013. hppts://doi.org/10.5194/ acp-11-1989-2011
Piscini, A., Carboni, E., Frate, F. D., & Grainger, R. G. (2014). Simultaneous retrieval of volcanic sulphur dioxide and plume height from hyperspectral data using artificial neural networks. Geophysical Journal International, 198(2), 697–709. hppts://doi.org/10.1093/gji/ ggu152
Pommier, M., Clerbaux, C., & Coheur, P.-F. (2017). Determination of enhancement ratios of HCOOH relative to CO in biomass burning plumes by the infrared atmospheric sounding interferometer (IASI). Atmospheric Chemistry and Physics, 17(18), 11,089–11,105. hppts:// doi.org/10.5194/acp-17-11089-2017
Pommier, M., Clerbaux, C., Coheur, P.-F., Mahieu, E., Müller, J.-F., Paton-Walsh, C., et al. (2016). HCOOH distributions from IASI for 2008–2014: Comparison with ground-based FTIR measurements and a global chemistry-transport model. Atmospheric Chemistry and
Physics, 16(14), 8963–8981. hppts://doi.org/10.5194/acp-16-8963-2016
Razavi, A., Karagulian, F., Clarisse, L., Hurtmans, D., Coheur, P. F., Clerbaux, C., et al. (2011). Global distributions of methanol and formic acid retrieved for the first time from the IASI/MetOp thermal infrared sounder. Atmospheric Chemistry and Physics, 11(2), 857–872. hppts://doi.org/10.5194/acp-11-857-2011
So, S., Wille, U., & da Silva, G. (2014). Atmospheric chemistry of enols: A theoretical study of the vinyl alcohol + OH + O2 reaction mechanism. Environmental Science & Technology, 48(12), 6694–6701. hppts://doi.org/10.1021/es500319q
Stavrakou, T., Müller, J.-F., Peeters, J., Razavi, A., Clarisse, L., Clerbaux, C., et al. (2012). Satellite evidence for a large source of formic acid from boreal and tropical forests. Nature Geoscience, 5(1), 26–30. hppts://doi.org/10.1038/ngeo1354
Detection of Atmospheric Composition Change (NDACC; http://www.ndacc. org). The aircraft data used in this study are from https://esrl.noaa.gov/csd/ projects/senex/ (SENEX) and https:// www-air.larc.nasa.gov/missions/ merges/ (all other campaigns).
Van Damme, M., Whitburn, S., Clarisse, L., Clerbaux, C., Hurtmans, D., & Coheur, P.-F. (2017). Version 2 of the IASI NH3 neural network retrieval algorithm: Near-real-time and reanalysed datasets. Atmospheric Measurement Techniques, 10(12), 4905–4914. hppts://doi.org/ 10.5194/amt-10-4905-2017
van der Werf, G. R., Randerson, J. T., Giglio, L., Collatz, G. J., Kasibhatla, P. S., & Arellano, A. F. (2006). Interannual variability in global biomass burning emissions from 1997 to 2004. Atmospheric Chemistry and Physics, 6(11), 3423–3441. hppts://doi.org/10.5194/ acp-6-3423-2006
Vet, R., Artz, R. S., Carou, S., Shaw, M., Ro, C.-U., Aas, W., et al. (2014). A global assessment of precipitation chemistry and deposition of sulfur, nitrogen, sea salt, base cations, organic acids, acidity and pH, and phosphorus. Atmospheric Environment, 93, 3–100. hppts://doi. org/10.1016/j.atmosenv.2013.10.060
von Kuhlmann, R., Lawrence, M. G., Crutzen, P. J., & Rasch, P. J. (2003). A model for studies of tropospheric ozone and nonmethane hydrocarbons: Model evaluation of ozone-related species. Journal of Geophysical Research, 108(D23), 4729. hppts://doi.org/10.1029/ 2002jd003348
Walker, J. C., Dudhia, A., & Carboni, E. (2011). An effective method for the detection of trace species demonstrated using the Metop infrared atmospheric sounding interferometer. Atmospheric Measurement Techniques, 4(8), 1567–1580. hppts://doi.org/10.5194/ amt-4-1567-2011
Whitburn, S., Van Damme, M., Clarisse, L., Bauduin, S., Heald, C. L., Hadji-Lazaro, J., et al. (2016). A flexible and robust neural network IASI-NH3retrieval algorithm. Journal of Geophysical Research: Atmospheres, 121, 6581–6599. hppts://doi.org/10.1002/2016jd024828 Whitburn, S., Van Damme, M., Kaiser, J. W., van der Werf, G. R., Turquety, S., Hurtmans, D., et al. (2015). Ammonia emissions in tropical
biomass burning regions: Comparison between satellite-derived emissions and bottom-up fire inventories. Atmospheric Environment,
121, 42–54. hppts://doi.org/10.1016/j.atmosenv.2015.03.015
Yu, S. (2000). Role of organic acids (formic, acetic, pyruvic and oxalic) in the formation of cloud condensation nuclei (CCN): A review.
Atmospheric Research, 53(4), 185–217. hppts://doi.org/10.1016/s0169-8095(00)00037-5
Zheng, B., Chevallier, F., Ciais, P., Yin, Y., & Wang, Y. (2018). On the role of the flaming to smoldering transition in the seasonal cycle of African fire emissions. Geophysical Research Letters, 45, 11,998–12,007. hppts://doi.org/10.1029/2018gl079092