Beyond Models
Digital Tools for Urban Design as Mechanisms for Better Planning Practices
By
Gonzalo Ortega Sánchez de Lerín
Master of Architecture
Escuela Técnica Superior de Arquitectura Universidad Politécnica de Madrid (2017)
Bachelor of Architecture
Escuela Técnica Superior de Arquitectura Universidad Politécnica de Madrid (2016)
Submitted to the Department of Urban Studies and Planning in partial fulfillment of the requirements for the degree of
Master in City Planning
at the
MASSACHUSETTS INSTITUTE OF TECHNOLOGY June 2019
© 2019 Gonzalo Ortega Sánchez de Lerín. All Rights Reserved
The author hereby grants to MIT the permission to reproduce and to distribute publicly paper and electronic
copies of the thesis document in whole or in part in any medium now known or hereafter created.
Author_________________________________________________________________ Department of Urban Studies and Planning May 22, 2019 Certified by _____________________________________________________________ Eran Ben-Joseph Professor of Landscape Architecture and Urban Planning, Department Head
Department of Urban Studies and Planning Thesis Supervisor Accepted by____________________________________________________________
Cesar McDowell, Professor of the Practice Co-Chair, MCP Committee, Department of Urban Studies and Planning
Beyond Models
Digital Tools for Urban Design as Mechanisms for
Better Planning Practices
Beyond Models
Digital Tools for Urban Design as Mechanisms for Better Planning Practices
By Gonzalo Ortega Sánchez de Lerín
Submitted to the Department of Urban Studies and Planning on May 21, 2019 in partial fulfillment of the requirements for the degree of Master in City Planning.
Abstract
This thesis explores the factors that affect the potential of computational urban design tools as instruments to support the implementation of better urban design practices through more informed and collaborative urban development processes. Contemporary computational tools impact the inception of design ideas; evaluate design outputs objectively at different stages; and assist the further development of the design solutions. These tools streamline the creation of comprehensive and detailed urban design scenarios based on extensive quantitative and qualitative methods which relate to the extensive factors urban design needs to address. The goal is to result in more sustainable, vibrant and equitable developments through urban form, use allocation and other design specifications. However, external factors condition the implementation of these informed urban design practices. Particularly in the case of high-density, mixed-use urban infill projects, regulations and policies determine the possibilities for development and “opportunity space” within which the negotiation and trade-off between stakeholders in these often contentious urban projects takes place (Tiesdell and Adams, 2011). Both regulations and trade-off affect the final definition of an urban design project and the inclusion of better practices.
In this context, the thesis explores the pros and cons of computational modeling tools to adequately inform and support better urban design practices within the complexity high-density, mixed-use development processes subject to restrictive regulations and participatory planning processes. An analysis of theory, use cases and the in-depth exploration of the various approaches to urban design in the redevelopment of Kendall Square in Cambridge, Massachusetts leads to multisided results. First, computational modeling tools both empower and limit the capacity of design and planning practitioners through the complexity of their operations. Second, the advanced level of definition of digital tools early in the development process can streamline fundamental phases (e.g. approval, entitlement or design review), thus reducing uncertainty and risk. However, this can also restrict the opportunity space of stakeholders in the pursuit of their interests and impact negatively the implementation of practices that are not enforced by regulations. Third, while the use of digital tools can lead to more interactive and publicly accessible design and planning processes, the complexity of the tools and the information they build on affect their potential for effective communication. This can hinder better decision-making and consensus-building that supports the implementation of better practices. I conclude by providing a series of short recommendations for how to potentially address these issues.
Thesis Supervisor Professor Eran Ben-Joseph, Professor of Landscape Architecture and Urban
Planning, Department Head
Agradecimientos / Acknowledgments
A Josefina, Ramiro, Olga y Pablo, apoyos cada día desde el recuerdo. A Teresa y Pablo, por ser ejemplo. Gracias por todo.
A todos los que llamo familia, natural o elegida, por guiarme, hacerme reír, enriquecer mi vida día a día. Los de allí, los de tantos lugares y tantos encuentros, Mechi, Jess y Toni, mi pequeña familia DUSP.
Eran and Ira, for your patience, insights and guidance.
DUSP and DUSPers, for helping me grow in every possible aspect: personally, intellectually, professionally. These two years have been so much more than I ever imagined.
Table of Content
1
Introduction + context: computational tools as mechanisms for better urban design
Towards better planning practices Methodology and limitations of research A critical approach to technology
2
Coding the city: towards data-driven digital urban design and planning tools
Towards a thousand masterplans: KPF´s Urban Interface Urban Footprint and UrbanSIM and the future of web-based tools
3
Long term, large scale: Forces behind the design, planning and development of Kendall
An introduction to Kendall Square The evolution of Kendall Square Framing Kendall´s development: Cambridge´s regulations and the pursuit of better urban design practices
4
Towards collaborative urban design tools
The development of tangible computing tools and their use in Kendall The limitations of tangible computing tools in the CityScope project
Simplifying communication - coUrbanize
5
Analysis: Learning from the evolution of tools, Kendall & theory
Beyond plans and tools: Interviews with stakeholders in Kendall Square Pros and cons of digital tools in the design and development process
6
Conclusions: Learning from models, learning from reality Appendix Interviews Bilbiography 6 9 10 11 14 22 27 32 33 37 53 58 66 68 72 73 74 85 88
1
Introduction + context
Opportunities of computational tools for high-density, mixed-use
urban design
In the last decade, computational tools that plan and design cities through data-based and performance-driven approaches have gained high relevance in the design and planning field as a way to develop comprehensive and detailed urban design scenarios based on extensive quantitative and qualitative methods. These impact the inception of design ideas; evaluate design outputs objectively at different stages; and assist the further development of the design solutions. These relate through indicators, parameters, and standards to the many factors urban design needs to address result in more sustainable, vibrant and equitable developments through urban form, use allocation and other design specifications. Particularly in the case of high-density, mixed-use developments, adequate urban design practices are fundamental to achieve benefits such as quality urban space, reduced congestion and vehicle emissions, smaller ecological footprints, and long-term economic sustainability with mixed-used buildings housing multiple tenants.
However, external factors condition the implementation of these urban design solutions. In contexts with participatory planning processes and multiple stakeholders, regulations and policies determine the possibilities for development and the “opportunity space” within which the negotiation between constituents towards the implementation of a project takes place (Tiesdell and Adams, 2011). In the case of high-density, mixed-use developments or any other large development project, the high development pressure that is necessary to carry out these complex and costly projects is more than not faced with community opposition and demands. As a result, the development of urban projects tends to become a trade-off process between stakeholders in the definition of the urban form or other design features that can affect the inclusion of better urban design. At the same time, while regulations may support the implementation of better urban design practices, their definition in legal terms tend to navigate an ambiguous space between zoning and building codes. Consequently, their level of enforcement is usually unclear.
As digital modeling design and planning tools become more present in the Digital Age, it is relevant to understand how advanced digital tools are being into the development process. What are the pros and cons of digital tools to adequately inform and support better urban planning and design practices within the complexity of the development process?
The richness of urban design proposals in Kendall Square in Cambridge, Massachusetts aid the understanding of how tools serve the consensus building process amongst different stakeholders towards the implementation of better urban design under a comprehensive regulation that incentivizes good urban design practices, an active participatory planning processes, and high market pressure. At the same time, research groups from MIT have approached Kendall Square as a testing ground for the tangible computing tools to enhance participatory planning and design
processes through data-based and performance-driven approaches. However, they have had little influence on the real development processes despite their vast potential. As such. Kendall serves as an example for other large-scale urban developments that aim to foster more participatory planning processes and qualitative urban design outcomes.
While computational tools are only instruments for the inception and implementation of an urban design project, analyzing how they operate for the diverse constituents in development can help put a focus on better addressing the aspects that guide the decision-making of stakeholders. This can facilitate negotiations and trade-offs around large scale urban projects so that planners and designers can take advantage of technology to support the implementation of better practices
beyond regulations.
Towards better urban design and planning?
For a decade as a designer, learning and practicing, I have assisted the fast-paced evolution of digital modeling design and planning tools to allow the development of comprehensive and detailed proposals that through design aim to solve various urban challenges, from sustainability, livability, accessibility or equity. As a planning and design practitioner who aims to pursue a career in supporting the implementation of better urban and design practices, digital tools are a primary instrument for design and planning. There is no unilateral definition of what constitute “good” urban design or planning practices, as the understanding of “good” relates to a specific moment in time and may change over time. Many urban design and planning practices that we consider inadequate nowadays where defended as the panacea to solve urban problems in its time, such as most modernist ideals. However, for the purpose of this research, better urban design and planning practices are defined as the practices that aim to result in more sustainable, equitable and livable urban environments. This is both the result of a series of spatial planning and design solutions at the urban and building level, such as the adequate allocation of mixed-uses, sustainable building practices, quality public space and urban form, as well as of inclusive processes that bring together the different stakeholders involved in city-making, from public administrations and communities to developers and technicians. For this purpose, this research particularly considers the approach to the implementation of “better” urban design and planning practices in the case of Kendall Square, but the definition of these “better” urban design and planning practices can vary depending on the specific location and the development of adequate solutions to urban problems. Digital and computational tools open the door more collaborative development process that can bring together the different stakeholders involved in urban development projects for better decision-making and consensus building that results in the implementation of these holistic projects. Hence, understanding the limitations of these tools beyond all their technological possibilities as a way to empower the work of the design and planning practitioners became the object of this thesis. In particular, I consider these tools can be particularly relevant for supporting better urban design practices in complex large-scale urban projects where the high development pressure that enables their often costly development contrasts with a need to incorporate urban design practices that result in more sustainable, livable and vibrant neighborhoods both for the future inhabitants of these projects as well as for surrounding communities. These practices often come at a cost and are many times not fully supported by development regulations. As a result, many contemporary high-density, mixed-use developments such as the recently inaugurated Hudson Yards in New York end up becoming lack-luster glorifications of high-end development with little contribution to the cities
and communities they are located in, and where planning and urban design decisions seem to have been purely guided by real estate benefit.
Fig.1.2 Modeling Complex Urban Design (by the author, 2019)
Methodology and limitations of research
This thesis bases its findings on design proposals, legal documents, academic sources, and interviews. By contrasting theory, use cases and understanding the “story behind them” through the involved stakeholders, I could build up an analysis to understand how particular technological and human factors influence the potential of digital tools. How does the possibility of developing advanced scenarios for better urban planning contrast to the aspects that guide decision-making under particular regulatory and market conditions?
Despite the possibilities of computational urban design tools to provide solutions for many planning contexts, I decided to focus particularly on the high-density, mixed-use urban development of Kendall due to time restrictions and in order to obtain clearer results. As opposed to the infinite possibilities computational tools enable, I considered it relevant to ground it to a case that
11
represents relevant issues in contemporary urban development, such as the pursuit of more livable, sustainable and equitable urban infill projects under high development pressure and within participatory planning processes. Kendall enables exploring this in detail as it has been parallel to the development of computational tools. Many of these, in different forms, have been instrumental for the inception of the area´s projects or have been used to set the stage for participatory planning and urban design processes. Hence, it is a very particular setting that has been researched at a particular moment of its long term history through analysis of documents and semi-structured interviews, but without real participation in the planning and design process. Hence, the outcome of this research can apply to projects with similar characteristics (size, market conditions, regulations, planning process), but it may not be valid for many other contexts with different features where computational urban design tools can also be used. However, the conclusions of this research can also help provide guidance on other types of situations or indicate that the use of computational tools may not be useful for those.
At the same time, the results of some the research projects with tangible computing tools carried out in the use case of Kendall Square did not end up providing precise outputs of urban design. These could have helped establish a more detailed analysis of how experimental approaches to collaborative performance-based urban design relate to the proposals being finally carried out or how they could have put into question the existing regulation. However, this lack of detailed results also indicated how limited advanced computational tools can be to inform real planning and development processes beyond their high-level technical capacity.
A short intro: the “opportunity space” theory (Tiesdell and Adams, 2011)
As outlined, in most complex urban development, the implementation of better planning and design practices is conditioned regulations and policies, but also by the negotiation and trade-off between stakeholders within the what Tiesdell and Adams have denominated “opportunity space” (2011). This is the space for manoeuvre of stakeholders towards pursuing their respective interests, which can be either economic, social or political. Tiesdell and Adams consider that the opportunity space of a stakeholder is constrained by three forces or contexts: the site, the regulatory, and the market context. The more problematic, difficult or constrained the site, the more demanding the regulations, or the more demanding or competitive the market are, the smaller the
stakeholder’s opportunity space and the opportunity to pursue their interests. This reduction of the opportunity space thereby conditions their potential concessions to elements that may affect the pursue of their interests. These concessions are fundamental towards achieving the implementation of better planning practices when these are not enforced by regulations, as can be the case of more sustainable construction, inclusion of more affordable housing and other public benefits, or different urban design features. While Tiesdell and Adams associate the “opportunity space” theory only to developers or designers, who either through balancing financial aspects or design decisions can achieve the implementation of these planning practices, throughout this research I realized that this opportunity space also extends to other stakeholders in urban development such as planning agencies or communities.
Fig 1.2 Opportunity space diagram (after Tiesdell & Adams, 2011)
Thus, one key assumption of this research is that technology in the form computational urban design tools can be employed to outline this “opportunity space”, thereby bringing transparency to trade-off of interest and negotiation in the collaborative coordinated effort of implementing better planning practices.
A critical approach to technology – framing technology within culture
It is also necessary to highlight a more critical approach to technology instead of idealizing it. For this, “Technopoly: The surrender of culture to technology” (2011) by Neil Postman and “Frame reflection: Toward the resolution of intractable policy controversies” (1995) by Donald Schon and Martin Rein provide a theoretical basis to situate technology and computational within the context of culture, policy and conflict resolution. Postman argues that technologies reflect and create the ways people perceive reality and that over time the dominance of tech over culture has increased. From tool-using cultures and
technocracy, nowadays we find ourselves within the technopoly, a cultural situation where technology has become the sole determiner of a culture's purpose and meaning, and in fact of its way of knowing and thinking. Technology has even become a way “not thinking” as we consider all its outputs to be unilateral truths and do not approach technology with criticality.
Schon and Reid´s frame-critical approach to policy-making and solving underlines the idea that the use of technology for solving urban development conflicts creates a frame that does more than describing a situation. Frames have normative implications and, as such, condition processes and outputs in front of real situations that are complex, vague, ambiguous and indeterminate. The use of technology risks becoming a mechanistic oversimplification of a model based on achieving objectives, for example, by aiming to develop specific ideal scenarios based on standards and indicators in the case of computational tools. At the same time, although technological platforms permit to emphasize pluralism and the presence of conflicting and competing interests, for example, by explicitly visualizing them in the case of computational urban design tools, computational process are limited in the representation and incorporation of the complexity of processes, actors, and interests that come together in complex urban planning and design. As such, technology risks becoming a partial frame that only incorporates those parties that are at the policy table and their interests while also influencing the interpretation and interaction individuals have with one another. Thus, computational tools and the frames they create must be viewed critically when technology is considered a tool for the development of solutions to problem complexes with multiple stakeholders and interests.
In this context, this research has aimed to approach technology in the form of computational tools for urban design and planning through a critical lens, underlining how its use conditions a certain understanding of urban design and planning, limits the exploration of aspects that are not incorporated into these tools, and risks reducing the real complexity of urban design and planning processes.
2
Coding the city
Towards data-driven digital urban design and planning tools
The technological advances of the last decades have allowed digital tools for design and planning to become more sophisticated in their computational processes and increase their capacity to assimilate, transform and apply information. The following section describes through a series of examples how digital tools have advanced over time towards better the streamlined development of comprehensive, detailed, and complex urban planning and design practices.
Initial technical limitations and operational freedom
CAD (Computer Assisted Drawing) methods for design and planning have been part
of the design and planning processes since the expansion of personal computers and the AutoCAD software developer by AutoCAD in the early 1990s, slowly substituting the traditional hand-drawing approach and leading from cognitive to increasingly computational process. Practically a digital blank canvas, each scale and its corresponding level of details are introduced independently into 2D vector-based drawings, without relationships between drawings or documents nor more information than the drawing itself. The expansion of 3D modeling, which introduced a third dimension into the planar space of CAD, would follow after the initial technical limitations of personal computers were overcome. In the early 2000s, free and easy-to-use software like Rhino and SketchUp was widely adopted by design and planning practitioners for the development of projects from the very initial stages of ideation to the detailed definition of construction documents. Despite their technical limitations, AutoCAD, Rhino or similar tools are the primary tool to digital design and planning for most people due to the advantages of their simplicity and their operational freedom, and remain the preferred tool in projects that do not require excessive complexity.
Towards parametric and performance-driven tools
3D modeling tools would soon evolve to incorporate computational algorithms for modeling, leading to a new capacity of linking information to models in the form of parameters and indicators. Grasshopper, the widespread open-source visual programming language developed under the frame of Rhino in the late 2000s, was initially employed for parametric design through generative algorithms, although its open-access programming language would allow developing other tools or plug-ins for modeling. The new parametric altered the approach to architectural and urban modeling towards algorithmic generation procedures. Just a handful amongst an extensive catalog, tools like LadyBug or Urban Modeling Interface (UMI) by MIT´s Sustainable Design Lab serve sustainability and energy efficiency modeling at the building or urban scale using climatic, geometric and material
data (Reinhart, 2013). Other tools like Urban Network Analysis (UNA) from Harvard GSD City Form Lab apply the concept of space syntax to analyze street systems and the qualities of urban form (Sevtsuk, 2012). Space syntax describes how the configuration of space relates directly with how people perceive, move through and use spatial systems (Karimi, 2012). Performance-driven and algorithmic tools gained relevance as urban planning and design became increasingly regulated through data-driven performance measurement aspects such as the green building certification LEED (Leadership in Energy and Environmental Design Standards) of the US Green Building Council or other requirements for sustainable practices in design since the late 1990s. Data-driven simulations had, therefore, become a tool to comply with mandatory aspects of spatial design.
Fig 2.2 Parametric design tools and the urban scale (Sevtsuk, 2012; Reinhart, 2013)
BIM - enhancing workflows and limitations for urban design
In parallel, Building Information Modeling (BIM) developed a more advanced approach to 3D modeling through the creation of virtual information models (Autodesk, 2002). Instead of a traditional construction document package of drawings and specifications, through BIM discipline-specific knowledge and tracking of changes can be added in each stage of the design and development process, reducing the loss of information and creating a coordinated effort in managing the project (Ben-Joseph, 2011, 288). BIM enhances shared workflows and information sharing between actors in the construction process (e.g., developers, cost engineers, architects, suppliers, contractors). BIM is primarily a tool for value engineering and project management through aspects like lifecycle, cost, construction management, facility operation and application in green building. In its latest advances, it has incorporated features of generative for more performance-driven practices in building design and management. Generative design involves the integration of a rule-based geometric system, a series of measurable goals, and a system for automatically generating, evaluating, and evolving a very large number of design options. However, despite its technical capacities for project definition and green construction management, also
relevant in the path towards LEED or similar certification, BIM was mainly limited to the building scale and not applicable at broader urban contexts (Wallis, 2012). Again, this section only describes one particular tool amongst many with similar features and use.
Fig 2.3 The BIM Cycle (Wallis, 2012) Fig 2.4 Generative design (Autodesk, 2019)
Zooming out - GIS and large scale planning
In 1981, ESRI released the first commercial Geographic Information Systems (GIS) software under the name GIS Solutions for Urban and Regional Planning (ESRI, 2006) . By merging diverse sources of data through their transformation into the GIS format, different operations result in mapping visualizations that help explore patterns, relationships, and situations between input data and geography at the large scale. The capability of overlaying layers upon layers of geo-referenced data and the ability to analyze these layers quantitatively has turned GIS into a powerful tool for strategic thinking (Haley, 2007). GIS is therefore a significant support system for large scale regional and urban planning, allowing to explore casual relations towards more comprehensive and performance-based city-wide planning approaches (Chackraborty, McMillan, 2018). Performance-based planning, which dates back to approaches in land use planning and economic forecasting in the early 1950s, defines the broader context of land use regulation focusing on zoning and planning outcomes. Results-based measurement is used at both the strategic and operational levels to attain desired outcomes. The concept of GeoDesign developed by Steinitz even bring this approach to the design of geography and natural systems and its integration with the built environment considering cities as ecosystems, leading ESRI to develop its product ESRI Geodesign (Dangermond, 2013). GIS is therefore widely employed at the regional and urban scale to inform and develop a regional or city-wide development vision within which the formulation of local planning policy takes place in terms of goals, strategies, and tools and the development of the local regulation of urban development (Duarte & Gil, 2008). This regulation will set many of the
parameters which condition individual urban development projects of different scales, understood as pieces of an aggregate system.
Fig 2.5 GIS Tools (ESRI, 2006)
Defining computational urban design tools
For the first decades of data-driven design and planning tools, a duality between the tools for urban scale planning and building definition left a vacuum at the urban design scale. In this context, the theoretic approach of “City Induction” proposes an urban design framework at the scale of site planning that intended to develop urban design methodologies and analytical tools that the authors considered appropriate for a strategic and performative urban design approach (Duarte and Gil, 2008). The three modules of formulation, generation and evaluation framed three categories that would, combined, lead to a urban design development vision and a successful design outcome: design program, which encompassed requirements, values, urban patterns, and subjects; design solutions through form, space, relations, objects, and data; and, lastly, design analysis. Duarte and Gil also approached the then existing tool panorama, affirming that:
CAD Tools ≠ Urban Design tools - The components, parameters, and scale of urban design are very different. The intangible nature of public space and urban layout must be explicitly incorporated into urban design tools to facilitate the interaction between designed and non-built space
Analysis Tools ≠ Urban Design tools - GIS platforms can perform display and analysis of large scale urban developments and be essential aids to the management of the data required for the urban design process, but they are not flexible or straightforward enough to integrate directly into the design process.
Design Models ≠ Analytical models - Besides functionality and interface differences between design and analysis tools, an important distinction is in the elements that they manipulate.
Analysis ≠ Evaluation - Evaluation requires an interpretation of the analytical results as it tests them against regulations, development targets, and quality and sustainability benchmarks. (Duarte and Gil, 2008, p.260-261)
Hence, the tools of the late 2000s needed to evolve to address the gap of the urban design scale.
Relating scales, models and information
Since the “City Induction” approach, the advances of technology have led to the development of urban design tools that deal with the outlined shortcomings for defining the urban scale by combining the respective advantages of 3D modeling, GIS and BIM. Equally, realizing the relevance of multi-stakeholder engagement for the definition of urban scale projects, extensive research has targeted the improvement of the existing and limiting hardware interfaces that digital tools operated on, such as the development of Graphical User Interfaces and Tangible User Interfaces (TUI) (Ratti, Ishii & Frenchman, 2004). These were paralleled by the development of the so called Planning Information Modeling (PIM). PIM imports and aggregates into GIS the geometries and tabular data of the multiple 3D and CAD files required to represent the built environment accurately. This way, the efficiencies and power of BIM are connected in geographic space to other relevant spatial data. PIM aims to not only inform the initial stages of design, planning and information management but also to create tools that permeate the whole development processes by better informing different actors beyond planners and practitioners.
By spatially organizing and linking the standards, policies, and values that guide the development and ultimate form of the built environment to the analysis required to achieve shared awareness, GIS helps industry stakeholders better understand the future. (ESRI, 2006, p.5)
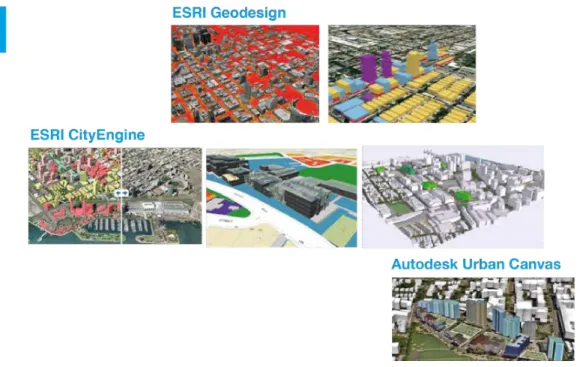
On another hand, new methodologies and computing power were developed to address the creation of detailed urban models that would allow an informed contextual approach to urban projects. In 2011, ESRI acquired CityEngine, a tool developed by Procedural Inc. specialized in the generation of 3D urban environments through a procedural modeling approach that treats the city as a giant database. Procedural modeling is an umbrella term for several techniques in computer graphics to create 3D models and textures from sets of system rules and algorithms. Such modeling streamlines the generation of complex 3D models via information as opposed to traditional time-consuming modeling processes.
Build entire 3D cities - Create a massive city all at once instead of modeling each building individually. (CityEngine, 2019, website, last accessed May 2019)
Hence, CityEngine merges geospatial analysis and spatial modeling to apply geospatial principles to the spatial shaping of cities. Embedding information such as zoning regulations and their associated variables like massing into models leads to more analytic models that express the spatial outcome of regulations and their broader implication in the built environment through simulations like shadowing. This particular capacity for streamlining the design of the large scale in short time has led to its use for tabula rasa approaches to urban design such as masterplans in the Middle East and China or Campus Planning (Dailey, 2012). The lack of success of Urban Canvas, Autodesk´s extension of Revit into the urban scale halted since 2015 indicates the limitations of these products to successfully inform more complex projects and enhance the design and planning process.
Fig 2.6 Relation of selected GIS + 3D tools (ESRI, 2006; Autodesk)
Other tools such as Modelur (Modelur Urban Design Software 2019) or Envelope City directly develop their modeling through the massing variables embedding in zoning documents in order to obtain the buildable envelope allowed by regulations. The goal is to simplify the process of sourcing
information from zoning documents and visualize the spatial expression of legislation, particularly in New York City, where the beta version has been developed. However, Envelope´s catchphrase “Opportunity Visualized. Legal-quality zoning analysis, Architecture-quality visualization. A fraction of the time and price” targets developers – or anyone interested in having fast access to assessing opportunities for development (EnvelopeCity, 2019).
Fig 2.7 Modelur (ModelurEU, 2019) Fig 2.8 Envelope (EnvelopeCity, 2019)
Delving into the age of (new) data & urban informatics
At the same time, in the Age the Internet of Things and Big, Open and Crowdsourced Data, there is a growing understanding that the increased complexity of urban challenges, from mobility to resiliency, requires new types of non-spatial data to be incorporated into spatial planning and design. New sources of information, from sensors to user-generated data from apps, allow to create and collect large amounts of data concerning diverse aspects of urban life that are many times publicly available through OpenData portals, making the tools more multidisciplinary and multiscalar. The development of the field of urban informatics has gained relevance in the process of urban design through the capacity to better understand diverse urban patterns at a new level of detail, as underlined by Ken Goulding, Director of Sasaki Strategies (Interview 6, 02/21/2019). As opposed to the purely spatial variables that most computational tools build on, this new data provides evidence for non-tangible elements like urban dynamics and flows that had long been interpreted by practitioners to develop qualitative approaches of urban design. Tools to be explained further on, like the CityScope (Alonso, Luis et al., 2018) or Urban Footprint (Calthorpe Analytics, 2017), incise on the relevance of this type of data for better understanding of urban realities that contributes to better public engagement and urban planning and policy analysis. (Thakuriah, 2015).
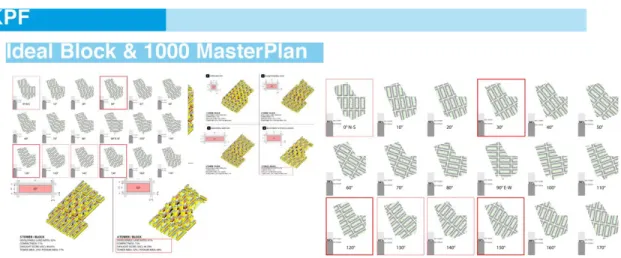
Towards a thousand masterplans - KPF´s Urban Interface
The evolution of modeling software combined with the free availability of data that can be embedded in it has resulted in the proliferation of data and performance-driven approaches to urban design by design and planning practices such Kohn Pedersen Fox (KPF), which through its 700 employees in nine global offices has designed dozens of urban scale projects around the world. The Urban Interface Group (UI) at KPF develops tools for urban design that address the challenge of applying computational design at the urban scale “due to increased computational expense, difficulty in limiting inputs, and more stakeholders involved in the process. This designer-led time-intensive process can hardly integrate the perspectives of the multitude of involved stakeholders with differing, and often misaligned objectives and expertise. Expert consultants, developers, planning agencies, councils, community boards, and the general public all bring valid perspectives that must be synthesized into a coherent vision” (Wilson, Danforth, Davila & Harvey 2019).As an attempt to respond to this challenge, the UI group developed the term Computational Urban Design (CUrbD) in order to develop a way to generate an ideal block and a thousand master plans through a Decoding Spaces Toolkit (DCT) that could integrate the different perspectives of stakeholders with sophisticated computational approaches to urban design (Wilson et al., 2019). The DCT features two interfaces that anticipate different levels of user sophistication and facilitate the understanding input and output values and their impact on design. However, the resulting modeling workflow does not offer a way to incorporate stakeholder opinions.
Finally, moving one step beyond performance-based guidelines, the machine learning module “Unsupervised Learning” auto-generates trends based on the results, opening the door to the automatization of urban design through machine learning. While aiming only to be a support decision tool to decision making in the face of the many alternatives it provides, the thousand potentially correct alternatives do not favor the design and planning processes. The Urban Interface group admits itself that “while computational urban design shows much promise for providing an iterative, quantitative approach to master planning, its place within the master planning process remains in question” (Wilson, et al., 2019).
Fig 2.10 UI´s Decoding Spaces Toolkit Modeling Process and Visualization (Wilson et al., 2019)
In its Smarter City project, KPF returns to a heavily data-driven scenario approach and affirms to be on the path towards the “smarter city” by asking whether the "smart city" can be more than technology grafted onto a traditional design.
By privileging performance over form, and merging the concerns of human experience (comfort, daylight, visual interest) with functional efficiency (sustainability, building efficiency, access to transit and green spaces), we are able to embed computational intelligence directly into the built form of the city. This iterative, analytical, simulation-based workflow is the future of architectural and urban design, creating cities that are resilient, functional, and livable. (KPF UI. 2018. Smarter City, retrieved from
https://ui.kpf.com/smarter-city)
UI defends that the urban DNA of "successful" cities can be coded into a tool that brings them together, from New York City's orthogonal street grid that allows for a flexible and efficient mix of high-density uses and Barcelona's rich variety of public spaces that support a wide range of activities to Rome's pleasurable medieval urban fabric. The overlapping of these coded layers of urban qualities results in design strategies for comfort, enjoyment, and livability as well as functional efficiency, that technically ensure that the “first city built from the internet up feels like an authentic global capital." (KPF, 2018, web)
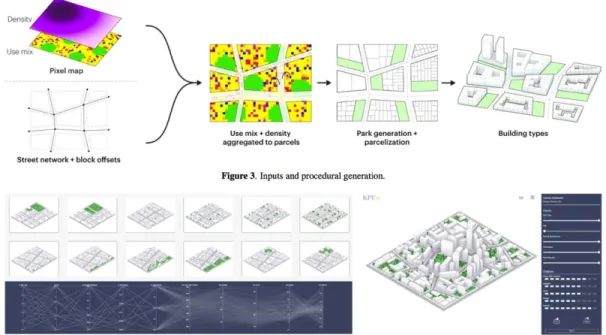
Fig 2.11 – Smarter City Project, clockwise from upper left: Diagrammatic representation of Computational Urban Design; Diagrams of tools for Outdoor Comfort, Daylight, Energy Efficiency, Visual Interest, Unobstructed Views, and Access to Parks & Transit and Urban Design Outputs (UI, 2019)
The Urban Interface group does itself question the validity of this approach, which only constitutes one of three aspects of design that are “everything they need to build a comprehensive, iterative model to generate thousands, or even hundreds of thousands of design candidates” (Wilson, et al, 2019). Along with the mentioned urban morphologies of interest, the other two aspects are the factors that define formal variation such as climate, culture, and context, and the benchmarks against which to measure success or failure. Once the inputs have been determined, the model follows a set of procedural rules to
automatically generate building geometry based on uses, building height limits, relation to public space or the size of the blocks and parks. Although the resulting buildings are currently divided into only three typologies (high-density towers on podium, middle-density buildings, and low-density infill buildings such as townhouses and small offices), rules can define any building type. It is unclear whether these rules refer to a particular coding process or whether it follows the procedural modeling process exposed before. The combination of variables like daylight, comfort, sky exposure, solar radiation, wind, energy efficiency, visibility of buildings from/to landmarks, access to parks and transit, mobility, and even subjective characteristics like "visual interest" ultimately results in the "thousand masterplans".
A “thousand masterplans” that only demonstrate a computing capacity to create a design output based on the calibration of a set of variables that are considered relevant in urban design. The integration of the different perspectives mentioned before is therefore limited to playing with set variables and exploring different outputs. This iteration on a digital tabula rasa pays little attention to the restrictions of development regulations or the urban context that may affect any of the variables the iteration plan so ideally contemplates. While KPF affirms that the “Smarter City” approach helps to determine the optimal course of action for projects to navigate the myriad, seemingly contradictory constraints that urban design projects face outside of the digital world, the infinite possibilities actually imply a loss of capacity to determine one adequate vision that then, supported through data-based evidence, can be pursued beyond digital ideals.
Qualitative design - defining urban character and identity through computational tools
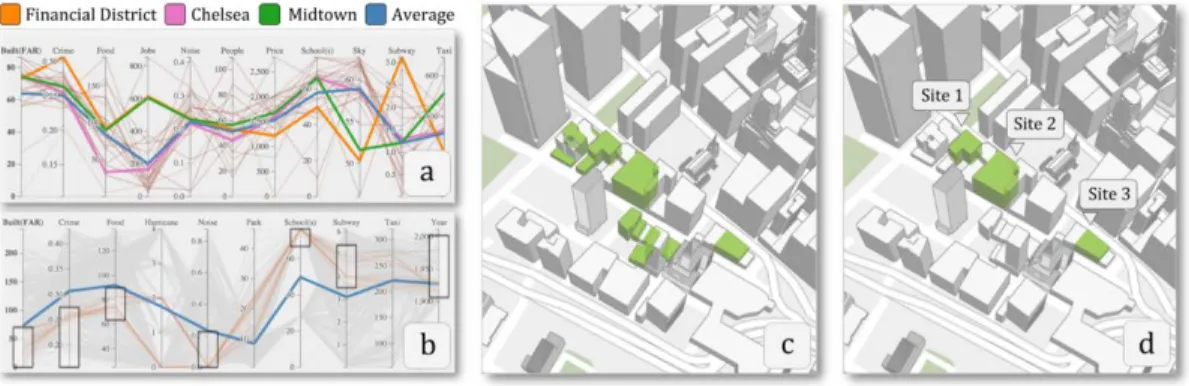
Beyond purely data-based spatial planning, UI has attempted to explore the “character” of
a neighborhood, the impacts of new development and the experience of the city in partnership with the NYU Center for Urban Science and Progress through the Urbane project (Ferreira, et al., 2015). Urbane´s key assumption is that “while the experience of a city is inherently subjective, the characteristics that shape the quality of it are not.” A combination of physical data layers, like the geometry of land, streets, parks or water bodies and qualitative data layers such as locations of crime occurrences, taxi activity, subway stations, noise complaints, and restaurants define this urban character according to the authors. Other data in different format explores heterogeneous aspects that affect urban quality. For example, line data measures sky exposure to understand the impact of massing development at the street life level, while polygon data and grid data apply area
values such jobs density, building density, average price of properties or elementary school zones. While the approximation to the concept of quality of the urban space through the combination of spatial and non-spatial values in modeling has also been employed by other research groups like the CityScope project to be detailed further on, Urbane´s obstructs a more tangible translation between the qualitative evaluation and the defined spatial features that define that quality. Its ambition to combine too many and too diverse values that can affect urban livability results in a loss of strength.
Fig 2.12 Application of Urbane in Downtown Manhattan Site (Ferreira et al. 2015)
Note /
In the opposite to the unlimited possibilities of KPF or other tools, very singular regulatory conditions have led to the development of tailored platforms to inform urban design. Both Flux Metro Austin) as well as tools
developed by Sasaki for the Texas Capitol Complex Masterplan deal mainly with maximizing development envelopes under Austin´s singular for unobstructed views of the Capitol from specific locations (Didech, 2015; Sasaki Associates, 2017). While sounding anecdotic, it provides an opposite to the potential thousand masterplans developed on a tabula rasa – here, the coding language of computational tools allows to create a tailored solution for urban design under restrictive conditions.
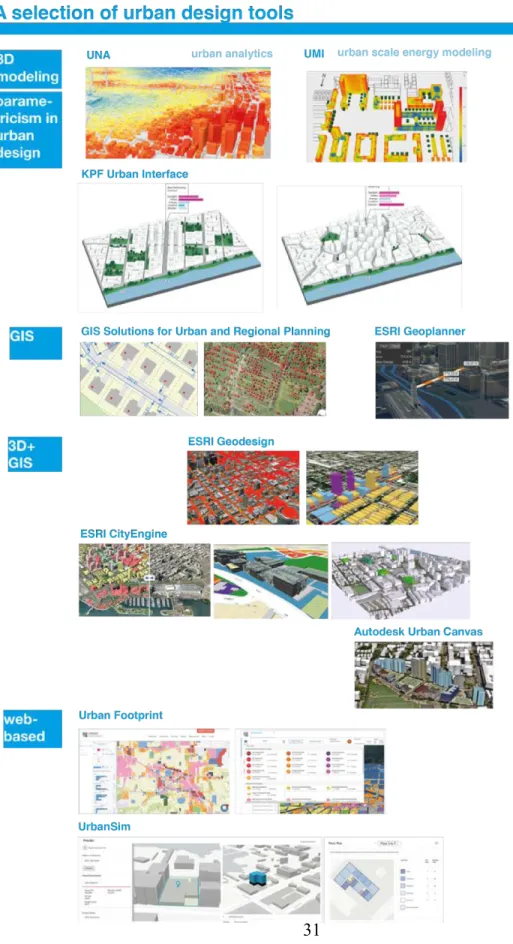
Urban Footprint and UrbanSIM and the future of web-based tools
Beyond the computational advances and the many digital tools and software highlighted so far, further advances in cloud computing have led to the development of web-based tools. Web-based tools promise advanced scenario simulation, customization through data and enhanced workflows by building on large amounts of information hosted on the cloud, from base maps to preset libraries and diverse sorts of data. Web platforms allow to overcome the limitations of software based on individual computers and the universal accessibility to and the exchange of information.Fig 2.14 Urban Footprint Interface (Urban Footprint.com, last visited May 2019)
Urban Footprint, developed by New Urbanist Peter Calthorpe through Calthorpe Analytics in 2017,
is the most prominent example for an ambitious web-based planning and design tool. Through a combination of data analytics from various sources applied to a GIS base framework with additional modeling capacities, Urban Footprint aims to become the ultimate tool for practitioners to associate any possible data to a spatial feature. In particular, Urban Footprint aims to simplify handling digitized data from development regulations like zoning, land use or some specific ordinances. Unlike Modelur or Envelope, Urban Footprint promotes itself as a tool to "restrict development" by facilitating the measuring "community impacts" through diverse metrics– clearly implying that communities tend to have a NIMBY (Not-In-My-Backyard) attitude (Calthorpe Analytics, 2017). Urban Footprint´s main components are a Base Canvas, a library of Buiding and Place Types, and an Analytics Module with extensive spatial analysis features. The Base Canvas includes residential, employment, parcel or building area features, as well as built form type and land development category. Reference layers for environmental features, infrastructure, education, transportation, land use, census, social equity or public facilities overlap this base canvas. Building and Place Types complete the palette of development options and incorporate functional aspects such as
building energy and water consumption, building-related greenhouse gas emissions, infrastructure operations and maintenance costs or household costs. Lastly, the Analytics Modules include emissions land consumption, walk and transit accessibility or transportation.
Urban Footprint approaches the economic factors of development through data from local, regional, state, and local sources that are used to derive cost and revenue factors. These vary by housing unit type, land development category, and land condition, giving local authorities a capacity to immediately assess the financial benefits to development. For other constituents of design and planning processes, like design and architecture firms, it caters a gain on efficiency and competitiveness by optimizing the design process through exhaustive analysis and comparative scenario planning. Urban Footprint also caters to developers as a tool for maximizing property investment with advanced location evaluation at the site level and alleging that potential obstacles can be known in advance through data and compliance can be ensured. By specifically targeting the interests of the different stakeholders in urban development, Urban Footprint provides not only a data-informed scenario, but also a comprehensive common ground for the stakeholders in urban scale projects.
Better data will help you craft a proposal that benefits your project, supports the local community, and ultimately streamlines the path to development. (Calthorpe Analytics. April 2019. Retrieved from http/:/urbanfoorprint.com )
Given its recent existence, the real impact of Urban Footprint remains unclear. The website outlines a series of use cases where it has been employed by private practitioners and local authorities, from the City of Madison´s 2040 Comprehensive Plan as it faces extreme growth, the City of San Diego Community Plan or the work of DZP, a practice founded by another NeoUrbanist, Andres Duany (website statement, Calthorpe Analytics, April 2019).
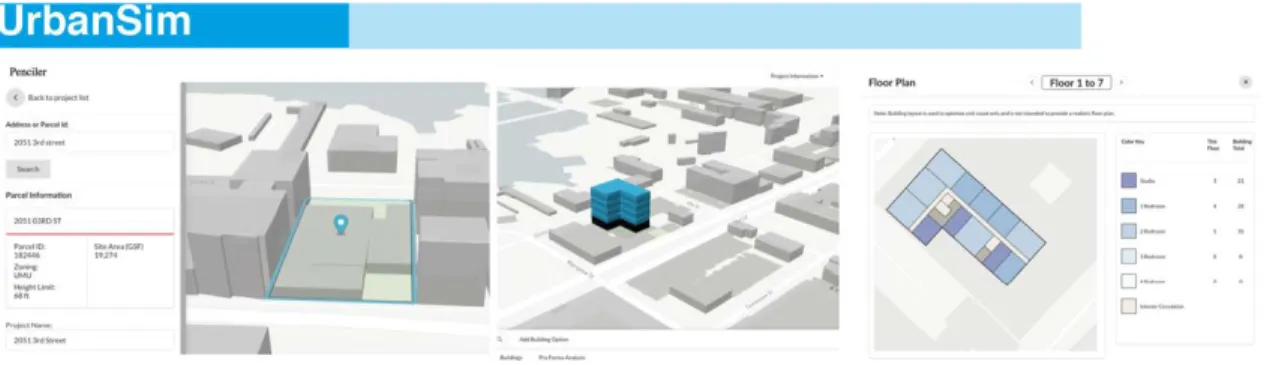
On the other side, UrbanSim´s main feature is its flexibility to allow for more open design and planning processes across different scales (Waddell, 2019). UrbanSim´s creation by Paul Waddell of UC Berkeley dates back to 1998 as an open source urban simulation system. By taking advantage of Open Data sources, its components UrbanCanvas Modeler and Penciler allow to merge quantitative data like employment, household, and socioeconomic with spatial characteristics such as street networks from OpenStreetMap or data uploaded by the user. Although it still requires technical knowledge, it simplifies the incorporation of up-to-date local data that can better analyze site-specific conditions and allow for the development of place-based solutions as opposed to the preset libraries of Urban Footprint.
Although UrbanSim markets itself partly as a “real estate market simulation tool”, its real estate development model links urban design and financial factors such as neighborhood land use mix and property values, recent development in the neighborhood or market conditions and vacancy
rates, its 150 × 150 meters resolution hinders reaching a productive level of detail. As such,
UrbanSim mostly serves the testing and development of new city-wide planning despite going in detail to parcel based zoning constraints such as floor-area-ratios, setbacks, building types, unit density, lot coverage, and maximum heights. As a particular innovation, zoning constraints can be specified to change for a location over the forecast time horizon, introducing a temporality factor most other tools ignore and which is fundamental given the long terms of urban scale development projects. This feature allows altering the development feasibility calculus for specific periods and locations in order to up-zone blocks surrounding a new transit station in the future, as a
Fig 2.15 UrbanSim interfaces (UrbanSim website, March 2019)
Unlike Urban Footprint´s limitations of granularity and detail, UrbanSim´s Penciler extension launched in 2017 reaches a better level of detail at the building scale. As opposed to a preset library, users can develop many different options for each site with different building programs and zoning constraints. This intends to help understand and visualize the effects of a local policy, such as a density bonus or inclusionary requirements, putting a focus on community engagement. Penciler allows to rapidly evaluate development feasibility for multi-family development using constrained optimization to generate a building footprint and floorplan that optimizes the unit count on a parcel, subject to the zoning and building code constraints applicable to the site. Penciler goes even further into financial aspects of development by analyzing the costs and sources of funds for each building option, including for affordable housing. Their comparison helps to understand the financial impact of different program decisions and rent profiles by even accessing 20-year cash flows. The incorporation of financial modeling of development in the planning and design process not only targets developers but every stakeholder in the process for which a long-term financial
study can is fundamental, such as local governments. Penciler was employed in San Francisco by the Mayor´s Office of Housing and Community Development to analyze the feasibility for the city of turning city property into affordable housing, expecting to add 1,500 units of affordable housing to the city each year through this method (GovTech, 2017). This example shows an approach that goes beyond purely spatial variables to address the most pressing issues of urban planning by optimizing resource allocation in different sites through data-based analysis. Lastly, Urban Sim is pursuing high-detail representation of buildings, vehicles and pedestrians to much simpler forms as part of a broader effort to support community engagement through visualization.
Chapter summary
In conclusion, the comprehensive scenarios that computational tools enable to build through quantitative and qualitative indicators of diverse nature and the possibility of rapidly understanding their impacts at the urban design level allow planners and practitioners to take more informed decisions to steer better urban design practices in large development projects. The tools have evolved beyond spatial modeling and analysis to merge the building and urban scales by also incorporating other factors that influence better design and planning practices, such as the possibility of analyzing mobility or land values through various sources of data. The advances of web-based tools that enable the incorporation of local data enable a site-specific approach to urban design as a way of solving local planning issues. By utilizing systems thinking where the connections between issues are explored across scales, integrating quantitative and qualitative information, and explicitly considering visionary or normative elements, current tools can support better development processes at the urban scale (Godspeed 2017). They also provide the coordinated view that is necessary for stakeholders to determine which strategy presents the best short-and long-term solutions to pursue more sustainable development practices (Wallis, 2012). Immediate scenario development and impact assessment also facilitate the negotiation on the features of urban scale projects between constituents and help achieve mutually beneficial outcomes. However, the potential of the tools for increasing the collaboration and understanding of stakeholders that can lead to the implementation of these comprehensive proposals remains unclear. This issue will be explored in the analysis of the proposals and development in Kendall Square in the following chapter.
3
Long term, large scale
Forces behind the design, planning and development of Kendall
Square
I /
An introduction to Kendall Square
Visions for an urban innovation district
Why Kendall?
The Kendall Square neighborhood in Cambridge, Massachusetts, has been undergoing a phased redevelopment in the form of Planned Unit Developments (PUD) since the inception of the 1969 Kendall Square Urban Regeneration Plan (KSURP). In the transformation from a decaying post-industrial site to a booming biotech hub since the mid-2000s, different urban design visions for a sustainable and livable high-density, mix-use district have been conceived within a development regulation that through various mechanisms pursues better urban design, from enforcing regulations to design guidelines and indicators. Computational tools have been instrumental for the development of these visions that reflect the different forces, strategies, and interests behind them and the shaping of urban design through them. The evolution of these visions towards implementation reflects the trade-offs and negotiation processes around the urban form that characterizes the development process of high-density, mixed-use urban projects framed by participatory planning process and high development pressures. In parallel, diverse research groups at MIT have used Kendall Square has a testing ground the tangible computing tools, which aim to advance data-based collaborative processes of urban design putting emphasis in the process and not the result. What can we learn from the complexity of Kendall to understand the potential and limitations of computational tools to steer better urban design practices?
A spatial approach to Kendall
A diverse yet unstructured urban tissue underlines the historic character of Kendall as a
crossroads of uses and patterns over time that led to the undefined morphology of today. While the MIT main campus holds relatively low-rise buildings and continuous facades as an urban perimeter, stretching along Main St. and Memorial Drive, the Golder Triangle between Main St and Broadway rises like a solid block. The Golden Triangle is the result of the intersection of several different urban grids, a most symbolic Gateway into Cambridge from which two of its main streets depart. Towards the north, high and medium rise new condominiums and low industrial structures mix with vacant lots of diverse sizes that transition towards the low-rise residential typology of Cambridge.
Fig 3.1 Kendall 1960 vs 2018 (Cambridge Redevelopment Authority, Google)
PUDS – framing long term growth
The Kendall Square Urban Renewal Plan (KSURP) guides the large-scale, long-term redevelopment of Kendall and subdivides the area into diverse Planned Unit Developments (PUDS). The administrative subdivision into PUDs is fundamental to frame the evolving conditions for development in the area and how urban design aimed to provide a response to particular urban issues. Currently, the PUDs find themselves at different levels of completion:
• 1999-2005: PUD-3 Cambridge Research Park - under construction • 2000: PUD-1 Cambridge Center & MXD – completed / under construction • 2013: PUD-5 MIT Campus East Gate (SOMA & NOMA) – under construction • 2015: PUD-2 Volpe Site – under proposals
These PUD´s have undergone minor alterations of their boundaries over time, while others, such as the PUD-5 MIT East Gate, have been defined through new zoning petitions and plan amendments. Lastly, PUDs are subject to special development regulations which emphasize the quality of urban design and will be detailed later on.
Plan amendments & the definition of urban design through numbers
The KSURP has undergone a series of amendments over time to balance a better distribution of uses and a response to market conditions and demand. Over the years, Kendall has evolved from a primarily tertiary district to accommodate more residential area in its quest to become a lively mixed-used district over two decades. Despite the focus on increasing the housing surface in the Volpe site, the residential surface is very reduced in contrast to the predominance of office, lab and tertiary uses. As a result of the development of the last years, a 2017 market profile for Kendall Square counts 52,000 employees versus roughly 7,000 inhabitants in a 0.5-mile radius (HR&A Kendall Square memo) – a nearly 8-1 ratio that is very distant from the “work-play-live” vision. This imbalance of uses also reflects itself in Sasaki´s land use analysis timeline (fig 3.3) for the Cambridge Redevelopment Authority.
The distribution of development potential and land uses for each of the PUDs of Kendall sets the frame for the definition of the development within it – and how urban form and urban design translate these numbers into buildings and spaces. An envelope of what is possible within which the CRA aims to address this imbalance of uses and achieve the goal of balanced economic vibrancy, housing, and open space to create sustainable communities through new and revitalized development (CRA, 2019, “Kendall Overview”). As a result, achieving these goals through urban design implies a trade-off in the allocation of development and uses within the defined values. The parameters associated to zoning and land use, such as lot occupancy, floor area ratios (FAR), offset, maximum height or offset define density and massing, finalize the definition of the buildable envelope. Within this envelope, developers pursue the maximization of development (and on top of that, of particularly profitable uses in the current market conditions, such as labs) and communities aim for more publicly beneficiary outcomes through the inclusion, for example, of more housing. Through their respective role in the development process, such as design review, these stakeholders exercise their power towards the implementation of projects. However, this quantitative definition has, per se, no qualitative character. Indeed, approaches through pure Euclidean Zoning fail in creating dynamic, livable communities. Thus the relevance of urban design in Kendall for achieving its vision – and of computational tools to bring them to life.
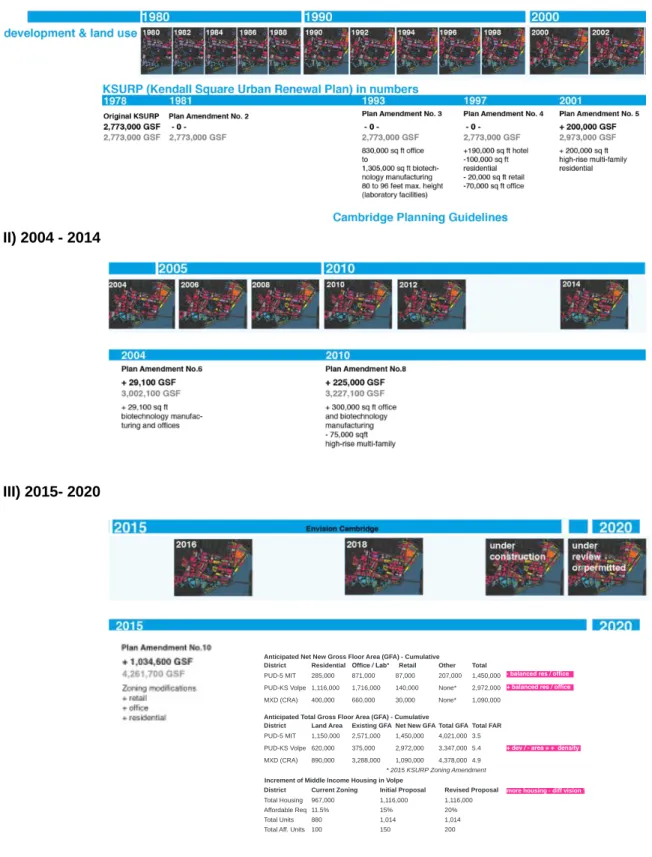
Fig 3.2 Land use in Kendall and KSURP amendments over time (elaborated via Sasaki / Cambridge CDD) I) 1980 - 2002 II) 2004 - 2014 III) 2015- 2020 District District District Residential Land Area Current Zoning Office / Lab*
Net New GFA
Revised Proposal Existing GFA Initial Proposal Retail Total GFA Other Total FAR Total Anticipated Net New Gross Floor Area (GFA) - Cumulative
* 2015 KSURP Zoning Amendment Anticipated Total Gross Floor Area (GFA) - Cumulative
Increment of Middle Income Housing in Volpe
PUD-5 MIT PUD-KS Volpe MXD (CRA) PUD-5 MIT PUD-KS Volpe MXD (CRA) Total Housing Affordable Req Total Units Total Aff. Units
285,000 1,116,000 400,000 1,150,000 620,000 890,000 967,000 11.5% 880 100 871,000 1,716,000 660,000 1,450,000 2,972,000 1,090,000 1,116,000 20% 1,014 200 2,571,000 375,000 3,288,000 1,116,000 15% 1,014 150 87,000 140,000 30,000 4,021,000 3,347,000 4,378,000 207,000 None* None* 3.5 5.4 4.9 1,450,000 2,972,000 1,090,000
+ dev / - area = + density
more housing - diff vision ?
+ balanced res / office - balanced res / office
II /
The evolution of Kendall Square
Long term redevelopment and transformation over time
From blooming industry towards decline and recovery – the birth of the KSURP
During the 19th century, Kendall Square grew into a relevant industrial area due to the availability of land for industrial uses close to Boston and the deployment of railway infrastructure to serve the industry. MIT relocated to its current site on the Charles northern bank in 1916, later sprawling from its core on Massachusetts Avenue towards the Kendall Square area in the east. Kendall was zoned industrial after zoning was introduced in Cambridge in 1924. Following World War II, many industrial businesses shut down or moved to cheaper sites (Blanding, 2015).
In 1955, the Cambridge Redevelopment Authority (CRA) was created to foster the recovery of the area through low land value and flexible development opportunities. Short after, the CRA planned Technology Square, one of the first university linked business Parks with the local government and the President of MIT. This initiative brought relevant technology corporations to set a branch across the streets of MIT. In 1964, following the Federal government´s request to initiate an urban renewal plan for Kendall Square, the CRA developed the Kendall Square Urban Development Plan (KSURP). Its largest sites meant to accommodate one of NASA’s Electronic Research Center following Bostonian President John F. Kennedy´s will. In order to transform the 42-acres of urban blight into vacant land suitable for development, the CRA acquired 70 parcels of land, relocated 100 businesses, demolished 50 buildings, filled the Broad Canal, and constructed public infrastructure improvements and roadways (Blanding, 2015). At the same time, CRA began concept planning for the 13-acre “Golden Triangle” to be privately developed. The plans show a modernist approach of repetitive buildings and green areas in between, with a certain sense of unity and urban landscape.
In 1970, NASA abandoned its operations in the project and transferred its interests to the U.S. Department of Transportation to create the Volpe Transportation Research Center on only 6.3 of the 13 acres. Only half of the parcel was built, resulting in a massive building surrounded by vast parking. It reflects the urban design ideals of its time of a car-centered city of corporate headquarters devoid of street life and residents. At the same time, the CRA actively pursued the development of job-intensive uses on surplus NASA land and the mixed-use development on the
Golden Triangle, renamed Cambridge Center in 1975. The MXD Zoning District was created in 1977, but a series of financial and planning hurdles delay approval until 1979. During that year CRA finally executes a development agreement with Boston Properties, anticipating 1,500,000 square feet of privately financed development on the Triangle to be completed in 1981 (Spalding, 2018).
The Cambridge Center on the Golden Triangle, as well as other large corporate buildings, were completed through a vision very divergent to the original idea: repetitive towers housing hotels and offices inside a mega block with public spaces in its interior. Three million square feet of office/research & development served by hotels and retail uses with little attention to ground floor retail and a pedestrian-oriented street life The 1987 Cambridge Center Plan shows the expansion into today´s MXD Use District, with dense but low massing, a large parking structure, and very little public space. It is not until 1990 that construction is completed on Ten Cambridge Center, a building to be fully occupied by Biogen later that year – the first large biotech corporation to move to Kendall (Spalding, 2018).
Fig 3.3 Kendall´s beginnings and the KSURP (Simha, 1964)
PUD-3 Kendall Square Research Park – advancing urban design
In 1998, the Kendall Square Research Park was established to complete PUD-KS 3 to the north of the Broad Canal, a primary asset for quality urban space confronted to high limitations for development linked to the remediation of its long term use as a gas plant. The Lyme group under the lead of David Clem under the advisory of urban design and planning firm Urban Strategies led by Michael Trocmé developed a masterplan for the site. This masterplan