Assessment of Potential
Opportunities for
Use of Digital Payments for
Smallholder Farmers in
Guatemala’s Western Highlands
MIT D-Lab
Comprehensive Initiative on Technology Evaluation
Massachusetts Institute of Technology
About USAID
The United States Agency for International Development (USAID) is a leading international
devel-opment agency and a catalytic actor driving develdevel-opment results.
The USAID Center for Digital Development (CDD) works to address gaps in digital access and
af-fordability and to advance the use of technology and advanced data analysis in development. CDD
pursues this mission by: 1) supporting the enabling environment that serves as a foundation for
inclu-sive digital infrastructure and services and 2) building Agency capacity via technical trainings,
tool-kits, and guidance documents, and by building a network of Mission-based specialists. CDD works to
foster market-led innovation and integrate digital technology, advanced data, and geographic
anal-ysis, and to align digital development best practices with the strategic planning and design of
enter-prise-driven programs across the Agency and with partners.
About MIT D-Lab | CITE
MIT D-Lab
works with people around the world to develop and advance collaborative approaches
and practical solutions to global poverty challenges. The program’s mission is pursued through
an academics program of more than 20 MIT courses and student research and fieldwork
oppor-tunities; research groups spanning a variety of sectors and approaches; and a group of
participa-tory innovation programs called innovation practice.
This document is part of a series of reports produced by MIT CITE. Launched at the Massachusetts
Institute of Technology (MIT) in 2012 with a consortium of MIT partners, CITE was the first-ever
program dedicated to developing methods for product evaluation in global development. Located
at MIT D-Lab since 2017, CITE is led by an interdisciplinary team and has expanded its research
fo-cus to include studies that explore the barriers to, and enablers of, effective innovation processes
and technology adoption; the outcomes of capacity building programs and technology
interven-tions; and the contexts in which technologies and innovation processes operate. This includes a
portfolio of research studies on digital financial services programs, capacity for local innovation,
internet of things for agriculture, inclusive systems innovation, fairness in machine learning, and
evaporative cooling technologies. CITE also develops the capacity of researchers to conduct
eval-uations by providing resources and tools on its methods.
This report is made possible by the support of the American People through the United States
Agency for International Development (USAID). The contents of this report are the sole
responsi-bility of MIT D-Lab
Authors
Cauam Cardoso and Jonars Spielberg, Massachusetts Institute of Technology
Acknowledgments
This research project would not have been possible without the support from staff at USAID,
im-plementing organizations, the research teams in Guatemala and at MIT D-Lab, and others. The
contributions included, but were not limited to, providing connections to key stakeholders
in-volved in the research; logistical and implementation support; valuable feedback on the research
design and questions; important data; valuable project management, co-design, and data
collec-tion knowledge and skills; and feedback on the reports and presentacollec-tions.
Specifically, MIT D-Lab and the authors would like to acknowledge the following individuals and
organizations for their assistance:
USAID: Mission support -Gerson Morales; Center for Digital Development - Ankunda Kariisa,
Alison Harrell; and Center for Development Research - Maggie Linak
MIT D-Lab: Dan Frey, Megha Hegde, Kendra Leith, Libby McDonald, and Eric Verploegen
Universidad Del Valle: Roberto Estrada, Aracely Martínez, Ana Lucia Morales, Margarita Rivera,
Fernando Silva, and Ramon Zamora
Link 4: Paul Crespo, Mayari Perez, Oscar Quan
Additional implementing organizations: Buena Milpa (CIMMYT - International Maize and Wheat
Improvement Center), USAID Guatemala, Tigo, HRNS Neumann Foundation, CDRO, MICOOPE,
Banrural, FEDECOCAGUA, POPOYAN, Salcaja, OLAM, ADIPO
TABLE OF CONTENTS
1. INTRODUCTION ... 4
2. RESEARCH DESIGN, METHODS & IMPLEMENTATION ... 5
2.1. Research Strategy ... 5
2.2. Research Frameworks ... 6
2.2.1. Operational framework for organizational stakeholders ... 7
2.2.2. Operational framework for smallholder farmers ... 8
2.3. Study Sites ... 10
2.4. Implementation Partners ... 12
2.5. Research Methods ... 13
2.5.1. Exploratory case study ... 13
2.5.2. Quantitative survey ... 14
3. RESULTS ... 17
3.1. Sample Characteristics ... 17
3.2. Six Key Findings for Guatemala ... 20
3.2.1. Financial decisions are made jointly by household members ... 20
3.2.2. Financial inclusion: lower than digital inclusion ... 20
3.2.3. Comfort level at formal financial institutions reveal little difference by gender, but larger difference by ethnicity ... 21
3.2.4. Existing relationship with DFS providers tends to precede DFS use ... 22
3.2.5. Necessity: the mother of adoption ... 23
3.2.6. Onboarding DFS use is quick ... 24
3.3. Preliminary Results of the Comparative Analysis: Four Key Comparative Findings of Guatemala & Senegal ... 25
3.3.1. DFS can strengthen the relationship between the government & SHFs ... 28
3.3.2. The sequencing of financial and digital inclusion efforts may affect DFS adoption ... 29
3.3.3. High levels of digital and financial inclusion seem to be relevant to DFS adoption only after SHFs trust the financial system ... 32
3.3.4. Supply-side participants in Guatemala showed low expectations about SHF behavior, which are often mistaken ... 33
4. CONCLUSIONS & RECOMMENDATIONS ... 36
5. RESEARCH DISSEMINATION AND CO-DESIGN ACTIVITY ... 38
6. POTENTIAL NEXT STEPS ... 40
1
SUMMARY OF KEY FINDINGS
This research project, Assessment of Potential Opportunities for Use of Digital Payments for
Smallholder Farmers in Resource Constrained Settings, explored 1) how digital financial services
(DFS) could help address the unmet financial needs of smallholder farmers (SHFs); 2) the conditions under which SHFs adopt DFS to meet these needs; and 3) how different stakeholders perceive farmer needs, DFS availability, and incentives and barriers to DFS use in Guatemala. Tables 1 and 2 provide a summary of the key findings of the report as well as a short summary of recommendations for local decision-makers. The last column in each table indicates supply-side stakeholders who are in the best position to follow up on these findings and recommendations. The report that follows provides more details on the findings, recommendations, and next steps.
Table 1 – Summary of Findings, Recommendations, and Key DFS Stakeholders in Guatemala
Finding (Provisional) Implication/Recommendation Stakeholders
Financial decisions often made
collaboratively
Household dynamics should be considered in DFS program design. For example, gender-based interventions can benefit from not assuming the context involving men and women in isolation. Providers1 + Enablers2 Farmer comfort level at bank differentiated by ethnicity, less so by gender
Financial/digital inclusion requires more than expanding access to bank account ownership and increasing DFS usage. The survey showed that the experience SHFs have when interacting with financial institutions may have an effect on how willing they are in participating in the formal financial system. Sensitivity training, alternative delivery/service options aimed at reducing bias towards farmers with an indigenous background can contribute to a more diverse DFS user base.
Providers + Enablers + Conveners3 Financial inclusion lower than digital inclusion
Widespread mobile phone ownership is not directly associated to higher DFS usage. The availability of digital technologies is unlikely to change SHFs cost-benefit calculations if the underlying terms of the financial services offered are not advantageous to them.
Providers + Enablers + Conveners
1 Providers are organizations that design and deliver digital financial services. They include actors such as banks, telecom companies, and Fintech startups.
2 Enablers are the organizations creating and maintaining the institutions that DFSs need to function as an integrated system. They help in the design of regulations, policies, and programs as well as in the identification of organizational gaps and diffusion of best practices.
3 Conveners are organizations that aggregate DFS users. They can be organized from the bottom up as farmer cooperatives or from the top down as networks of farmers selling their products for the same private-sector buyer.
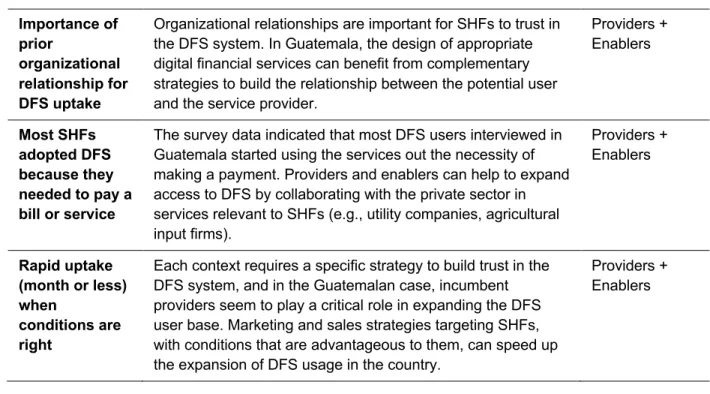
2 Importance of prior organizational relationship for DFS uptake
Organizational relationships are important for SHFs to trust in the DFS system. In Guatemala, the design of appropriate digital financial services can benefit from complementary strategies to build the relationship between the potential user and the service provider.
Providers + Enablers Most SHFs adopted DFS because they needed to pay a bill or service
The survey data indicated that most DFS users interviewed in Guatemala started using the services out the necessity of making a payment. Providers and enablers can help to expand access to DFS by collaborating with the private sector in services relevant to SHFs (e.g., utility companies, agricultural input firms). Providers + Enablers Rapid uptake (month or less) when conditions are right
Each context requires a specific strategy to build trust in the DFS system, and in the Guatemalan case, incumbent providers seem to play a critical role in expanding the DFS user base. Marketing and sales strategies targeting SHFs, with conditions that are advantageous to them, can speed up the expansion of DFS usage in the country.
Providers + Enablers
Table 2 – Summary of Comparative Analysis Findings, Recommendations, and Key DFS Stakeholders in Guatemala and Senegal
Finding (Provisional) Implication/Recommendation Stakeholders
DFS can strengthen the relationship between the
government & SHFs
Government support of SHFs in the form of direct subsidies represents an opportunity for expanding DFS usage in the country. Supply-side stakeholders should consider alternative public policies with DFS integration as a mechanism to engage SHFs.
Providers + Enablers + Conveners
The sequencing of financial and digital inclusion efforts may affect DFS adoption
DFS expansion is taking place in Guatemala where the rate of financial inclusion among SHFs is relatively high (compared to countries like Senegal). Yet, these relatively high levels of financial inclusion do not always lead to higher rates of DFS adoption. In Guatemala, many SHFs were resistant to starting to use DFS because they are used to accessing banking services in person. Enablers and providers should support awareness-raising campaigns to reassure users of the benefits of DFS.
Providers + Enablers + Conveners
3 High levels of
digital and financial inclusion seem to be relevant to DFS adoption only after SHFs trust the financial system.
Senegalese SHFs trust their financial system, which is consistent with a relatively high proportion of people joining new DFS providers. At the same time, most SHFs take over one year to adopt DFS. One of the explanations for this may be higher poverty rates, as well as low levels of financial inclusion.
In Guatemala, relatively high distrust in the financial system creates the need for additional assurances from Providers and Enablers prior to DFS adoption. However, the data shows that if trust is achieved, relatively high levels of financial and digital knowledge may increase the speed of DFS adoption. Providers + Enablers Supply-side participants in Guatemala showed low expectations about SHF
behavior, which are often mistaken
Low Supply-side expectation may lead to a misinterpretation of SHFs priorities and behavior, with a potential negative effect on policy. Key instances of potential misinterpretation of priorities: DFS adoption among SHFs seems to be more about trust and better/cheaper financial services than about financial/digital knowledge.
Providers + Enablers + Conveners
4
1. INTRODUCTION
The project, Assessment of Potential Opportunities for Use of Digital Payments for Smallholder
Farmers in Resource Constrained Settings, was established in 2018 through a partnership
between MIT D-Lab CITE (at the Massachusetts Institute of Technology) and USAID’s Feed the Future Program (D2FTF). The objective of this research is to better understand the role that digital financial services can play in the financial inclusion of smallholder farmers in Guatemala and Senegal. However, for the purposes of this report, the methods, findings, and recommendations will focus primarily on Guatemala and a comparison between the two countries, leaving the Senegal content to be further addressed in a separate document.
Though the literature on digital financial services (DFS) was relatively recently published, it has documented a variety of lessons learned through the implementation of policies and projects around the world.4 This study builds on this existing knowledge, with the goal of providing a
summary of the key findings of the study, in order to highlight the points most useful to practitioners and decision-makers in Guatemala. Academic papers containing the complete methodology and research results will be published in the future. As such, the findings and recommendations of this report are still tentative, given that they reflect the evidence and analysis available to date.
It is important to define from the outsethere three fundamental concepts for the research: Digital
Financial Services, Financial Inclusion, and Smallholder Farmer:
● Digital Financial Services (DFS): “Digital financial services” is a broad category that encompasses Mobile Financial Services (MFS) and all branchless banking services that are enabled via electronic channels. Services can be accessed using a variety of electronic instruments, including mobile phones, card-reading point of sale (PoS) devices, electronic cards (credit cards, debit cards, smart cards, key fobs), and computers. Similarly, “digital payments” refers to mobile payments and electronic payments, while “digital money” refers to mobile money and electronic money.5
● Financial Inclusion or Access to Finance: “Access to appropriate financial services that are provided responsibly and sustainably in a well-regulated environment. Although access to informal financial services (services offered by unregulated entities) is a form of access to finance, financial inclusion efforts typically focus on extending access to formal financial services (services offered by regulated entities) to poor and underserved communities.”6
4 Nicoletti, B. (2017). The future of FinTech: Integrating finance and technology in financial services. Springer. 5 Martin, C. et al (2016) USAID Guide to the Use of Digital Financial Services in Agriculture.
5 ● Smallholder Farmers: SHFs is defined in terms of the size of agricultural holdings7 and the
nature of labor on these properties.8 While acknowledging that “small is a relative concept that
is dependent on agroecological as well as socioeconomic considerations,” for this study, we define the size of smallholder farm as less than two hectares. “Labor is a key feature of smallholder agriculture. We consider a smallholding to be an agricultural holding run by a family using mostly (or only) their own labor and deriving from that work a large but variable share of its income, in kind or in cash.”
Taking into consideration these fundamental concepts, the study investigates three research questions:
1. How can digital services help address the unmet financial needs of smallholder farmers? 2. Under what conditions do smallholder farmers (SHFs) adopt digital financial services to
address these unmet needs?
3. How do stakeholders in the DFS supply and demand-side9 perceive farmer needs, DFS
availability, and incentives and barriers to DFS use?
2. RESEARCH DESIGN, METHODS & IMPLEMENTATION 2.1. Research Strategy
The strategy adopted to respond to the three questions consisted of five phases and took place between June of 2018 and December of 2019. The research phases represent a mix of qualitative and quantitative methodological practices, triangulating different types of data in order to increase the confidence in the results presented.10 The integration of methodologies followed a sequential
exploratory design, where an initial case study is followed by a subsequent quantitative survey.11,12 This kind of strategy is adequate for cases where a detailed description of the context
7 From Lowder, S. K., Skoet, J., & Raney, T. (2016). The number, size, and distribution of farms, smallholder farms,
and family farms worldwide. World Development, 87, 16-29.
8 HLPE (2013). Investing in smallholder agriculture for food security. A report by the High-Level Panel of Experts on
Food Security and Nutrition of the Committee on World Food Security.
9 The definition of “supply” and “demand” sides is available in detail in section 2 of this report. 10 Jick, T. D. (1979). Mixing qualitative and quantitative methods: Triangulation in action. Administrative science
quarterly, 24(4), 602-611.
11 Pluye, P., & Hong, Q. N. (2014). Combining the power of stories and the power of numbers- mixed methods
research and mixed studies reviews. Annual review of public health, 35, 29-45.
12 Creswell, J. W., & Creswell, J. D. (2017). Research design: Qualitative, quantitative, and mixed methods
6 is necessary to inform data collection on specific trends and behavioral patterns of the research subjects.13,14
● Phase 1 - Preliminary research phase, which identifies key research questions, as well as provides the scope and general features of the study design
● Phase 2 - Comparative case-studies (one for each country) describing both the context within which local smallholder farmers live and work and the digital financial services national ecosystem
● Phase 3 - A quantitative survey to identify smallholders’ (actual and perceived) financial needs, and conditions for DFS adoption
● Phase 4 - Analysis of the data collected through the survey, identifying key results and lessons for local decision-makers
● Phase 5 - A series of research dissemination events, including presentations at USAID headquarters in DC and USAID Guatemala, as well as one public workshop and one co-creation event for key DFS stakeholders in Guatemala
2.2. Research Frameworks
A research framework was built to operationalize each research question, based on the expert interviews and a review of the literature performed during this initial phase of the study (see Figure 1). The first question centers around the dynamics of the supply of digital financial services and the demand for these services by smallholder farmers. The second focuses on the smallholder farmers’ behavior and decision-making in terms of barriers and incentives to DFS adoption. In the third question, the goal is to compare and contrast how supply-side actors – organizational stakeholders responsible for providing services, creating an enabling environment for DFS, and
convening clients – interpret DFS challenges and opportunities, vis-à-vis demand-side
populations – smallholder farmers who potentially could, or do use DFS.
13 Gable, G. G. (1994). Integrating case study and survey research methods- an example in information systems.
European journal of information systems, 3(2), 112-126.
14 Ivankova, N. V., Creswell, J. W., & Stick, S. L. (2006). Using mixed-methods sequential explanatory design: From
7 Figure 1 – Summarized Research Framework
As a complement to this general structure, the research team developed operational frameworks for “supply” and “demand” constructs. The objective was to limit the scope of the study and lay out clear guidelines for the development of sampling strategies and the selection of data collection methodologies.
2.2.1. Operational framework for organizational stakeholders
The operational framework for organizational stakeholders was designed around target three types of organizations (See Figure 2):
• DFS Providers: Providers are organizations that design and deliver digital financial services, who may or may not target farmers directly. They include more traditional actors such as banks and telecom companies, but also newer digital players like Fintech startups. Overall, understanding providers’ perspectives (including staff and third-party agents) is important because they can reveal what design principles and assumptions they use when creating services and the challenges and opportunities that emerge during DFS implementation.
• Conveners: Conveners are organizations that aggregate DFS users, often providing the scale that allows these services to be effective. They can be organized from the bottom up as farmer cooperatives, or from the top down as networks of farmers selling their products for the same private-sector buyer. By talking to conveners, the research team
was
able to understand the unique characteristics of these networks, and the preconditions they pose to the appropriate deployment of DFS.Role of Digital Services in SHFs Financial Inclusion
Question 3 - Comparing Key Respondents: SHFs & Organizational Stakeholders
Question 1: SHFs DFS Needs
Demand: SHFs
Financial Needs Supply: DFS Availability
Question 2: SHFs DFS Adoption
8 • Enabling Organizations: Enablers are the organizations creating and maintaining the institutions that DFS need to function as an integrated system. They help in the design of regulations, policies, and programs, as well as in the identification of organizational gaps and diffusion of best practices. From them, the study uncovered more about the history of DFS in the country, major sectoral initiatives, and current DFS challenges and opportunities at a systemic level.
Figure 2 – Summarized Sampling Framework for Organizational Stakeholders
2.2.2. Operational framework for smallholder farmers
The operational framework for smallholder farmers was designed according to the following criteria (See Figure 3):
• Institutional Partners: Since USAID is the main institutional partner of the study, the research took advantage of its infrastructure and contacts in the field to implement data collection activities. However, the research sought to minimize potential selection bias by collecting additional data via alternative partners. These are organizations without formal
Organizational Stakeholders DFS Providers Farmer Specific
New AgritechsA. New
Traditional Agricultural B. Banks General New C. Local Fintecs Service D. New Providers Traditional E. Micro-Finance Institutions F. Banks G. Telecom Companies Conveners H. Bottom-up: Farmer Cooperatives
I. Top-Down: Private Single Buyers Enabling Organizations J. Government K. International Agencies L. NGOs
9 connections with USAID such as local DFS providers, private agricultural firms with large network of suppliers, or SHF cooperatives. Due to feasibility considerations, the main goal is to select at least one of these organizations and recruit some of their clients as a reference group.
• Location: The study focused on areas where access was feasible, the population of low-income smallholder farmers was large, and agricultural practices were diverse and representative of the local context. Recognizing USAID as our main implementing partner, it was critical for the study that research sites overlapped with areas where USAID projects were operational.
• Gender: Depending on local social norms and other contextual factors, women and men can have dissimilar experiences related to agriculture, as well as DFS access and use. As such, the study included gender considerations in its sampling (e.g., building a sample with a proportional number of male and female respondents), data collection methods and practices (e.g., in the qualitative phase, focus group discussions were separated by gender), and research content (e.g., asking questions that identify gender-based variations in behavior).
• Crop Variety: Crop variety was an important factor in assuring the comparability between the case studies in Senegal and Guatemala (see table below). As such, the study selected crop types considering both context-specific factors (export value and national consumption patterns), and aspects that would favor comparability (by selecting crops that are relevant to both countries).
• DFS Adoption: One of the objectives of the study was to understand behavior patterns of smallholder farmers that adopt DFS and those who do not. As such, research sampling, methods, and questions were designed trying to capture the experience of participants who were DFS users and who were not.
• Socio-cultural Characteristics: Both Senegal and Guatemala are characterized by unique social and cultural characteristics. Mixing the locations of data collection and being mindful of at least some of these cultural differences during fieldwork can prevent biases in the analysis. The objective was to avoid a situation in which the pool of respondents was too heavily populated with people from the same religion, ethnicity, or historical background.
10 Figure 3 – Summarized Sampling Framework for SHFs
2.3. Study Sites
The study focused on two major areas in Guatemala. The first was Guatemala City, which is the country’s capital, and where most relevant institutional stakeholders are located. The second was the Western Highlands, comprised of the departments Quiché, San Marcos, Huehuetenango, Quetzaltenango, and Totonicapan (see Figure 4).
These departments have been historically associated with high levels of poverty and malnutrition,15 and have a large concentration of smallholder farmers and indigenous
populations,16 which are both consistent with the research objectives (see Table 3). In addition,
USAID and other development organizations concentrate food security and income generation
15 CSIS (2017) Tracking Promises - Analyzing the Impact of Feed the Future in Guatemala
16 Recent estimates indicate that Guatemala’s population is between 45% and 60% indigenous, divided between 24 ethnic groups. Indigenous populations are prevalent in the Western Highlands, where there are as many as 1.6 million on them live. Mam and K’iche’ ethnicities are among the largest groups in the region, so our study conducted field activities in areas where these two ethnicities would be represented in the sample. IWGIA (2018) Guatemala. Available at: https://www.iwgia.org/en/guatemala and CSIS (2017) Tracking Promises - Analyzing the Impact of Feed the Future in Guatemala. Available at: https://www.csis.org/analysis/tracking-promises
INSTITUTIONAL PARTNER [SHFs] Access to Irrigation Rain-fed Irrigated Gender Male Female Crop Variety Rice Groundnut Cotton Maize Location Country's Capital Area A Area B DFS Adoption DFS User DFS Non-User Socio-cultural Characteristics Religion Ethnicity
11 activities in that region,17 facilitating the selection of partner organizations to help implement the
study.18
Figure 4 – Map of Study Sites
17 USAID (2017) Guatemala Fact sheet. Available at:
https://www.usaid.gov/sites/default/files/documents/1862/Guatemala_External_Fact_Sheet_July_2018.pdf
12 Table 3 – General Characteristics of Potential Research Sites in Guatemala
Characteristics/Department Quetzaltenango Huehuetenango Quiche San Marcos Totonicapan
Rural Population19 42% 71% 70% 73% 53%
Indigenous Population20 52% 58% 89% 27% 97%
% of Rural Population, within total population living in poverty21
52% 82% 75% 81% 58%
Major Indigenous Group Mam + K’iche’ Mam K’iche’ Mam K’iche’
HDI22 0.58 0.49 0.47 0.51 0.58
USAID Operations Yes Yes Yes Yes Yes
2.4. Implementation Partners
The fieldwork planning and implementation in Guatemala relied on several institutional partners (see Table 4 below) for the identification and recruitment of research participants, especially during phases 2 and 3 of the project. This group represents a diverse pool of organizations with and without direct ties to USAID and working in a variety of fields such as banking, telecom, agricultural businesses, farmer cooperatives, and NGOs.
19 Government of Guatemala (2011) Mapas de pobreza Rural en Guatemala 2011. Available at:
https://www.ine.gob.gt/sistema/uploads/2015/09/28/V3KUhMhfgLJ81djtDdf6H2d7eNm0sWDD.pdf
20 Ibid (Govt. of Guatemala (2011) 21 Ibid (Govt. of Guatemala (2011) 22 Ibid (Govt. of Guatemala (2011)
13 Table 4 – Implementation Partners in Guatemala
Organization Name Organization Type
Universidad Del Valle (UVG) Local University
Buena Milpa (CIMMYT - International Maize and
Wheat Improvement Center) Research Organization
USAID Guatemala (Projects Más Frijol and Mas
Riego) International Development Organization
Tigo Private Business (Telecom Company)
HRNS Neumann Foundation Non-Governmental Organization
CDRO Non-Governmental Organization
MICOOPE Farmer Cooperative
Banrural Bank (Largest Rural Bank in Guatemala)
FEDECOCAGUA Federation of Cooperatives
POPOYAN Private Business (Large Agricultural contractor and exporter)
Salcaja Farmer Cooperative
OLAM Private Business
ADIPO Farmer Cooperative
2.5. Research Methods
With the development of the general and operational research frameworks, as well as the definition of the study sites and implementation partners, Phases 2 and 3 of the study used complementary methodologies.
2.5.1. Exploratory case study
Phase 2 consisted of an exploratory case study focusing on Guatemala’s Western Highlands and Guatemala City. The strategy allowed the research team to test the feasibility of the study, develop operational measurements, and form tentative hypotheses to be tested in Phase 3.23,24 Phase 2
was largely qualitative, and followed a grounded theory approach,25 creating a “thick description”
of the local context, its social and economic characteristics, as well as participants’ actions and
23 George, A. L., & Bennett, A. (2005). Case studies and theory development in the social sciences. MIT Press. 24 Yin, R. K. (2017). Case study research and applications: Design and methods. Sage publications.
25 Corbin, J. M., & Strauss, A. (1990). Grounded theory research: Procedures, canons, and evaluative criteria.
14 points of view.26, 27 This information was critical to better understand smallholder farmers, what
financial needs they have, and the conditions underlying their decision to use digital financial services or not. Specifically, Phase 2 relied on the following qualitative methodologies:
● Document analysis: The team reviewed project documents, reports, and databases produced by relevant organizational stakeholders. The goal was to identify historical and contextual aspects that can inform the development of the research questions and hypotheses the team probed during Phase 3.28
● Direct observation: During the fieldwork, researchers sought opportunities to observe research participants in their own environment. For example, field visits included trips to farming input stores, mobile agent shops, and local bank branches.
● Semi-structured interviews: The research team interviewed representatives of organizational stakeholders and smallholder farmers as outlined in the research framework. The priority was to create a variability sample,29 where respondents provide a diverse set of
perspectives about DFS’ relevance to smallholder farmers. Specific interview protocols were prepared to address questions specific to each target population.
● Focus group discussions: FDGs were used as a mechanism for data collection from smallholder farmers. This methodology allows for the gathering of information from a relatively large number of respondents within a short timeframe.30 Furthermore, FDGs are
considered friendly to people who cannot read or write (which is the case of some SHFs), and to people who may otherwise feel intimidated by individual interviews.31
2.5.2. Quantitative survey
Phase 2 provided details about two key factors: i) contextual nuances of the local DFS ecosystem; and ii) logistical constraints that helped the team define the scope and scale for Phase 3. The development of the survey instrument was also informed by existing research on
26 Maher, C., Hadfield, M., Hutchings, M., & de Eyto, A. (2018). Ensuring Rigor in Qualitative Data Analysis: A Design
Research Approach to Coding Combining NVivo With Traditional Material Methods. International Journal of Qualitative Methods, 17(1), 1609406918786362.
27 Corbin, J. M., & Strauss, A. (1990). Grounded theory research: Procedures, canons, and evaluative criteria.
Qualitative sociology, 13(1), 3-21.
28 Bowen, G. A. (2009). Document analysis as a qualitative research method. Qualitative research journal, 9(2),
27-40.
29 Ibid Daniel, J. (2011)
30 Stewart, D. W., & Shamdasani, P. N. (2014). Focus groups: Theory and practice (Vol. 20). Sage publications. 31 Kitzinger, J. (1995). Qualitative research: introducing focus groups. Bmj, 311(7000), 299-302.
15 financial and digital inclusion in rural areas.32,33,34,35,36,37,38,39 This evidence was especially useful
to frame questions about smallholder farmers’ access to, and adoption of DFS. However, the same was not true for comparing how supply and demand sides perceive DFS challenges. With little precedent in the digital finance literature, the team pursued methodological strategies in areas like medicine, where there have been studies about how doctors and patients differently perceive symptoms of chronic diseases,40,41 as well as in political science, where scholars
explored how the general public and policy experts perceive corruption at the national level.42
Drawing from these examples, the research team created an adapted “mirror survey” approach, which consists of two questionnaires – one for smallholder farmers, and another for participants from the supply-side – with similar questions and structure (see Tables 5 & 6).
The demand-side questionnaire had a total of 85 questions and was conducted in person by a team of local researchers. The supply-side questionnaire had 75 questions and was conducted either in person by the Guatemalan research team or self-administered online via an anonymous survey link. Both questionnaires required between 30 and 45 minutes to complete.
32 CGAP (2016) Smallholder Household Survey - Building the Evidence Base on the Agricultural and Financial Lives
of Smallholder Households. Available at: http://microdata.worldbank.org/index.php/catalog/2922
33 Finau, G., Rika, N., Samuwai, J., & McGoon, J. (2016). Perceptions of digital financial services in rural Fiji.
Information Technologies & International Development, 12(4), pp-11.
34 World Bank (2017) Global Findex Questionnaire. Available at:
https://globalfindex.worldbank.org/sites/globalfindex/files/databank/2017%20Findex%20questionnaire.pdf
35 BFA (n.d.). Financial Diaries Project Questionnaires. Available at: http://financialdiaries.com/about 36OECD (2018). Financial inclusion and consumer empowerment in Southeast Asia. Available at:
http://www.oecd.org/finance/Financial-inclusion-and-consumer-empowerment-in-Southeast-Asia.pdf
37CGAP (2018). Financial Diaries with Smallholder Families. Available at:
http://www.cgap.org/data/data-financial-diaries-smallholder-families
38IFC (2016). Mobile banking Questionnaire for users. Available at:
https://www.ifc.org/wps/wcm/connect/571be8004e23021c939fbb7a9dd66321/Tool+3.9.+Market+Questionnaire+-+Users.pdf?MOD=AJPERES
39IFC (2016). Mobile banking Questionnaire for non-users. Available at:
https://www.ifc.org/wps/wcm/connect/75112a804e2301d39396bb7a9dd66321/Tool+3.10.+Market+Questionnaire+-+Non-Users.pdf?MOD=AJPERES
40 Barr, R. G. et al (2005). Physician and patient perceptions in COPD- the COPD resource network needs
assessment survey. The American journal of medicine, 118(12), 1415-e9.
41 Celli, B. et al (2017). Perception of symptoms and quality of life–comparison of patients’ and physicians’ views in
the COPD MIRROR study. International journal of chronic obstructive pulmonary disease, 12, 2189.
42 Razafindrakoto, M., & Roubaud, F. (2010). Are international databases on corruption reliable? A comparison of
16 Table 5 – Examples of Questionnaire Vignettes & Questions
Demand-side vignette: In this section of the research, we will ask you a few questions about how you use digital technologies such as mobile phones.
Demand-side Question: Do you own a mobile phone?
Supply-side vignette: In this section of the survey, we will ask you will ask you about YOUR PERCEPTION of
how smallholder farmers use digital technologies such as mobile phones.
Please think of a real small farmer with whom you have had contact recently, who is a representative of most of the farmers you work with.
If you do not have direct contact with small farmers yourself, think of a typical small farmer who benefits from the projects or services provided by your organization.
Supply-side Question: Do you think this typical smallholder farmer owns a mobile phone?
Table 6 – Mirror Questionnaire Structure
Questionnaire
Section “Demand-side” Survey Structure (Questionnaire to be responded by
Smallholder Farmers themselves)
“Supply-side” Survey Structure
(Questionnaire to be responded by relevant stakeholders in the “supply-side”, about how do they think a “typical” smallholder farmer, in their experience, would respond to the same question)
Section 1 Socioeconomic Profile
(age, gender, education, etc.)
Participant’s Socioeconomic Profile
(age, gender, education, professional activity, type of employer, etc.)
Section 2 Agricultural Profile
(type of crop, land ownership, etc.)
Typical SHF - Socioeconomic & Agricultural Profile
(age, gender, education + type of crop, land ownership, etc.)
Section 3 Digital Inclusion Profile
(mobile phone/computer ownership, usage, etc.)
Typical SHF - Digital Inclusion Profile
(mobile phone/computer ownership, usage, etc.)
Section 4 Financial Inclusion Profile
(bank account ownership, usage, as well as savings, borrowing, transfers, payments and insurance activities)
Typical SHF - Financial Inclusion Profile
(bank account ownership, usage, as well as savings, borrowing, transfers, payments and insurance activities)
Section 5 Barriers & Incentives to DFS Adoption
(DFS adoption and usage, reasons for using DFS or not, etc.)
Typical SHF - Barriers & Incentives to DFS Adoption
(DFS adoption and usage, reasons for using DFS or not, etc.)
Whereas the demand-side questionnaire would provide data for answering research questions 1 and 2, the supply-side questionnaire allowed the team to address question 3. Most of the analysis contained in this report was based on descriptive statistics of relevant sections of the survey, while chi-square or t-tests were used to conduct bivariate analyses of some variables to determine significant associations, especially in the comparative analysis between demand and supply responses, as well as between the data gathered in Guatemala and Senegal.
17
3. RESULTS
The results presented here were shared with key stakeholders in Washington, D.C. and Guatemala. In Guatemala, the team also worked with Link 4 to host a co-design workshop to discuss the findings and create teams of local stakeholders to brainstorm ideas to address challenges identified through the research.
3.1. Sample Characteristics
Following a purposeful, multi-stage sampling strategy, the implementation partners helped identify and recruit participants for the survey following the supply and demand operational frameworks developed by the research team. The total sample size of the study was 317. The sample for Phase 2 consisted of 60 participants (35 demand and 25 supply) from which data was collected through semi-structured interviews or focus group discussions. Phase 3 relied on a larger sample of 317 respondents who completed the mirror questionnaires. Figure 5 provides additional details about the location of data collection activities. Since the goal of the report is to provide a summary of key research findings, the following sections of this document will focus on the results from Phase 3 of the study.
18 Figure 5 – Map of Study Sites
Research Phase Demand-Side Supply-Side Total
Phase 2 35 25 60
Phase 3 168 149 317
Total 203 174 377
As Figure 6 shows, sampling efforts were successful in identifying a diverse group of smallholder farmers across the Western Highlands. There was a 60:40 proportion of male respondents, while most participants were above the age of 40 (64%). As expected, 57% of all farmers interviewed had primary education, which is characteristic of that population in the region.43 Ninety-one
percent of participants lived and worked on plots of land smaller than two hectares. Figure 7 describes some key characteristics of the supply-side sample, which included a diverse group of professionals from the private, public, and nonprofit sectors. As expected, this group tended to have higher educational levels, was predominantly male (72%), and younger (44% between 25-39 years old).
19 Figure 6 – Selected Characteristics of the Demand-side Sample
20
3.2. Six Key Findings for Guatemala
The preliminary analysis of Phase 3 data produced six relevant findings for policy makers and project implementers in Guatemala. Such findings are summarized in the following sections.
3.2.1. Financial decisions are made jointly by household members
As Figure 8 shows, most smallholder farmers interviewed in Guatemala indicated that they make daily financial decisions together with other household members - 69% of male, and 61% of female respondents. This pattern continues largely consistently along gender lines regarding the proportion of respondents who reported making decisions alone (25% male and 22% female). Finally, the proportion of women indicating that other household members make daily financial decisions for them is higher than their male counterparts (16% vs 6%, respectively). These numbers indicate that both DFS-related research, programs, and projects could benefit from targeting households instead of individuals.
Figure 8 – How SHFs Make Daily Financial Decisions
3.2.2. Financial inclusion: lower than digital inclusion
Figure 9 provides three measures of financial and digital inclusion. In terms of bank accounts, 43% of respondents indicated that they had access to a bank account, while only 23% held an account in a non-bank financial institution, such as a microfinance organization. On the other hand, the overwhelming majority of smallholder farmers interviewed owned mobile phones (92%). The level of digital inclusion (measured by phone ownership) is especially significant given the fact only 62% of survey participants have a household with a toilet and 45% have a refrigerator
21 in their homes. As such, the widespread ownership of mobile phones among smallholder farmer suggests an opportunity for future policies and projects to expand financial inclusion through digital means.
Figure 9 – Comparative Levels of Financial Inclusion vs. Digital Inclusion
3.2.3. Comfort level at formal financial institutions reveal little difference by gender, but larger difference by ethnicity
Figure 10 provides evidence on the experience of different smallholder farmer groups when they go to a bank. Most participants have a positive experience, but there are important variations in terms of gender and ethnicity. In Figure 10, on the left side, male and female respondents display a similar pattern when reporting how they feel when they go to a bank. Seventy-one percent of male respondents feel welcomed or very welcomed, while 73% of female respondents feel the same way. However, the figures on the left side indicate a different situation when it comes to ethnicity: while 32% of indigenous participants said they feel a little or very uncomfortable when they go to a bank, only 14% of non-indigenous reported the same experience.
22 Figure 10 – SHF Experience at a Bank, Disaggregated by Gender and Ethnicity
Such numbers highlight the need for future interventions to look beyond bank account ownership and usage, including alternative factors influencing SHFs’ decision to join the formal financial system. User experience at banks is one indicator showing that indigenous populations can face cultural and social barriers that influence their willingness to trust financial institutions with their resources.
3.2.4. Existing relationship with DFS providers tends to precede DFS use
As Figure 11 shows, the proportion of survey participants who are DFS users is relatively small: only 39% of smallholder farmers interviewed identified as such. At the same time, the graph on the right side shows that among DFS users, 68% of them had a previous relationship with their DFS provider. This was the case, for example, of many TIGO (the largest provider of mobile phone services in Guatemala) clients that over time also started to use TIGO Money (the company’s DFS service). At least two lessons can be drawn from these indicators. First, incumbent telecommunication and financial companies have an opportunity to leverage the trust of existing clients if they choose to start offering digital financial services.44 Second, new entrants
into the DFS market in Guatemala may face difficulties in attracting SHFs, given that they must find alternative ways of building trust or create incentives that speak directly to this type of client.
44 As of 2018, TIGO, for example, had roughly 54% market share in Guatemala. More information at:
https://www.millicom.com/media/3398/comcel-trust-mda-q1-2018.pdf; and
https://www.commsupdate.com/articles/2019/01/25/america-movil-acquires-telefonica-assets-in-guatemala-el-salvador-for-usd648m/
23 Figure 11 – DFS Use among SHFs and their Relationship with DFS Providers
3.2.5. Necessity: the mother of adoption
Figure 12 displays a clear pattern among the smallholder farmers interviewed for the survey relative to their initial incentives to start using digital financial services: 55% needed to pay a bill or service and took advantage of the fact that they could perform the transaction digitally. The second most prevalent reason for DFS use was to receive money transfers (25%), followed by sending money transfers (13%), and keeping their money safe (13%). Only 6% of respondents indicated having joined DFS because it would allow them to save money, indicating that the appeal of such services to existing customers is not cost-related. At the same time, only a small number of respondents (2%) indicated having joined DFS to receive government benefits, which could be consistent either with a low adoption of digital services by government organizations in Guatemala and/or a low level of penetration of this type of service among smallholder farmers. In any case, these results show that there is space for top-down or supply-led initiatives to expand DFS to smallholder farmer populations, instead of a more hands-off approach such as waiting for the demand to grow organically in the Western Highlands.
24 Figure 12 – Motivation for DFS use among Smallholder Farmers
3.2.6. Onboarding DFS use is quick
Figure 13 describes how long it took for current DFS users from becoming aware of digital financial services to starting to use them. For 42% of customers, it took less than a week, whereas 32% indicated it took between one week and one month. Nineteen percent started using DFS in one month to one year, and only 6% did so after one year. These numbers indicate that, at least among the 39% of smallholder farmers that became DFS users, there was a high degree of willingness to adopt digital services once they became aware of them.
One of the potential explanations for the short time between awareness and adoption can be found in Figure 11, which showed roughly two-thirds of DFS users having a previous relationship with their providers when they started to use their services. The existence of a relationship of trust between firms and clients can favorably dispose clients to new services from that same company.
25 Figure 13 – Relationship between DFS Awareness and Use among SHFs
3.3. Preliminary Results of the Comparative Analysis: Four Key Comparative Findings of Guatemala & Senegal
In addition to the results specific to Guatemala, the study produced additional findings based on the comparison of the data produced in Guatemala and the survey conducted in Senegal. As mentioned in the beginning of this report, notwithstanding their different historical, social, and geographical characteristics, there are some structural similarities that make such a comparison useful for both countries as a reference against which they can assess their own performance. For example, the presence of a large population of low-income smallholder farmers encouraged local and international agencies to promote DFS as a scalable path for financial inclusion in both countries.45 Yet, their experiences defied expectations about DFS adoption for opposite reasons.
Guatemala, which in theory had all the preconditions for a successful expansion of DFS, has struggled to expand DFS adoption and use (see Table 7). Senegal, on the other hand, has made substantial progress in the last decade, in spite of much poorer socioeconomic conditions and weaker digital and financial infrastructure (see Table 8). Such apparent contradictions indicate that the expansion of DFS use among smallholder farmers may be influenced, but not entirely determined by the preexisting social, economic, and political contexts of each country.
26 Table 7 – Selected Socioeconomic and DFS Infrastructure Indicators for Guatemala and Senegal 46
Selected Indicators Year Guatemala Senegal
Socio-economic indicators
Population (Total), in millions 2017 16. 9 15.9
Population (Rural), in millions 2017 8.3 8.4
GDP per capita, PPP (current international $) 2017 8,150 2,712
Poverty headcount ratio at $3.20 a day (2011 PPP) (% of
population) 2014/2011 24.0 67.0
Literacy rate, adult total (% of people ages 15 and above) 2013 77.0 43.0 Access to electricity, rural (% of rural population) 2016 86.0 38.0 Digital Infrastructure Indicators
Secure Internet servers (per 1 million people) 2017 68.2 8.6
Mobile cellular subscriptions (per 100 people) 2017 118.0 99.0
Fixed broadband subscriptions (per 100 people) 2016 3.1 0.6
Financial Infrastructure Indicators
Credit registry coverage (% of adults) 2018 17.5 0.6
Commercial bank branches (per 100,000 adults) 2016 33.0 5.0
Automated teller machines (ATMs) (per 100,000 adults) 2016 36.0 6.0 Table 8 – Selected DFS Indicators for Guatemala and Senegal 47
Selected Indicators Year Guatemala Senegal
Mobile Money account ownership, Total (% age 15+) 2017 2.1 20.9
Mobile Money account ownership, Rural (% age 15+) 2017 1.7 19.5
Sent or received domestic remittances through a mobile phone (% age 15+) 2017 1.1 31.0 Used a mobile phone or internet to access an account, Total (% age 15+) 2017 4.5 29.4 Used a mobile phone or internet to access an account, Rural (% age 15+) 2017 4.1 26.3
46 All data retrieved from the World Bank Development Indicators. Available at: https://data.worldbank.org 47 All data retrieved from the World Bank Development Indicators. Available at: https://data.worldbank.org
27 Used the internet to pay bills in the past year, Total (% age 15+) 2017 4.0 9.0 Used the internet to pay bills in the past year, Rural (% age 15+) 2017 3.1 5.1
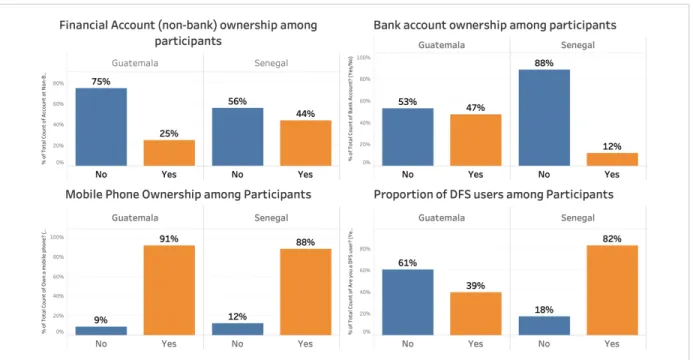
As a way to confirm the validity of the comparison between the two countries, Figure 14 tries to replicate the patterns described in Tables 7 and 8 using data from the study sample (see Table 9 for details of the sample in each country). The numbers show that, indeed, similar conditions were identified among the SHFs interviewed in both countries. Bank account ownership in Guatemala (47%) is significantly higher than in Senegal (12%), although Senegalese SHFs reported having more accounts in non-financial institutions (such as microcredit) when compared to Guatemalans (44% and 25%, respectively). In terms of digital inclusion, the proportion of Guatemalan SHFs who have a mobile phone is slightly higher than their Senegalese counterparts (91% and 88%). Finally, DFS use in Senegal among the survey participants is more than two times what is observed in Guatemala (82% and 39%).
Table 9 – Sample Characteristics for Guatemala and Senegal
Research Phase Demand-Side Supply-Side Total
GUATEMALA Phase 2 35 25 60 Phase 3 168 149 317 Total 203 174 377 SENEGAL Phase 2 47 12 59 Phase 3 438 145 583 Total 485 157 642
28 Figure 14 – Key data from the study sample
Having confirmed the comparability between the macro-level data and the study sample data, in the following sections of the report, we highlight some of the lessons Guatemala can draw from the Senegalese experience. All the findings remain exploratory and need to be further confirmed by additional evidence. Yet, based on the comparative analysis produced so far, there are at least four key relationships that merit closer attention from researchers and policy makers in Guatemala.
3.3.1. DFS can strengthen the relationship between the government & SHFs
Figure 15 shows the preferences of Guatemalan and Senegalese smallholder farmers relative to six types of financial services that they would like to be digitized the most. The most popular choice among Guatemalan SHFs (34%) was purchasing agricultural inputs through digital means, but their overall preference was relatively well distributed among the other options: receiving payments for harvest sold (19%), paying for insurance premiums (16%), transfers to savings account (12%), receiving agricultural subsidies (11%), and paying or receiving loans (8%). However, in Senegal, there was a more skewed preference for receiving subsidies from the government (38%) and purchasing agricultural inputs (26%), which roughly represents the choice of two-thirds of all SHFs surveyed in the country.
29 Figure 15 - Financial Services SHFs in Senegal and Guatemala Would Like to be Digitized the Most
Given that in both countries, researchers interviewed farmers with a similar profile, this large difference, especially in terms of favoring the digitization of government benefits, may reflect more than a personal or cultural preference. Senegal has historically invested in agricultural policies that include a range of direct subsidies to SHFs,48 thereby creating with each of them an
opportunity for digitization and expansion of DFS as a whole. In Guatemala, on the other hand, the existence of such direct subsidies is relatively small, which reduces the ability of the local public sector to leverage these transactions in an effort to expand digital services.49,50 Should the
local government choose to implement or expand policies such as fertilizer vouchers, or conditional cash transfers to smallholder farmers in the Western Highlands, the Senegalese example indicates that DFS could also be included as a useful tool.
3.3.2. The sequencing of financial and digital inclusion efforts may affect DFS adoption
Another interesting hypothesis emerging from the comparison between Guatemala and Senegal data is related to the factors leading to different DFS adoption rates in each country (39% and 82%, respectively). As Figure 16 shows, it was particularly surprising to find such a high proportion of DFS users in Senegal when 62% of all SHFs interviewed in that country had never been to a bank before – compared to only 2% in Guatemala.
48 Seck, A. (2017). Fertiliser subsidy and agricultural productivity in Senegal. The World Economy, 40(9), 1989-2006. 49 Aguilar-Støen, M., Taylor, M., & Castellanos, E. (2016). Agriculture, Land Tenure and International Migration in
Rural Guatemala. Journal of agrarian change, 16(1), 123-144.
50 Holland, M. B., Shamer, S. Z., Imbach, P., Zamora, J. C., Moreno, C. M., Hidalgo, E. J. L., ... & Harvey, C. A.
(2017). Mapping adaptive capacity and smallholder agriculture: applying expert knowledge at the landscape scale. Climatic Change, 141(1), 139-153.
30 Figure 16 – Proportion of SHFs in Guatemala and Senegal that had been to a Bank
As previous research on technology adoption by farmers suggests,51 a prior relationship with
banks may have contributed to a bias in the perception of SHFs about the risks and benefits of DFS. In other words, the fact that most smallholder farmers in Guatemala had already seen how a traditional financial service provider works in person could have created assumptions about the added risk of digital financial services that most Senegalese did not have.
Indeed, as Figure 17 shows, Guatemalan SHFs already have a higher degree of distrust in financial institutions than their Senegalese counterparts. Yet, as it can be seen in Figure 18, when asked which type of financial organization they feel the most comfortable using, they consistently chose banks over microfinance institutions or digital financial services. From the data, it is possible to draw a scenario in which Guatemalan farmers are already aware of the risk of engaging with financial organizations of any kind, and are aware that doing so via digital mechanisms is even riskier. On the other hand, in Senegal, farmers already have a more positive view of financial institutions (perhaps because they have never been to a bank in person), which makes the risks associated with DFS lower in comparison.
51 Wyche, S., & Steinfield, C. (2016). Why don't farmers use cell phones to access market prices? Technology
affordances and barriers to market information services adoption in rural Kenya. Information Technology for Development, 22(2), 320-333.
31 Figure 17 – Trust in Financial Institutions in Senegal and Guatemala 52
Figure 18 – Where and How SHFs in Guatemala Feel Comfortable Using Financial Services
52Other reasons for not adopting DFS in Guatemala include i) Network coverage is unreliable where I live, ii) I am afraid of fraud, iii) There are no agents near me; iv) DFS is expensive; v) I don't have the required documents; vi) Someone else in my household already has an account; vii) I don't know how DFS works; viii) DFS are not useful to me; ix) I don't have enough money; x) Other. For Senegal, the other reasons include i) I don’t know how DFS works; ii) DFS are not useful to me; iii) I don’t have enough money; iv) DFS is expensive; v) There are no agents near me; vi) and I am afraid of fraud; among others.
32
3.3.3. High levels of digital and financial inclusion seem to be relevant to DFS adoption only after SHFs trust the financial system
In addition to the different levels of trust in financial institutions observed in Senegal and Guatemala, the survey data also provide clues about the conditions under which SHFs overcome their reticence and start using digital financial services. Figure 19 displays the proportion of DFS users in both countries who had a previous relationship with their DFS provider: 68% in Guatemala and 54% in Senegal. At the same time, Figure 20 shows the time SHFs took to start using DFS after becoming aware of it, revealing that 75% of survey respondents in Guatemala took a month or less to become users, while in Senegal 65% took over one year.
Figure 19 – Previous relationship between DFS Users and Providers in Guatemala & Senegal
33 Taken together, one plausible scenario derived from this evidence is that Guatemalan SHFs trust their financial institutions less, but if they have a preexisting relationship with a company that offers DFS, they are more likely to start using these services fast. In Senegal, SHFs trust their financial institutions to relatively greater degree and are more open to start using DFS even when they are not a current client of the company that offers the service. However, these same farmers are less eager to quickly become DFS users, taking longer to assess the risks and benefits of performing financial transactions through digital means. These scenarios suggest that each context requires a specific strategy to build trust in the DFS system, and in the Guatemalan case, incumbent providers seem to play a critical role in expanding the DFS user base and include SHFs in the formal financial system.
3.3.4. Supply-side participants in Guatemala showed low expectations about SHF behavior, which are often mistaken
A final hypothesis emerging from the data concerns the relationship between perceptions of supply-side professionals about smallholder farmers and the assumptions they make when designing DFS interventions. Figure 21 shows a comparison in the responses of supply-side and demand-side survey participants in Guatemala and Senegal to a General Self-Efficacy Scale.53
Yazdanpanah et al. (2015)54 define self-efficacy as “the extent to which performance of a given
behavior is easy or difficult for the individual, and/or a person’s self-confidence in his/her ability to perform a behavior” (p. 403). The scale is a standard measure of self-efficacy applied in different populations in social sciences (including farmers), and consists of 10 questions, each with four possible answers: completely agree, somewhat agree, somewhat disagree, and completely disagree. Based on the answers to the questionnaire, a final score ranging from 10 to 40 is calculated by adding each response – worth between 1 (completely disagree) and 4 points (completely agree).55 Higher scores signify higher self-efficacy, which is a proxy for assessing
how confident SHFs are on their capacity to deal with new circumstances in their lives, including the ability and/or willingness to adopt new technologies such as DFS.
53 Luszczynska, A., Gutiérrez-Doña, B., & Schwarzer, R. (2005). General self-efficacy in various domains of human
functioning: Evidence from five countries. International journal of Psychology, 40(2), 80-89.
54 Yazdanpanah, M., Feyzabad, F. R., Forouzani, M., Mohammadzadeh, S., & Burton, R. J. (2015). Predicting
farmers’ water conservation goals and behavior in Iran: A test of social cognitive theory. Land Use Policy, 47, 401-407.
55 Wu, H., & Mweemba, L. (2010). Environmental self-efficacy, attitude and behavior among small scale farmers in Zambia. Environment, Development and Sustainability, 12(5), 727-744.
34 Figure 21 – Actual vs Expected Self-Efficacy among SHFs in Guatemala & Senegal
The median scores displayed in Figure 21 show that supply- and demand-side survey participants in Senegal have the same level of confidence on SHFs self-efficacy (34), while supply-side respondents in Guatemala consistently underestimated SHFs self-efficacy levels (expected 30, when farmers reported 36). Low expectations exist about the possibility of smallholder farmers’ behavior, which can have important consequences for program design, such as curbing decision-makers’ willingness to implement DFS interventions on a larger scale due to fear of low demand. Two additional pieces of evidence are consistent with the hypothesis that low expectations about smallholder farmers may lead to biased assumptions about their behavior from professionals in the supply-side that design and implement DFs interventions. Figure 22 shows that supply-side survey respondents consistently underestimated how much SHFs feel more comfortable at banks vis-a-vis other financial institutions such as MFIs (supply-side expected preference was 16% against 59% from SHFs actual preference), Cooperatives (8% against 35%), DFS (31% against 50%), and ATM/Online Banking (58% against 80%). One potential consequence of such mismatch of perceptions is the establishment of DFS initiatives that underestimate the importance of banks in how SHFs participate in the formal financial system.