An Assessment of Environmental Impacts of a
NextGen Implementation Scenario and its
Implications on Policy-making
by
Alice Fan
B.S., Massachusetts Institute of Technology, 2007
Submitted to the Department of Aeronautics and Astronautics
in partial fulfillment of the requirements for the degree of
Master of Science in Aeronautics and Astronautics
at the
MASSACHUSETTS INSTITUTE OF TECHNOLOGY
February 2010
©
Massachusetts Institute of Technology 2010. All rights reserved.
Author ... ...
Department of Aeronautics and Astronautics
January
27, 2010
Certified by ...
Department Head and Professor of
/
/I. .
.
... ...
I .
aitz
Aeronautics and
onautics
Thesis Supervisor
A .Accepted by .
Associate Professor of
Eytan H. Modiano
Aeronautics and Astronautics
Chair, Committee on Graduate Students
MASSACHUSETTS INSUTE. OF TECHNOLOGY
MAR 2
2 2010
LIBRARIES
ARCHNES
. . ..
...
ar_
An Assessment of Environmental Impacts of a NextGen Implementation Scenario and its Implications on Policy-making
by
Alice Fan
Submitted to the Department of Aeronautics and Astronautics on January 27, 2010, in partial fulfillment of the
requirements for the degree of
Master of Science in Aeronautics and Astronautics
Abstract
With demand for aviation projected to grow by 5% per year over the next 20 to 25 years, policy makers must not only consider ways to ensure that the air transporta-tion system can accomodate significant growth, but also how their policy decisions will affect the environment. Because environmental issues are becoming increas-ingly apparent, the sustainability of policy measures will likely constrain responses to this potential increase in aviation demand. Policy makers will need to consider various trade-offs that come with policy decisions, and find ways to balance the demands of the air transport system with the need to reduce the environmental im-pact of aviation. This thesis assesses the environmental imim-pacts of implementing a policy scenario, which employs both operational and technological improvments to the air transport system. The impacts are presented in both physical and monetary metrics using the Aviation environmental Portfolio Management Tool, to allow for a comparison of trade-offs among different environmental effects. This thesis dis-cusses the limitations of this particular scenario, while also providing an overview of policy-making models, and the observed weaknesses in current policy-making processed involving technical data. In particular, it identifies the mismatch be-tween needs of those involved in the policy-making process, and the information provided by analysts, which can be an obstacle to developing credible and objective support for a policy proposal. It finally provides suggested methods for improving the relationship between different groups involved in developing policy to allow for better informed decision-making, and a more fluid policy-making process.
Thesis Supervisor: Ian A. Waitz
Acknowledgments
In these past two years at MIT, many people have made a significant contribution in helping get to this point. First and foremost, I would like to thank Professor Ian Waitz, my academic and research advisor, and also my mentor. I feel both privileged and honored to have learned from and worked with Ian, who in my eyes, is a limitless source of knowledge, intelligence, and energy. In my undergraduate education at MIT, I was in awe of Ian's ability to spark the interest of students in gas turbine engines in my Unified Engineering class, through his clarity of thought and sense of humor. As a graduate student, I am in awe of, not only his incredible intelligence, but also his patience, and his ability to manage a seemingly unmanageable amount of tasks, and to do them exceptionally well.
I would also like to thank my parents for their unwavering care and support. They have inspired me in so many ways through the sacrifices they made to provide me with a life that is full of opportunity, through their strong work ethic, and through their moral support and guidance, which have made me the person I am today. All of my accomplishments thus far are because of and for them.
I feel very fortunate for the friendships that I have made in my past two years at
MIT, which I hope will last a lifetime. I would like to thank Anuja Mahashabde and Rhea Liem for their friendship and support in both my personal and academic life. Both of them are women that I very much admire and aspire to be like. I would also like to thank Chris Dorbian, Phillip Wolfe, Chelsea He, Alex Mozdzanowska, Jim Hileman, Tom Reynolds, Christoph Wollersheim, Professor Karen Willcox, Stephen Lukachko, Akshay Ashok, and Mina Jun for their support and guidance with my research, for all that they have taught me, and for making my experience at PARTNER both enjoyable and memorable. I will really miss working with all of them! And last, but certainly not least, I would like to thank Ozan Candogan, whom I admire for his intelligence, character, and compassion. His support and kindness have given me the strength to pull through in difficult times, and has helped make this past year a great one.
Contents
1 Introduction 15 1.1 Background . . . 15 1.2 M otivation . . . 17 1.3 Thesis Organization... 18 1.4 Key Contributions. ... 19 2 Literature Review 21 2.1 Current Decision-making Practices for Aviation Environmental Poli-cies ... ... 212.2 Rules and Regulations for Assessing Environmental Policy . . . 23
2.2.1 Aviation Environmental Economic Analysis ... 24
2.3 The Next Generation Air Transport System ... 25
2.4 Environmental Impacts of Aviation ... 26
2.4.1 Noise Impacts ... 26
2.4.2 Air Quality Impacts ... 27
2.4.3 Climate Impacts ... 30
3 Methods for Assessing Trade-offs Among Aviation Environmental and Economic Impacts 33 3.1 APM T Impacts ... . 35
3.1.1 APMT Impacts: Noise Module ... 36
3.1.2 APMT Impacts: Air Quality ... 37
3.2 Communicating Uncertainty ... 41
4 NextGen Environmental Analysis 45 4.1 Scenario Background ... 45
4.2 Noise and Emissions Modeling ... 48
4.3 APMT Modeling Assumptions ... 49
4.4 Noise and Emissions Inputs ... 52
4.5 Results ... 56
4.5.1 Baseline Temporal Trends ... 56
4.5.2 Aggregated Environmental Impacts ... 58
4.5.3 Observed Reactions of Policymakers ... 61
4.5.4 Reanalysis of IPSA ... 62
5 Observations Applied to Policy Models 65 5.1 The Rational Model ... 65
5.2 Incrementalism ... 67
5.3 Agenda Building ... 69
5.3.1 Problem Recognition ... 69
5.3.2 The Development of Policy Proposals ... 71
5.3.3 The Political Stream ... 72
6 The Relationship between Policy and Science 75 6.1 The Language Barrier between Policy Makers and Analysts ... .75
6.1.1 The Role of Ambiguity, Symbols, and Technical Details . . . . 75
6.1.2 The Role of Numbers ... 77
6.2 Discussion ... 78
6.2.1 Problems that Arise from Policy Models ... 79
6.3 Suggestions ... 81
7 Conclusion and Future Work 83 7.1 Summary and Conclusions ... 83
A APMT-DICE Model Comparison 87
A .1 Objective ... 87
A.2 Approach ... . 87
A.3 Analysis ... 87
A.4 Conclusion ... 92
B APMT-FUND Model Comparison 95 B.1 Objective ... ... . 95 B.2 Approach ... . 95 B.3 Analysis ... 96 B.3.1 Temperature Profiles ... 96 B.4 Discussion ... 102 B.5 Climate Damages ... 103
B.6 FUND Model Damage Calculation Assumptions for EPA SCCs ... 104
List of Figures
3-1 The FAA-NASA-Transport Canada Aviation Environmental Tool Suite
3-2 Lens with Mid-Range Assumptions for Environmental Impacts ...
4-1 NextGen corners of trade-space from technology improvements for NASAs Subsonic Fixed Wing Program ...
Population exposed to 55 dB DNL ... Area exposed to 55 dB DNL (sq. km) ... Fuel burn below 3,000 feet (kg) ...
NOx and SOx emissions below 3,000 ft. (kg) ... Full mission fuel burn (kg) ...
Baseline population exposed to 55 dB DNL ...
Baseline incidence of physical impacts from air quality Baseline global mean temperature change (K) ... Monetized impacts using mid-range assumptions ... Monetized impacts using low lens assumptions .... Monetized Impacts using high lens assumptions ....
. . . 53 . . . 54 . . . . 54 . . . . 55 . . . 55 . . . 56 . . . . 57 . . . . 58 . . . 59 . . . 60 . . . 60
4-13 Full mission fuel burn for the modified NextGen scenario(kg) . ... 4-14 A comparison of the mid-range policy minus baseline NPV for the original NextGen scenario and the modified number of flights NextGen scenario ...
A-1 CO2 emissions from DICE-2007 background scenario ...
A-2 CO2 concentration (ppm) calculated using the APMT and DICE-2007
model ... 4-2 4-3 4-4 4-5 4-6 4-7 4-8 4-9 4-10 4-11 4-12
A-3 Radiative forcing from CO2(watts per square meter) calculated using
the APMT and DICE-2007 model ... 90
A-4 Atmospheric temperature change above preindustrial level using
APMT and DICE-2007 ... 91
A-5 Climate damages in percent GDP using APMT and DICE-2007 .... 91
A-6 Climate damages in billions of dollars per year using APMT and
D ICE-2007 ... 92
B-1 Temperature profiles of the SRES A1B scenario calculated using
APMT and FUND 3.3 ... 96
B-2 CO2 concentration curves for the FUND and APMT models ... .98
B-3 Climate damages in billions of dollars per year using APMT and
List of Tables
3.1 APMT-Impacts noise assumptions for NextGen scenario analysis . . 36
3.2 Lens with Mid-Range Assumptions for Environmental Impacts ... 42
4.1 APMT-Impacts noise assumptions for NextGen scenario analysis . . 50
4.2 APMT-Impacts air quality assumptions for NextGen scenario analysis 51 4.3 APMT-Impacts climate assumptions for NextGen scenario analysis . 52
B.1 concentration models ... 98
B.2 Temperature response functions ... 101
Chapter 1
Introduction
1.1 Background
In the last 35 years, the United States has seen a six-fold increase in the use of aviation for transportation purposes. Although fuel efficiency within this period has increased by 60%, and the number of people exposed to aircraft noise levels has decreased, the impact of aviation on the environment is expected to rise, with the projected 5% per year growth rate of aviation over the next 20-25 years [1] [2]. Preliminary analysis from the Committee on Aviation Environmental Protection
(CAEP), within International Civil Aviation Organization (ICAO), an agency within
the United Nations, estimates that global aviation fuel burn will rise from 190 mega tonnes (Mt) in 2006 to a likely range of 730 to 880 Mt in 2050 [3]. Likewise, without accounting for alternative fuels, carbon dioxide (C02) from aviation, which
currently constitutes about 2% of the world's C02, is expected to rise from 600 Mt
in 2006 to a likely range of (2,300 to 2,800 Mt) in 2050 [3][4]. Within the US, to prepare for the expected growth in demand, which could severely strain the current air transport system and the environment, federal agencies are working together through the Joint Planning and Development Office (JPDO) to develop a nationally integrated plan to sustainably transform the US air transport system through improvements to operational procedures and aircraft technology. These plans will manifest themselves through the Next Generation Air Transport System
(NextGen) program.
Aviation's effect on the environment has been a growing concern over the past
50 years both internationally, and in the US. Regulations governing aviation-related
impacts on the environment began in the 1960's through aircraft noise standards set by the ICAO and the US Federal Aviation Administration (FAA). Both organiza-tions developed noise standards concurrently, with ICAO's publication of Annex
16: Environmental Protection, Volume I -International Noise Standards, and the
US FAA's Federal Aviation Regulation (FAR) Part 36 [5] [6]. Standards for
regulat-ing aircraft emissions affectregulat-ing air quality around airports were then set by ICAO Standards and Recommended Practices (SARPs) for aircraft emissions in the 1980s. Annex 16: Environmental Protection, Volume II - Aircraft Engine Emissions de-scribes ICAO's emissions standards for nitrogen oxides (NO,), hydrocarbons (HC), carbon monoxide (CO) and smoke [7]. To address concerns regarding the impact of aviation on climate, the ICAO established the Group on International Aviation and Climate Change(GIACC) in 2007. GIACC is tasked with developing plans and providing policy guidance for addressing aviation-related climate impacts
[8]. In 2008, the European Commission ammended a directive for greenhouse gas
emissions allowance tradings to include emissions from aviation activities. This directive applies to flights arriving to and departing from European Union member states, and is to be fully implemented by 2012 [9].
Within the US, the Environmental Protection Agency (EPA) sets emissions stan-dards for aircraft engines through the Clean Air Act (CAA), which was first estab-lished in the 1970s. The US FAA has the authority to enforce these standards and certify engines under the CAA [10]. Emissions standards set by ICAO have served as the basis of the US FAAs aircraft engine performance certification standards, which are established through EPA regulations [11]. To help bridge gaps in sci-entific understanding and address uncertainties in climate research, the FAA has established Aviation Climate Change Research Initiative (ACCRI), which will also support NextGen in achieving its environmental goals. Other organizations par-ticipating in ACCRI include the National Aeronautics and Space Administration
(NASA), the National Oceanic and Atmospheric Administration (NOAA), and the US EPA [12]. To inform future policy decision making, the EPA has also mandated
that emissions data be collected from all heavy-duty engines, including those of aircraft, by 2011 [13].
1.2 Motivation
The challenge of sustainably transforming the air transport system, involves con-sidering various operational and technological improvements, weighing the bene-fits and costs of these scenarios, and making decisions based on results that have ranges of uncertainty. Trade-offs within the environmental scope of the analysis add to the complexity of this decision-making process, which is also dependent on a range of other political factors. To assist policy makers in the decision-making process related to the environmental impacts of aviation, the Aviation environmen-tal Portfolio Management Tool (APMT) is being developed as part of the aviation environmental tool suite of the Federal Aviation Administrations Office of En-vironment and Energy (FAA-AEE) [14]. APMT is used to assess enEn-vironmental scenarios related to aviation in terms of both monetary and physical metrics, and to help policy makers evaluate the trade-offs between different environmental im-pacts. However, even with tools such as APMT, questions still remain as to how policy makers systematically manage and process this complex and large amount of information to make policy decisions. What are the limitations of the current policy-making process? What can be done to improve the process?
This thesis has two primary objectives. The first is to provide an assessment of environmental impacts under a particular NextGen implementation scenario. The second is to use this assessment and observations from the development of other environmental policies, to identify challenges and opportunities associated with the use of environmental impact assessments for aviation policy-making.
1.3 Thesis Organization
This thesis is composed of seven chapters, with a more detailed description of the content and structure described below.
Chapter 2
Chapter 2 provides an overview of current decision-making methods in developing aviation environmental policies, as well as the rules and regulations behind these methods. As motivation for the assessment of the NextGen scenario, Chapter 2 describes the goals and investment levels of the NextGen program, and discusses the environmental impacts of aviation on noise, air quality, and climate.
Chapter 3
Chapter 3 discusses the methods used in evaluating the monetary and physical environmental impacts of aviation. In particular, it describes the methods and the specific assumptions used in APMT for analyzing the NextGen scenario.
Chapter 4
The methods and assumptions used to generate the NextGen scenario are discussed in Chapter 4. The results of the scenario analysis, using methods from Chapter 3, are then presented and discussed. The final section highlights the observed reactions of those involved in the policy-making process to these results, which will provide motivation for the following chapters that analyze the formulation of policy that is based on technical information.
Chapter 5
To better understand the different methods of generating policy, Chapter 5 sum-marizes the methods and assumptions behind three policy-making models: the rational model, incrementalism, and the agenda building model. The observations from the NextGen policy-making process, along with other recent environmental policy-making developments are then related to these models to underscore the
framework for viewing the development of environmental policy.
Chapter 6
Chapter 6 focuses on the dynamics between different groups in their collaboration to formulate environmental policy. In particular, it describes the language bar-rier observed between those involved in the policy-making process and technical analysts due to the different roles that these groups assign to different communi-cation tools. The issues with the NextGen policy scenario analysis that have been made clearer through the frameworks in Chapter 5, are also described, along with suggested methods of improving and smoothing the collaboration in developing environmental policy.
Chapter 7
Chapter 7 provides concluding remarks of this thesis, and highlights areas of further research.
1.4 Key Contributions
The contributions of this thesis are based on the application of APMT in assessing the sustainability of a particular NextGen scenario, as described below.
" An assessment of the environmental impacts of the implementation of a
particular NextGen scenario, with a summary of the observed reactions to the results of this analysis, and the shortcomings of the NextGen scenario. To address these shortcomings, this thesis also provides a reanalysis of the scenario with assumptions that are more applicable to the objectives of the NextGen scenario.
* An application of frameworks for understanding the NextGen policy-making process, and for highlighting the weaknesses of the processes. This thesis comments on the observed relationship between policy makers and analysts.
It also defines the source of difficulties in the collaboration process between these groups, which can potentially hinder the policy-making process, as well as weaken the credibility of a policy.
e The development of suggested solutions to address these observed difficulties in developing policy, to make the policy-making process more fluid and systematic.
Chapter 2
Literature Review
This chapter discusses current decision-making methods used in formulating avi-ation environmental policies, and provides motivavi-ation for the following chapters which elaborate on these methods. Section 2.1 summarizes current practices used to evaluate environmental policy scenarios; section 2.2 reviews the current rules and regulations relevant to analyzing environmental policy scenarios and their application to aviation environmental policy; section 2.3 provides an overview of the Next Generation Air Transportation System (NextGen), and elaborates on the purpose, investment levels, and the application of environmental analysis to NextGen. The final section summarizes the environmental impacts of aviation on
noise around airports, air quality, and climate.
2.1 Current Decision-making Practices for Aviation
En-vironmental Policies
Environmental problems arise due to the lack of explicit valuation of resources, which individuals and firms consume without necessarily considering or fully accounting for the potential suboptimal effects of their usage. In making environ-mental policy decisions, environenviron-mental or resource economics can be useful, as it allows for an assessment of how people value the environment. This is necessary in
addressing resource and environmental problems, and correcting for the incentives that lead to the misusage of resources.
Environmental economics is a useful decision-making tool that provides meth-ods of valuing various trade-offs between environmental and economic objectives. Trade-offs can arise, for instance, with new engine technology, which might re-duce aircraft emissions, but lead to an increase in noise levels around airports. To facilitate the decision-making process, it is thus necessary to quantify these envi-ronmental objectives to allow for a direct comparison of trade-offs. Cost Benefit Analysis (CBA), Cost Effectiveness Analysis (CEA), and Distributional Analysis are common practices in achieving this.
CBA involves a comparison between the related costs and benefits of a
pol-icy measure, which are usually monetized. Ratios of benefits to costs are another method of expressing the results of CBA. It should be noted, however, that using these ratios to rank different options can lead to ambiguous results [14]. Cost effec-tiveness analysis, on the other hand, is appropriate when the benefits of candidate scenarios or policy measures are similar. In this case, implementation costs of the scenarios are compared, and the policy measure with the lowest cost is chosen. However, CEA can be misleading if there is a non-linear relationship between the physical intermediate benefits which are typically assessed, such as changes in emissions levels, and the ultimate health and welfare benefits [14]. Morover, the most cost-effective option may be cost inefficient, as the costs may outweigh the benefits. Cost-effectiveness analysis does not necessarily reveal what level of con-trol is reasonable, nor can it be used to directly compare situations with different benefit streams [15]. In many cases, it is also necessary to determine which sector of society is bearing the costs or the benefits of a policy measure. Distributional analysis would thus be needed to evaluate who is being affected.
Conducting analysis for aviation environmental regulation typically involves emissions inventories, which contain the amount of pollutants emitted in a given time period and area. Economic environmental analysis, using methods such as
making policy decisions, and to consider more thoroughly the possible impacts of a particular policy on the environment. Cost benefit analysis, nonetheless, has often been criticized when applied to environmental policy, due to the monetization of environmental impacts, such as premature mortalities, health problems associated with air quality, damage to eco-systems from global warming, etc. Ethical ques-tions arise as to whether or not dollar values should be assigned to non-market factors, such as human life or eco-systems. The US EPA, FAA, US Department of Agriculture, and the US Food and Drug Administration all employ some form of the value of statistical life (VSL) in conducting CBA, as it provides a way to com-pare governmental programs and regulations that involve the allocation of scarce resources for life-saving activities [16]. The VSL specifically allows for benefits from life-saving activities to be compared with the cost of the program. It should also be noted that the VSL used in environmental policy analysis is not assigned to any particular individual and is not based on any particular occurance of mortality. It can thus be thought of as "a convenient way to summarize the value of small reductions in mortality risk" [16]. Moreover, if the value of a statistical life is not factored into environmental regulatory analysis, it is possible that an undesirably low number of lives would be saved from the policy being considered.
2.2
Rules and Regulations for Assessing
Environmen-tal Policy
Within the United States, it is required that benefits and costs be evaluated for all regulatory measures issued by federal agencies, as directed by executive orders and directives of the Office of Management and Budget (OMB)[17]. Although decisions no longer need to be made based on benefits outweighing costs, as orig-inally required by Executive Order (EO) 12291, both quantitative and qualitative costs and benefits should be accounted for according to EO 12866 [18]. This EO requires a statement of the purpose for the proposed action is required, as well
as an examination of alternative approaches, and their associated distributional effects according to EO 12866[15]. To more thoroughly assess regulatory measures, the OMB specifies that both CBA and CEA should be conducted in rulemaking pertaining to health and safety [19].
The EPA continues to be the main governmental agency conducting environ-mental analysis for federal regulations within the United States. Much of the analysis is conducted under specific pieces of legislations such as the Clean Air Act
(CAA). The same requirements mandated by executive orders and the OMB that
apply to all federal agencies that conduct economic analysis for regulatory mea-sures, also apply to the EPA. In 2000, the EPA established its own guidelines that are in accordance with executive orders and the OMB, which discuss in greater detail the procedure for conducting CBA, and other environmental economic practices
[15].
2.2.1 Aviation Environmental Economic Analysis
The Office of Enivironment and Energy (FAA-AEE), within the Federal Aviation Administration, has been responsible for the development of several tools to assess environmental impacts of aviation, such as the Emissions and Dispersion Modeling System (EDMS), Model for Assessing Global Exposure to Noise from Transport Air-craft (MAGENTA), Integrated Noise Model (INM), System for Assessing Aviations Global Emissions (SAGE), and Screening Model for Airport Air Quality (SMAAQ). The FAA-AEE is also responsible for developing, recommending, and coordinating aviation policy within the US relating to the environment and energy [14].
The FAA is part of the Joint Planning and Development Office, which seeks to revamp the air traffic control system to accomodate the projected increase in demand, through The Next Generation Air Transportation System (NextGen). Al-though most of the analysis for NextGen does not incorporate economic analysis, some of the work does relate to the impacts of operational and technological im-provement on the environment and the economy. The work presented in this thesis
is a component of the broader NextGen analysis effort.
2.3
The Next Generation Air Transport System
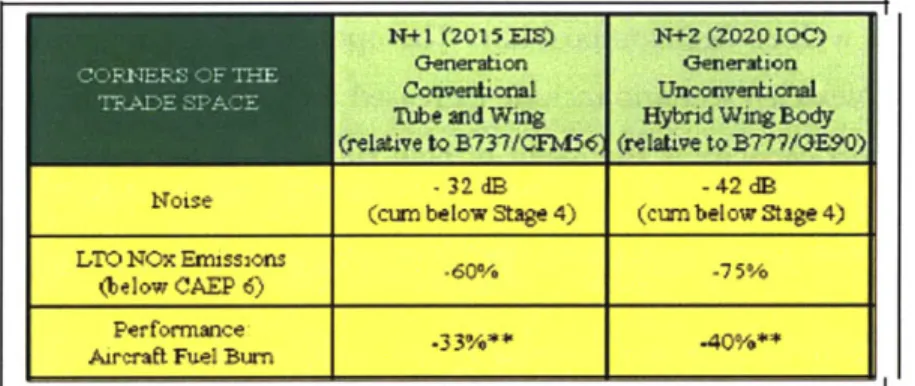
The Next Generation Air Transport System is a congressionally mandated program managed by JPDO to modernize the US air transportation system. Specifically, it is responsible for increasing capacity and reliability, improving safety and security, while also minimizing environmental impact [20]. This is in accordance with the Vision 100 Century of Aviation Reauthorization Act, which has allowed for the formation of JPDO, and hence the NextGen program [21]. NextGen improvements will manifest themselves through transformations from ground-based navigation and surveillance to space-based navigation and integrated surveillance, video ra-dio control to digital data exchange, and through other mechanisms, such as dig-ital communications, layered adaptive security, weather integrated into decision-making, advanced automation of Air Traffic Management, and net-centric infor-mation access for operations. NextGen is targeting a 40% to 60% increase in airport capacity by 2025 [20]. Because NextGen will involve large-scale changes to acco-modate the anticipated increase in demand for air transport, the environment will inevitably play a significant role in terms of determining the feasibility of NextGen implementation options. In creating possible scenarios for NextGen, environmen-tal targets are also taken into consideration. For instance, future individual aircraft, with new airframes, engines, and air traffic control, are anticipated to allow for a reduction in the number of people exposed to greater than 65 dB noise by 1% per year, a 30% to 40% decrease in fuel burn per flight, and a 60% to 75% reduction in landing and take-off NO, emissions per flight. Delays attributed to weather conditions are also planned to be reduced through NextGen improvements [22].
Since NextGen will require a large-scale transformation of the air transportation system, industry players who would be affected by these changes are also involved. The NextGen Institute serves as a mechanism for industry involvement, allowing industry to work with JPDO to define, develop, and implement NextGen [20].
Implementing NextGen by 2025 requires investments in areas of research, engi-neering, development, Air Traffic Organization capital appropriations, and avion-ics. It is estimated that for the first five years, the NextGen program will cost $4.6 billion. Long term estimates of cost are $8-10 billion in the next 10 years, and $15-22 billion in the end-state or through 2025. Avionics costs may also amount to $14-20 billion [20].
2.4 Environmental Impacts of Aviation
The structure and content in the following sections follow closely to that of Ma-hashabde [2] and the CAEP/8 NO, Stringency Cost-Benefit Analysis Demonsration using APMT-Impacts [23].
2.4.1 Noise Impacts
Since noise from aviation is the most easily perceived effect of aviation, complaints in local communities due to aircraft noise are more common than those of emissions or other environmental effects. Noise due to aviation primarily affects communities in close proximity to airports, with impacts that include annoyance, sleep depri-vation, hypertension, etc. [24] Although noise around airports result from various sources, this section focuses on noise due only to aircraft, since airborne flight op-erations, which include landing and take-off, dominate the noise exposure around airports [25]. This section will first discuss common noise scales and metrics, and then provide a more detailed description of the impacts of aircraft-related noise.
Noise levels are usually expressed in units of decibels, and can applied in both single-event or cumulative metrics. Single-event metrics correspond to noise effects from a single aircraft movement, and are thus appropriate for measur-ing impacts such as sleep-awakenmeasur-ings [24]. These metrics include Maximum A-weighted Sound Level, Sound Exposure Level (SEL), and effective perceived noise level (EPNL). The A-weighted scale weights frequencies based on the frequency
response of the human ear, and is the more commonly used scale in noise assess-ments and in producing noise exposure area maps or contours. The sound exposure level is defined as the total noise energy for a single event. EPNL, which is the tone-corrected perceived noise level, takes the instantaneous percieved noise level, which is a pure tone that can be perceived by humans, and corrects for spectral irregularity using a tone correction factor [6].
Cumulative noise metrics aggregate or apply a time average to all single events from aircraft operations, and thus are more representative of airport activity than single-event metrics. These metrics include the equivalent sound level and the day-night average sound level (DNL). The equivalent sound level describes a constant sound level over a period of time that produces an equivalent amount of energy as the time-varying sound level during the given period of time. The DNL is the A-weighted equivalent sound level over a period of 24 hours, with 10 dB added during nighttime to account for increased sensitivity of people to noise at night. Since cumulative noise metrics aggregate noise events over a period of time, they are useful when evaluating long-term exposure to aircraft noise [24].
The impacts of short-term and long-term aircraft noise exposure, based on ex-tensive studies, are found to include behavioral and physiological effects. Behav-ioral impacts consist of general annoyance, sleep disturbance, disruption of work performance and learning. Physiological impacts of aircraft noise include stress-related health effects, which range from hypertension, which has the strongest link to noise, to hormone changes, as well as mental health effects. Although evidence that aircraft noise causes annoyance, sleep disturbance, learning disruptions, and cardiovascular diseases is well documented, little evidence exists of environmental noise causing hormonal changes or psychiatric disorders [24].
2.4.2 Air Quality Impacts
Aircraft emissions affecting air quality are typically measured from operations be-low 3,000 feet, and include carbon dioxide (C02), which accounts for 70% of aircraft
emissions; water vapor (H20); nitrogen oxides (NOx); carbon monoxide (CO);
sul-fur oxides (SO.); unburned hydrocarbons or volatile organic compounds (VOCs); particulates; and other trace compounds. H20 makes up about 30% of aircraft
emissions, and other species only about 1% of total emissions [11]. Under the Clean Air Act, the US EPA sets National Ambient Air Quality Standards (NAAQS) for six principal pollutants. These include CO, lead (Pb), nitrogen dioxide (NO2), 03, particulate matter (PM), and sulfur dioxide (SO2). These pollutants are of in-terest because they are associated with adverse health impacts.
Nitrous Oxides (NOx)
NO, refers to NO or NO2. NO2 is linked to respiratory morbidity by the recent US
EPA integrated science assessment of NO2. However, it is not clearly understood
if the link between NOx and respiratory morbidity is due solely to NO2, or if NO2 merely acts as a surrogate for impacts related to a different pollutant. NO, with other compounds can serve as a precursor to ozone. The formation of ambient PM through NO. as a precursor for other organic and inorganic oxized nitrogen compounds, poses more significant health risks, which are described in more detail below.[26]
Carbon Monoxide (CO)
CO emissions are produced from incomplete combustion of fossil fuels. Health
impacts caused by short-term and long-term exposure to CO include cardiovascu-lar morbidity, central nervous system effects, birth outcomes and developmental effects, respiratory morbidity, and mortality. CO has the strongest causal relation-ship with cardiovascular morbidity. Other health effects are based on a suggestive causal relationship with CO; although there is inadequate evidence of CO-induced respiratory morbidity or mortality for long-term exposure [27].
Sulfur Oxides (SO,)
and include sulfur dioxide (SO2), sulfur trioxide (SO3), and gas-phase sulfuric acid
(H2SO4). The EPA has determined that short term exposure of 5 minutes to 24 hours
of SO2 is linked to a series of adverse respiratory effects including bronchoconstric-tion and increased asthma symptoms. An EPA Integrated Assessment concluded that sufficient evidence exists supporting the "causal relationship between respi-ratory morbidity and short-term exposure to SO2" [28]. Among the sulfur oxides,
S02 is the source of the greatest concern in terms of causing serious health impacts. Other gaseous SO. components exist in smaller concentrations in the atmosphere. Since the formation of SO2 also leads to the formation of other SOx species, SO2 is
used as an indicator by the EPA for the larger group of gaseous sulfur oxides. The reaction of SO, and other compounds in the atmosphere, leads to the formation of particulate matter, which also causes serious health impacts. These particles can penetrate deeply into the lungs, causing or worsening respiratory diseases, such as emphysema and bronchitis, and possibly aggrevating existing heart disease. These effects can lead to increased hospital admissions and premature mortalities [28].
Particulate Matter (PM)
Fine particles or particulate matter emissions (PM2.5) from aircraft have a diameter
of less than 2.5 ptm, and are produced as direct emissions in the form of non-volatile PM, and through secondary PM formation. Secondary PM makes up the larger portion of aircraft-sourced PM, and is the result of precursor emissions, which include NO,, SO,, and hydrocarbons in the form of ammonium sulfates and ammonium nitrates [2]. The US EPA, under the Clean Air Act currently maintains the National Ambient Air Quality Standard for PM2.5 at 15 Ig/m 3 [29]. The EPA uses the high fidelity Community Multiscale Air Quality (CMAQ) simulation
system to model changes in ambient PM2.5 as part of its regulatory analysis of impacts. PM impacts are largely regional, with aircraft emissions contributing to a less than 0.1% increase in annual PM concentrations. This result was based on the Energy Policy Act study on emissions below 3,000 ft, at 325 US commercial airports or 95% of US operations that have filed flight plans, from June 2005 to May 2006
[30].
Exposure to PM2.5 can lead to serious health problems, as these particles can
en-ter a person's lungs. These problems may include increased respiratory symptoms, decreased lung function, aggravated asthma, chronic bronchitis, heart attacks, and premature mortality in those with heart or lung disease [29]. The EPA models health impacts using the Environmental Benefits Mapping Program (BenMAP)
[31]. The Energy Policy Act study, using BenMAP, estimates that PM from aviation
leads to 64 to 270 annual premature deaths [32]. Several studies suggest that the health impacts of PM are more significant than those of other aircraft pollutants. Although most analyses of air quality impacts of aviation pollutants are measured from take-off and landing of aircraft, studies are also showing that cruise emissions may contribute significantly to health impacts [33]. Future assessment of aviation related air quality health impacts may need to incorporate emissions from all stages of flight to have a complete analysis of impacts [2].
2.4.3 Climate Impacts
Assessments of climate impacts from aviation generally are based on emissions from all stages of flight. The discussion in this section pertains to commercial sub-sonic aviation, which is comprised of aircraft that fly typically at an altitude of 9 to
13 km, or in the upper troposphere and lower stratosphere. According to the
Inter-governmental Panel on Climate Change (IPCC), emissions from aircraft and other anthropogenic sources affect climate through changes in radiative forcing (RF), as these pollutants modify the atmospheric composition of gases and aerosols [34]. Radiative forcing refers to changes in the radiative balance of the earth's climate system due to anthropogenic activities. It is specifically defined by the IPCC as a measure of the influence that a factor has in altering the balance of incoming and outgoing energy in the Earth-atmosphere system [34]. Three types of processes that affect the atmospheric balance include the emission of "radiatively active sub-stances," such as C02; the emission of species that react with these "radiatively
active substances," such as NO, which affects ozone concentration; and the emis-sion of substances that allow for the formation of aerosol particles or clouds [35]. Aviation-related climate impacts vary spatially and in time. The following is a dis-cussion of aircraft emissions that affect climate. It should be noted that the current level of understanding of the effects of these emissions varies.
Carbon Dioxide (C0 2)
CO2 has a net warming effect through a positive radiative forcing, with impacts
that are spatially homogeneous and that last on the order of centuries [35].
Water Vapor (H20)
H20 also has a net warming effect, with impacts that last on the order of days. H20
emissions from subsonic aircraft in the troposphere and lower stratosphere do not have a large effect relative to other aviation emissions, unlike those that would be emitted by supersonic aircraft at higher cruise altitudes [35].
Nitrogen Oxides (NOx)
NO and N20, collectively known as NO., have two effects on the atmopshere. In
the upper troposphere and lower stratosphere, an increase in NOx can lead to a rise in ozone (03), which has a warming effect. NO, also produces OH radicals that lead to greater oxidative capacity of the atmosphere. This causes the destruction of CH4, which decreases ozone, both leading to a cooling effect. The effect of NO,
on the atmosphere is strongly dependent on background concentrations of NO, and HO,, which includes OH and HO2, and seasonal variation of insolation [35].
These effects vary spatially and temporally, as the short-lived warming effect from the production of 03 from NO, lasts on the order of a few months, while that of the reduction of 03 from lower CH4 concentrations lasts for decades [2]. Although
when globally averaged, these counterbalancing effects amount to a net impact of almost zero readiative forcing. Regionally, however, there is a strong variation in the effects of NO. on RF [2].
Sulfate Aerosols and Particulate Matter
Atmospheric reactions with aerosols have a cooling effect, as they involve the reduction of NOx and HO, which can cause a decrease in ozone. A cooling effect is also generated through reflective properties of sulfate aerosols with sunlight. On the other hand, particulate matter which is comprised of soot or black carbon has a warming effect through its absorbtion of sunlight.
Indirect effects of aerosols from aircraft emissions on naturally occuring clouds are still the subject of scientific study due complexities associated with processes such as ice-cloud nucleation and the alteration of microphysical properties of cirrus clouds. Given present knowledge, these uncertainties are considered to be signifi-cant [35].
Carbon Monoxide (CO) and Volatile Organic Compounds (VOCs)
Aviation CO emissions and VOCs from unburned hydrocarbons are found to have a negligible effect on climate. The low impact of CO is also due to the small amount of CO emitted in the atmosphere by aircraft compared to other sources of CO [35].
Contrails and Induced Cirrus
Contrails are visible line clouds that form behind aircraft during flight due to water vapour emissions. Persistent contrails can develop into artificially induced cirrus clouds that are comprised of ice crystals, with properties that are dependent on the physics of ice particle nucleation. The mechanism through which ice formation occurs is highly dependent on relative humidity and temperature. Both contrails and aviation-induced cirrus produce a net warming effect in the atmosphere, with the effect from contrails persisting for hours, and that of cirrus lasting from hours to days [35].
Chapter 3
Methods for Assessing Trade-offs
Among Aviation Environmental and
Economic Impacts
Much of the text in this chapter paraphrases the work of Mahashabde [2] and the CAEP/8 NOx Stringency Cost-Benefit Analysis Demonstration using APMT-Impacts [23]. To better understand the impacts of aviation on the environment, and to facilitate decision-making, research tools are being developed largely by two major research groups: the Partnership for Air Transportation Noise and Emissions Reduction (PARTNER) Center of Excellence in the US and the Opportunities for Meeting the Environmental Challenges of Growth in Aviation (OMEGA) in the UK. The PARTNER Center for Excellence is comprised of members of academia, and is supported by the US Federal Aviation Administration, the National Aeronau-tics and Space Administration, and Transport Canada. OMEGA, which is funded
by the UK government, is made up of nine UK universities, with the purpose of
studying scientific, operational, and policy-related measures of the environmental effects of aviation [36]. Currently two major research initiatives, led by Cambridge University (UK) and a joint venture of the FAAs Office of Environment and Energy
(FAA-AEE), NASA, and Transport Canada through the PARTNER Center, are
of aviation. Cambridge University's Aviation Integrated Modeling (AIM) project is developing the capability to perform policy assessment that would account for the economic and environmental impacts of aviation [37]. AIM specifically incor-porates "aircraft and engine technology changes, demand for air transport, airport activity and operations, global climate change, local air quality and noise impacts as well as regional economic impacts of aviation activity" [2]. The second re-search initiative involves the development of the Aviation environmental Portfolio Management Tool (APMT) suite throught the PARTNER Center. APMT allows for a comprehensive evaluation of aviation's environmental impacts, through the ability to assess trade-offs between noise, air quality, and climate impacts using economic analysis and environmental impact assessment. It is developed with the purpose of better informing decision makers "by providing the capability to assess different policy measures in terms of their implementation costs, environmental benefits, and associated uncertainties"[2]. APMT is based on an extensive survey of documents that provide guidance for environmental policy analysis. These key documents include EPA Guidelines for Preparing Economic Analyses [15], OMB Circular A-4, Best Practices for Regulatory Analysis [19], UK HM Treasury Green Book on Appraisal and Evaluation in Central Government [38], UK Cabinet Office, Better Regulation Executive Regulatory Impact Assessment Guidance [39], OECD The economic appraisal of environmental projects and policies -A practical guide
[40], Transport Canada Guide to Benefit Cost Analysis in Transport Canada [41], WHO Air Quality Guidelines for Europe [42], Resources for the Future, Cost Bene-fit Analysis and Regulatory Reform: An Assessment of the Science of the Art [43], Peer Review of the Methodology of Cost-Benefit Analysis of the Clean Air for Eu-rope Programme [44], and Clean Air for EuEu-rope (CAFE) Programme Methodology for the Cost-Benefit Analysis for CAFE Vol. 1 [45]. The Requirements Document for APMT summarizes the findings from the survey, and was reviewed by the Transportation Research Board of the US National Academies [14]. APMT was used to generate the environmental impact analyses in this thesis. This chapter will discuss in more detail the modelling methods used in APMT.
APMT is comprised of the Economics and Impacts modules as shown below in Figure 3-1. The Economics module models the economics of the aviation industry, and outputs an economic cost. The Impacts module models the environmental impacts of aviation, and has the capabilities of providing comprehensive cost-effectiveness and cost benefit analyses. In this thesis, only the APMT-Impacts module will be discussed since it is the part of APMT applied to the analysis de-scribed in the following chapters. For more information about APMT-Economics, please refer to [46].
Aviation Environmental Tools Suite
Policyand Scenarios
AMnWFAf WPO CatM Beneft ToW
Env1ronmTen F DAsiA-rnprWandan Avirtionmsonenta t Space (EDs) te Eenvironmentat o to
.1.Design Tool (A ED)
and o io-Economicatrc
ung
os otus" n msin ivnoisa inptssUc s now ps uTool(APa T) arkpacts
henam k~pFuel BandCot
3.1OW T mpct AP
andsoioeconomicmts usnaos motor n msinsivnoisa
probabilistically through Monte Carlo methods. APMT is comprised of Noise, Air
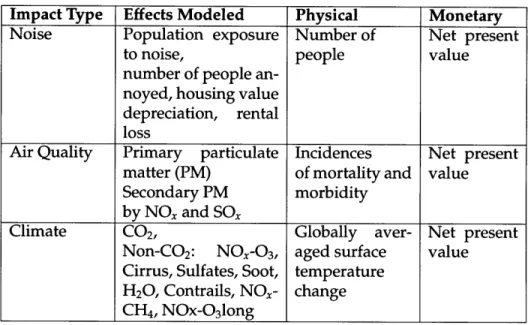
sections. Table 3.1 shows the effects modeled, and the monetary and physical metrics calculated within each module.
Table 3.1: APMT-Impacts noise assumptions for NextGen scenario analysis
Impact Type Effects Modeled Physical Monetary
Noise Population exposure Number of Net present
to noise, people value
number of people an-noyed, housing value depreciation, rental
loss
Air Quality Primary particulate Incidences Net present
matter (PM) of mortality and value
Secondary PM morbidity
by NO, and SO,
Climate CO2, Globally aver- Net present
Non-C02: NOx-0 3, aged surface value
Cirrus, Sulfates, Soot, temperature H20, Contrails, NO,- change
CH4, NOx-0 3long
3.1.1 APMT Impacts: Noise Module
The APMT-Noise Module estimates the physiological impacts of aviation noise for 178 airports in 38 countries plus Taiwan, which comprises about 90% of the estimated noise due to aviation [23]. It takes noise contours in units of day-night average sounds level (dB DNL) around airports as inputs, and overlays them onto population data around each airport. Outputs include the population exposed to a specified noise level, which is calculated by simply counting the number of people within the noise contours, as well as welfare and health impacts, which are represented by housing value and rental depreciation due to aviation noise. Current work by He et al., builds upon this hedonic method to estimate health and welfare impacts through a person's annual willingness to pay (WTP) for a reduction in noise [23].
Noise levels are related to housing value and rental loss through the use of a noise depreciation index (NDI) and hedonic pricing analysis from literature. The
NDI is defined as the percentage loss in housing value from an increase in a decibel unit of noise exposure. Through a meta-analysis of 60 hedonic studies of housing value depreciation, and with city-level income and housing data, He et al. derived a relationship between personal income and WTP through a statistical analysis
[23].
The WTP method to characterize health and welfare impacts of noise is an improvement from the hedonic method, since income data is more readily available than housing data in many parts of the world.
3.1.2 APMT Impacts: Air Quality
The APMT-Air Quality Module estimates health impacts for US aviation activities below 3,000 ft., which includes the take-off and landing portion of flight. It begins with aircraft emissions (NO,, SO,, non-volatile PM, and fuelburn) as inputs, and estimates air quality impacts in terms of physical metrics, such as the incidence of premature mortality, and monetary metrics. Monetized impacts are derived based on the cost associated with premature adult mortality, infant mortality, chronic bronchitis, respiratory and cardiovascular hospital admissions, emergency visits for asthma, and minor restricted activity days [2].
Aircraft emissions (primarily soot, aerosols formed from NO,, SO,, and gaseous hydrocarbon emissions) below 3,000 ft. are converted to concentrations of PM2.5
within the air quality module using a response surface model (RSM) which is based on 25 Community Multiscale Air Quality (CMAQ) simulations. CMAQ is a high fidelity air quality modelling tool being developed by US EPA Atmospheric Model Development Branch (AMDB) for research and regulatory analysis [47]. The RSM applies a statistical linear regression to the 25 CMAQ simulations to account for the complex chemistry of each grid cell at a lower computational cost than that of
CMAQ, and with a root-mean-square prediction error of about 3.5% for total PM2.5
[48]. Both the RSM and CMAQ have a spatial grid resolution of 36x36km over the continental US. Although this resolution is commonly used regulatory impact
assessments, it may underestimate local health impacts around airports from air quality by a factor of two. The RSM is designed to evaluate air quality impacts from emissions at a national level, by aggregating effects across grid cells. Since the RSM has a root-mean-squared average error of approximately 3.5%, the model serves as a valid surrogate for CMAQ simulations for national level assessments [48].
PM2.5 concentrations can be divided into four different groups of species: 1.
ele-mental carbon (non-volatile primary PM), 2. organic PM (from volatile organic PM or VOCs), 3. ammonium-nitrate (NH4NO3) and 4. ammonium-sulfate ((NH4)2SO4)
and sulfuric acid (H2 SO4). Impacts from PM are attributed to aircraft emissions
in the following manner: 70% due to NOx emissions, 14% from non-volatile PM, 12% from SOx emissions, and another 4% from PM formation from hydrocarbons [48]. In compliance with US EPA guidance, which prescribes reconciling air quality monitoring data with outputs from simulation models, the RSM uses the Speci-ated Modeled Attainment Test (SMAT), which is also used by the US EPA for the Clean Air Interstate Rule (CAIR) proposal modeling [49]. Results using the SMAT approach are adjusted in terms of the apportionment of PM impacts across differ-ent PM species, resulting in secondary PM formation from SOx providing a larger contribution to total aviation PM.
The health impact analysis of the RSM is based on the review of the best prac-tices for air quality policy in both Europe (ExternE program) and the United States
(EPA analyses using BenMAP)[50][31]. To estimate the incidences of mortality
and morbidity, the RSM uses grid-level population data and linear concentration response functions (CRFs) from epidemiological studies relating to population ex-posure to PM. Since CRFs are not differentiated based on PM species, equal toxcity is applied to the different PM species. Health impacts are then monetized using the Value of a Statistical Life (VSL), willingness-to-pay (WTP), and cost-of-illness (COI) from literature. The RSM currently uses the US EPA recommended VSL of
6.3 million US $2000, with a standard deviation of 2.8 million US $2000 [48][51].
be found in Rojo [52].
Several limitations exist that are currently being addressed as part of on-going research. The RSM, for instance, does not account for aviation emissions from sources other the aircraft. Regarding spatial limitations, only health impacts from landing and take-off emissions are evaluated. Incorporating impacts from cruise emissions is part of plans for future development of the air quality module. Further, a fixed background scenario is assumed.
3.1.3
APMT Impacts: Climate
The APMT-Climate Module estimates global impacts, such as temperature change, and health and welfare impacts, from aviation emissions during all stages of flight. Aircraft emissions include long-lived CO2 effects, as well as short-lived impacts of
NO, on ozone (NOx-0 3 short), the production of cirrus, sulfates, soot, H20, and
contrails. As described in section 2.4.3, long-lived CO2 can last on the order of
centuries, while short-lived effects persist only during year in which the pollutant is emitted.
The module treats aircraft emissions scenarios as pulses emitted each year, and applies an impulse response function from complex carbon cycle models to cal-culate concentrations of these emissions. Pulses of CO2 and NO, result in direct
and indirect longer-lived radiative forcing, which decay according to their e-folding times. Short-lived effects, such as contrails, induced cirrus cloudiness, water vapor, soot, and sulfates, are assumed to last only during the year of emissions. Radiative forcing from CO2 concentrations is estimated using a logarithmic relationship as
specified by the IPCC. RF for non-CO2 concentrations is based on a scaling to RF
estimates from Sausen et al. [53], Wild et al. [54], Stevenson et al. [55], and Hoor et al. [56]. Radiative forcing is then related to global mean temperature change using the temperature response function from Shine et al. [57]. Although this approach results in lower fidelity modelling of temperature change than that from detailed general circulation models, it has the advantage accounting for uncertainties
asso-ciated with climate sensitivity. To calculate temperature change of non-CO2 effects,
efficacy values, which are defined as the temperature response per unit of radia-tive forcing relaradia-tive to the response from forcing of CO2, is set to values recently
provided from Hansen et al. [58] and the IPCC [34].
Health, ecological, and welfare impacts of climate change are represented mon-etarily through the use of a damage function, which relates temperature change to percent changes in world GDP, ultimately allowing for the estimation of the net present value of damages. The damage function currently employed by APMT is from the Dynamic Integrated model of Climate and the Economy (DICE-2007)
[59]. DICE-2007 is an integrated assessment model that relates economic growth
with environmental constraints to allow for policy scenario analysis of optimal growth trajectories. The APMT-Climate Module uses only the damage function approach within the DICE-2007 model. Although DICE-2007 has been criticized for its simplified assumptions by not accounting for non-market damages, including loss of natural beauty or the extinction of species, estimating non-market dam-ages is an area of contention among the broader environmental impact assessment community [2]. DICE-2007 accounts for uncertainty in the damage distribution by
sampling a Gaussian distribution [59].
Limitations of the climate module are currently being addressed as part of ongoing research. The module is being developed to account for regional variability in short-lived effects due to aviation, in addition to modeling at a global resolution. APMT also does not explicitly account for feedbacks in the climate system which can have a positive or negative effect on climate change due to aviation emissions, and considers effects independently. The interactions of physical and chemical mechanisms are thus not included. In addition, the module assumes that there are no significant changes to flight routes within the operational improvements of aviation scenarios. Future areas of research include the incorporation of altitude dependence of NO, and contrails/cirrus effects, as well as a comparison of the results from the APMT-Climate Module to those of other complex atmosphere-ocean coupled general circulation models (AOGCM), to improve the accounting of
uncertainties, and to test the robustness of APMT assumptions [2]. For comparisons of APMT to the DICE and the Climate Framework for Uncertainty, Negotiation and Distribution (FUND) models, see Appendices A and B of this thesis.
3.2 Communicating Uncertainty
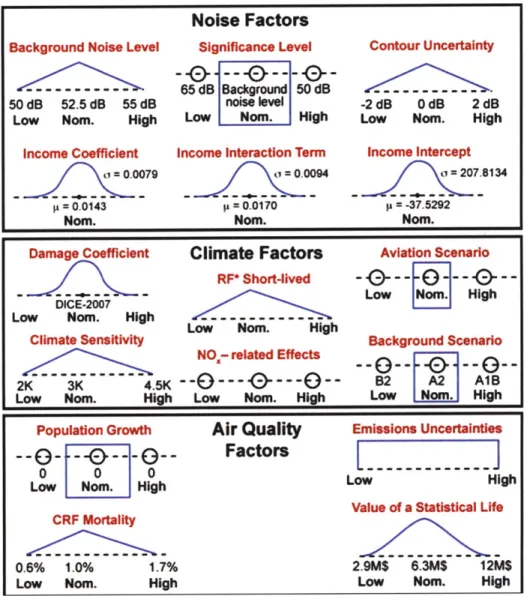
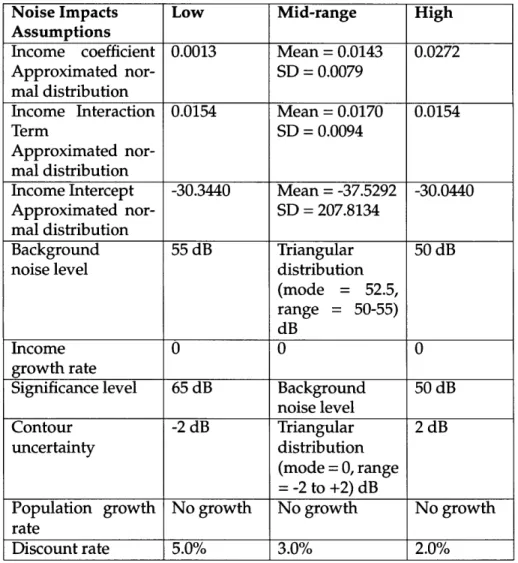
Several parameters within the Noise, Air Quality, and Climate impact modules are considered to be most influential to the magnitude of resulting impact estimates based on a global sensitivity analysis that was conducted for each module. These parameters, however, carry uncertainty, which can be represented through differ-ent probability distributions. To account for the possible range of parameters used to model noise, air quality, and climate impacts, a pre-determined set of param-eters and inputs are defined within the framework of lenses. A lens is a set of assumptions that allows one to view environmental impacts through a particular point-of-view or perspective. Lenses in APMT typically include low, mid-range, and high lenses. A low lens can be thought of as containing a "best-case" set of assumptions, in which parameters are set to the lowest value in an uncertainty distribution. In the mid-range case, the parameter distributions are sampled using Monte Carlo methods. A high lens involves a conservative set of assumptions, in which parameters are set to the highest value in an uncertainty distribution. However, a multitude of lenses can be created based on different combinations of these parameters.
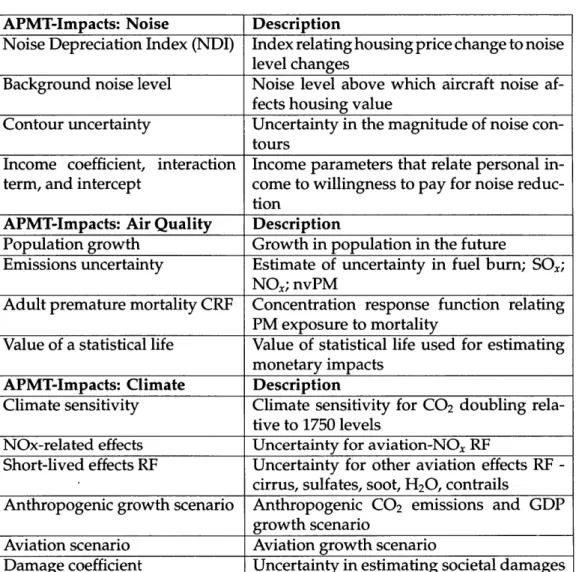
Table 3.2 describes the parameters shown in Figure 3-2, which provides a il-lustrative example of a lens with mid-range assumptions. The probability dis-tributions of parameters, which are sampled using Monte Carlo methods, are represented in the figure through the blue lines in the shape of the distributions. Parameters without distributions, are shown as discrete choices, with blue boxes selecting a particular choice.
Table 3.2: Lens with Mid-Range Assumptions for Environmental Impacts
APMT-Impacts: Noise Description
Noise Depreciation Index (NDI) Index relating housing price change to noise level changes
Background noise level Noise level above which aircraft noise af-fects housing value
Contour uncertainty Uncertainty in the magnitude of noise con-tours
Income coefficient, interaction Income parameters that relate personal in-term, and intercept come to willingness to pay for noise
reduc-tion
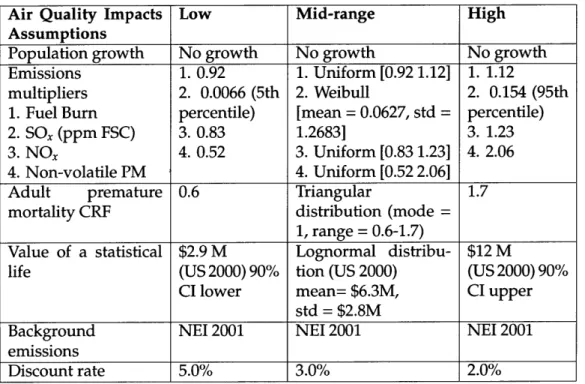
APMT-Impacts: Air Quality Description
Population growth Growth in population in the future
Emissions uncertainty Estimate of uncertainty in fuel burn; SOx;
NOx; nvPM
Adult premature mortality CRF Concentration response function relating PM exposure to mortality
Value of a statistical life Value of statistical life used for estimating monetary impacts
APMT-Impacts: Climate Description
Climate sensitivity Climate sensitivity for CO2 doubling
rela-tive to 1750 levels
NOx-related effects Uncertainty for aviation-NO. RF
Short-lived effects RF Uncertainty for other aviation effects RF -cirrus, sulfates, soot, H20, contrails
Anthropogenic growth scenario Anthropogenic CO2 emissions and GDP
growth scenario
Aviation scenario Aviation growth scenario
Noise Factors
Background Noise Level Significance Level Contour Uncertainty
- - - --- - 65 dB Background 50 dB
---50 dB 52.5 dB 55 dB noise level -2 dB 0 dB 2 dB
Low Nom. High Low Nom. High Low Nom. High
Income Coefficient Income Interaction Term Income Intercept
=0.0079 =0.0094 a=207.8134
= 0.0143 = 0.0170 = -37.5292
Nom. Nom. Nom.
Damage Coefficient
Climate Factors
Aviation Scenario RF* Short-lived -(&)---
~~- -0&-
- I- e --- - Low High
DICE-2007
Low Nom. High
Climate Sensitty Background Scenario
NO-7 related Effects -- --
F 1--
--2K 3K 4.5K B2 AB
Low Nom. High Low Nomn. High LOW N High
Population Growth Air Quality Emissions Uncertainties
--
Clm--at-
Factors
7
Low i Nom. High
Value of a Statistical Life CRF Mortality
---
---0.6% 1.0% 1.7% 2.9M$ 6.3M$ 12M$
Low Nom. High Low Nom. High
Figure 3-2: Lens with Mid-Range Assumptions for Environmental Impacts
Chapter 4
NextGen Environmental Analysis
In the next 25 years, US air traffic is expected to increase by 5% per year [60]. To ensure that the air traffic control system will be able to sustainably accommodate this projected growth, the Next Generation Air Transportation System is tasked with transforming the air traffic control system by leveraging new technology and operational procedures. The Joint Planning and Divisions Office is charged with developing and implementing policy related to NextGen, and is comprised of members from Federal Aviation Administration, NASA, the Department of Trans-portation (DOT), Defense (DOD), Homeland Security, Commerce, and the Office of Science and Technology Policy (OSTP). This chapter will provide a first assessment of the environmental impacts of a preliminary NextGen implementation scenario, the sensitivity of these results to different assumptions, as well as analyze the challenges observed in producing and presenting the results.
4.1
Scenario Background
The process of formulating the NextGen environmental policy scenario, begins with the Senior Policy Committee (SPC), which is composed of senior represen-tatives from five federal agencies, and which develops goals and provides policy guidance for the integrated plan for NextGen. The JPDO Board, composed of one senior executive from each agency, then reviews JPDO's operating plan and