Publisher’s version / Version de l'éditeur:
BMC Genomics, 15, 1, pp. 1-19, 2014-08-23
READ THESE TERMS AND CONDITIONS CAREFULLY BEFORE USING THIS WEBSITE.
https://nrc-publications.canada.ca/eng/copyright
Vous avez des questions? Nous pouvons vous aider. Pour communiquer directement avec un auteur, consultez la première page de la revue dans laquelle son article a été publié afin de trouver ses coordonnées. Si vous n’arrivez pas à les repérer, communiquez avec nous à PublicationsArchive-ArchivesPublications@nrc-cnrc.gc.ca.
Questions? Contact the NRC Publications Archive team at
PublicationsArchive-ArchivesPublications@nrc-cnrc.gc.ca. If you wish to email the authors directly, please see the first page of the publication for their contact information.
This publication could be one of several versions: author’s original, accepted manuscript or the publisher’s version. / La version de cette publication peut être l’une des suivantes : la version prépublication de l’auteur, la version acceptée du manuscrit ou la version de l’éditeur.
For the publisher’s version, please access the DOI link below./ Pour consulter la version de l’éditeur, utilisez le lien DOI ci-dessous.
https://doi.org/10.1186/1471-2164-15-708
Access and use of this website and the material on it are subject to the Terms and Conditions set forth at
Genome wide SNP identification in chickpea for use in development of
a high density genetic map and improvement of chickpea reference
genome assembly
Deokar, Amit A.; Ramsay, Larissa; Sharpe, Andrew G.; Diapari, Marwan;
Sindhu, Anoop; Bett, Kirsten; Warkentin, Thomas D.; Tar'an, Bunyamin
https://publications-cnrc.canada.ca/fra/droits
L’accès à ce site Web et l’utilisation de son contenu sont assujettis aux conditions présentées dans le site
LISEZ CES CONDITIONS ATTENTIVEMENT AVANT D’UTILISER CE SITE WEB.
NRC Publications Record / Notice d'Archives des publications de CNRC:
https://nrc-publications.canada.ca/eng/view/object/?id=f44e0662-c703-4463-a959-10c1dec08bc6 https://publications-cnrc.canada.ca/fra/voir/objet/?id=f44e0662-c703-4463-a959-10c1dec08bc6
R E S E A R C H A R T I C L E
Open Access
Genome wide SNP identification in chickpea for
use in development of a high density genetic
map and improvement of chickpea reference
genome assembly
Amit A Deokar
1, Larissa Ramsay
1, Andrew G Sharpe
2, Marwan Diapari
1, Anoop Sindhu
1, Kirstin Bett
1,
Thomas D Warkentin
1and Bunyamin Tar’an
1*Abstract
Background: In the whole genome sequencing, genetic map provides an essential framework for accurate and efficient genome assembly and validation. The main objectives of this study were to develop a high-density genetic map using RAD-Seq (Restriction-site Associated DNA Sequencing) genotyping-by-sequencing (RAD-Seq GBS) and Illumina GoldenGate assays, and to examine the alignment of the current map with the kabuli chickpea genome assembly.
Results: Genic single nucleotide polymorphisms (SNPs) totaling 51,632 SNPs were identified by 454 transcriptome sequencing of Cicer arietinum and Cicer reticulatum genotypes. Subsequently, an Illumina GoldenGate assay for 1,536 SNPs was developed. A total of 1,519 SNPs were successfully assayed across 92 recombinant inbred lines (RILs), of which 761 SNPs were polymorphic between the two parents. In addition, the next generation sequencing (NGS)-based GBS was applied to the same population generating 29,464 high quality SNPs. These SNPs were clustered into 626 recombination bins based on common segregation patterns. Data from the two approaches were used for the construction of a genetic map using a population derived from an intraspecific cross. The map consisted of 1,336 SNPs including 604 RAD recombination bins and 732 SNPs from Illumina GoldenGate assay. The map covered 653 cM of the chickpea genome with an average distance between adjacent markers of 0.5 cM. To date, this is the most extensive genetic map of chickpea using an intraspecific population. The alignment of the map with the CDC Frontier genome assembly revealed an overall conserved marker order; however, a few local inconsistencies within the Cicer arietinum pseudochromosome 1 (Ca1), Ca5 and Ca8 were detected. The map enabled the alignment of 215 unplaced scaffolds from the CDC Frontier draft genome assembly. The alignment also revealed varying degrees of recombination rates and hotspots across the chickpea genome.
Conclusions: A high-density genetic map using RAD-Seq GBS and Illumina GoldenGate assay was developed and aligned with the existing kabuli chickpea draft genome sequence. The analysis revealed an overall conserved marker order, although some localized inversions between draft genome assembly and the genetic map were detected. The current analysis provides an insight of the recombination rates and hotspots across the chickpea genome. Keywords: Cicer arietinum, Genotyping-by-sequencing, Restriction site associated DNA (RAD) markers, Illumina GoldenGate and Genetic mapping
* Correspondence:bunyamin.taran@usask.ca
1Crop Development Centre, Department of Plant Sciences, University of
Saskatchewan, 51 Campus Dr, Saskatoon, SK S7N 5A8, Canada Full list of author information is available at the end of the article
© 2014 Deokar et al.; licensee BioMed Central Ltd. This is an Open Access article distributed under the terms of the Creative Commons Attribution License (http://creativecommons.org/licenses/by/4.0), which permits unrestricted use, distribution, and reproduction in any medium, provided the original work is properly credited. The Creative Commons Public Domain Dedication waiver (http://creativecommons.org/publicdomain/zero/1.0/) applies to the data made available in this article, unless otherwise stated.
Background
Chickpea (Cicer arietinum L., 2n = 16) is the second most widely grown food legume crops after common bean, with annual production of 11.6 M tons [1]. Chick-pea grains are a good source of many essential mineral nutrients, protein, and dietary fiber and are low in satu-rated fat (http://ndb.nal.usda.gov/ndb/foods/show/4778). The chickpea crop helps to restore and maintain soil fer-tility through symbiotic nitrogen fixation. Globally more than 90% of chickpea production occurs in the semi-arid tropics of Asia and Africa [1]; however during the last three decades acreage in non-traditional areas such as Australia, Canada and USA has increased rapidly. In the traditional production regions, chickpea is considered as a low input crop and is mainly grown on residual soil moisture. In these areas terminal drought, fusarium wilt and pod borer are some of the major constraints to chickpea production; whereas, in non-traditional, tem-perate growing areas ascochyta blight, low temperatures and end of season frost are the major constraints [2-4]. In spite of these constraints, considerable progress has been made in chickpea improvement using conventional breeding approaches. Several cultivars with improved re-sistance to different biotic and abiotic stresses have been commercialized. However, chickpea productivity globally is still very low (0.8 t/ha) [1] and has remained stagnant in the last two decades [5]. In contrast, application of mod-ern genomic approaches has contributed significantly to the overall yield improvement in many cereal crops [6,7].
Genetic maps may serve as the basis for genetic stud-ies of various agronomic traits through mapping of major genes and QTLs. They are also of practical benefit in the application of genomics through fine mapping, map-based cloning and development of tightly linked markers for marker-assisted selection (MAS). Limited genomic resources and low levels of genetic variability in the primary gene pool, however, have restricted the practical application of genetic mapping in chickpea [8]. During the last two decades several genetic maps have been developed for chickpea using restriction fragment length polymorphism (RFLP), amplified fragment length polymorphism (AFLP), cleaved amplified polymorphic sequence (CAPS), simple sequence repeat (SSR), and single nucleotide polymorphism (SNP) markers based on the mapping of populations derived from intra- and in-terspecific crosses [9-12]. In addition, several genomic resources including large collections of expressed se-quence tags (ESTs), SSRs markers and several thousands of SNPs have been developed in chickpea in recent years [13]. The availability of these genetic and genomic re-sources will facilitate in depth genetic study and in turn will aid in the development of chickpea cultivars with improved resistance to biotic and abiotic stresses and desirable agronomic traits.
Next generation sequencing (NGS) technology has be-come powerful tool for detecting large numbers of SNPs in a relatively short time frame [14]. SNPs are the most abundant class of markers present in both plant and ani-mal genomes [15]. The frequency of SNPs in plants var-ies from one SNP per 16 bp in Eucalyptus specvar-ies [16] to one SNP per 7000 bp in tomato [17]. In chickpea, SNP frequencies of one per 36 bp [18] to one per 973 bp [19] have been observed. However, the frequency calcu-lations are highly influenced by the diversity and number of accessions used in the analysis. The high frequency of SNPs in the chickpea genome compared to SSR markers (one SSR in every 4.85 kb) [20] makes SNPs an ideal marker system for development of high density genetic map and has now become the marker of choice among chickpea researchers [11,21].
In parallel to the development of sequencing technolo-gies, several new technologies for large scale SNP ge-notyping have been developed. These technologies can integrate up to one million SNPs and several folds of multiplexing per assay. Among these, Illumina Golden-Gate and Infinium genotyping platforms have been widely used in many crops including soybean [22], wheat [23], maize [24], rice [25], sunflower [26] and lentil [27]. These genotyping platforms have been used to generate high density genetic linkage maps with the average dis-tance of the adjacent markers of less than 1 cM in soy-bean [28], apple [29] and tomato [30].
The efficiency of genome-wide marker-trait association mostly depends on SNP marker density and distribution. Therefore, it is important to develop SNP based geno-typing platforms that allow association study to be con-ducted in chickpea. Cost involved in the development of an array-based genotyping platform mostly depends on initial SNP discovery, SNP selection and development of array platforms.
Recent advances in DNA sequencing technologies have generated several cost-effective SNP discovery and genotyping platform such as genotyping-by-sequencing (GBS) [31], complexity reduction of polymorphic se-quences (CRoPS) [32], and restriction site associated DNA (RAD) [33]. RAD markers together with NGS have provided an efficient method that can simultaneously detect thousands of SNPs and provide genotypic data of several hundred samples with no prior genome sequence information. The effectiveness of RAD markers for de-velopment of high density genetic map and QTL analysis [34], and association mapping [35] has been successfully demonstrated in several plant species.
Whole genome re-sequencing of more than 90 chick-pea cultivars of desi type (smaller seeds of angular shape with dark seed coat), kabuli type (large owl's or ram's head shaped seeds with cream-colored seed coat) and wild accessions has been completed recently [36,37]. A
high density genetic map is a primary requisite to anchor the assembled scaffolds to chromosomes. The previous genetic linkage map [21,38] only allowed 65.2% of the assembled scaffolds to be anchored on the final eight chromosomes of the kabuli chickpea [36]. Therefore, a dense genetic map with additional markers would be de-sirable to allow anchoring of a higher percentage of the assembled scaffolds.
In the early phase of chickpea genomic research, many linkage maps were developed using interspecific crosses between Cicer arietinum and C. reticulatum due to the low polymorphism among the cultivated chickpea geno-types. In the present study, we generated one of most comprehensive and high density chickpea genetic maps from intraspecific population available to date. We also demonstrated the potential use of this map as tool for improving the whole genome assembly. Comparison of this high density genetic map with the whole genome se-quencing data revealed the recombination landscape in the current population. The identified SNP markers with anchored positions on the genetic and physical maps can be used for fine scale QTL mapping and candidate gene identification.
Materials and methods
Experimental design
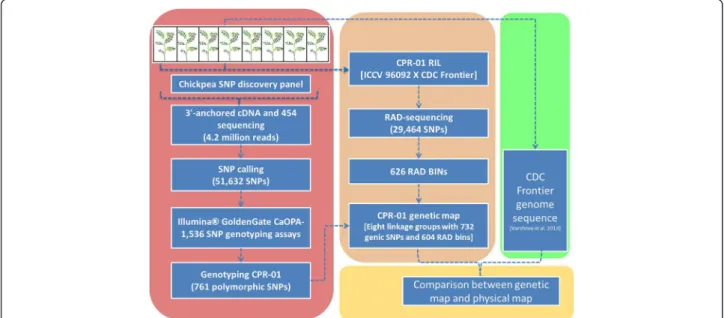
The schematic outline of the experimental protocol is given in Figure 1. Large scale SNP discovery and genotyping were
done using two high-throughput methods: First, transcrip-tome sequencing using 3’-anchored cDNA 454 sequencing and genotyping using Illumina GoldenGate assays, and second using genotyping-by-sequencing RAD-seq. A high density linkage map of CPR-01 was constructed using 1,336 SNP loci (604 RAD bins and 732 genic SNPs). The high-density CPR-01 map was compared with CDC Fron-tier genome sequences.
Plant material
Eight chickpea genotypes: Amit, CDC Frontier, CDC Xena, ICC 12512–1, ICCV 96029, Y9563-28, Cr 5–10 and ILWC 118, were used for SNP discovery. These lines rep-resent cultivated chickpea (Cicer arietinum L.), including desi and kabuli market classes, as well as wild species (Cicer reticulatum) accessions (Table 1).
CPR-01, a bi-parental mapping population of 92 RILs derived from a cross between ICCV 96029 and CDC Frontier [9] was used to map the SNPs. CDC Frontier is a kabuli type chickpea cultivar released in 2003 by the Crop Development Centre, University of Saskatchewan and is the most widely grown kabuli cultivar in western Canada [39]. CDC Frontier has medium seed size, is day length sensitive, and moderately resistance to ascochyta blight. ICCV 96029 is a desi type cultivar released in 2000 by ICRISAT. It has a small seed size, is day length insensitive and highly susceptible to ascochyta blight.
Figure 1 Schematic diagram describing the experimental approach to develop a high density genetic map of chickpea. A SNP panel of eight chickpea accessions representing desi, kabuli and wild species were used for SNP discovery. 3’-anchored cDNA was sequenced using the Roche 454 Titanium sequencing. SNP calling was done using in-house developed pipeline. Illumina 1536 SNP genotyping assays were developed. CPR-01 was genotyped using Illumina GoldenGate and Restriction site associated DNA (RAD) markers. An integrated high density genetic map was generated from the two data sets. A comparative study between CPR-01 and the recently released draft chickpea genome sequence (Varshney et al. 2013) was conducted. See main text for details.
SNP discovery, SSR discovery and Illumina GoldenGate genotyping
Plant tissue for RNA extraction was collected from each genotype individually at various developmental stages, including seedling emergence, 8–10 node stage, early flowering stage, early pod stage and early senescence. Total RNA was extracted using the RNeasy Plant Mini Kit (Qiagen) and treated with DNase I (Invitrogen) to re-move DNA contamination. Two micrograms of total RNA at each developmental stage were pooled. Aci I digested 3’-anchored cDNA libraries were constructed as previously described [40,41]. Each line was sequenced using the Roche 454 Titanium sequencing protocol fol-lowing the procedure described by Margulies et al. [42] and Titanium chemistry as described in the protocols supplied by the manufacturer (Roche, Laval, Quebec). The libraries were sequenced at the National Research Council Canada, Saskatoon, SK, Canada. Sequencing reads were aligned directly to the chickpea scaffold as-sembly V0.1 using GMAP [43] to produce SAM file for-mat. SNP discovery for each genotype was undertaken using Samtools Version = 0.1.18 (http://samtools.source-forge.net/). SNPs present in at least two of the eight accessions were filtered for further analysis. In order to de-sign oligos for the Illumina GoldenGate array (Illumina Inc., San Diego, CA), sequences with a minimum of 60 bp flanking the SNP were selected. Further, SNPs were se-lected based on the Illumina Assay Design Tool (ADT) score (above 0.4 and preferentially above 0.6) and even distribution across the Medicago genome. This strategy was designed and implemented prior to the availability of the chickpea pseodochromosomes (Cicer_arietinum_ GA_v1.0 pseudochromosomes). The same strategy has been successfully implemented in lentil SNP genotyping assay design [27]. Intron-exon boundaries within 60 bp of the SNP flanking regions (121 bp sequence) were pre-dicted using BLASTN analysis with the Medicago genome and sequences located within a single exon were selected.
Finally, 1,536 SNPs were chosen for Illumina GoldenGate assay for the production of an Oligo Pooled Array (Ca1536 GoldenGate OPA). Twenty SNPs were randomly selected for validation using allele-specific PCR assays (KASP™ As-says, LGC Genomics).
Gene ontology (GO) analysis was conducted on SNPs containing transcript sequences using Blast2GO program [44]. These transcripts were also annotated into Kyoto Encyclopedia of Genes and Genomes (KEGG) pathways with KEGG Automatic Annotation Server (KAAS), using Arabidopsis thaliana and Oryza sativa data sets [45]. A SnpEff v3.0 open source program was also used for variant annotation and effect prediction of SNPs (http://snpeff. sourceforge.net/) [46].
SSR identification was done using the QDD software program [47] with the following criteria: a minimum of eight repeats for dinucleotide motifs, six repeats for tri-nucleotide motifs and five repeats for tetratri-nucleotide motifs and a minimum length of 100 bp for the PCR product.
SNP genotyping was performed using the Illumina GoldenGate platform, following the standard assay proto-col (www.illumina.com/technology/goldengate_genotypin-g_assay.ilmn). Products generated by this assay were read with an Illumina HiScan (Illumina Inc., San Diego, CA) and the resulting data were clustered for allele calling using GenomeStudio software version 2010.3 (Illumina Inc., San Diego, CA). Allele calls and genotype clusters were visually inspected for errors in automated SNP geno-type clustering algorithm and corrected based on the ex-pected segregation ratio in the RIL population [48].
RAD sequencing
High quality genomic DNA from ICCV 96029, CDC Fron-tier and 92 inbred lines from CPR-01 was extracted follow-ing the procedure described in Saghai-Maroof et al. [49]. Individual DNA samples were quantified using PicoGreen Assay (Life Technologies) and adjusted to 50 ng/ul. A total
Table 1 Results of transcriptome sequencing and SNP discovery in cultivated and wild chickpea in comparison to the reference CDC Frontier genome [36]
Chickpea accessions Species (Desi/Kabuli) Important traits Total 454 reads
Number of SNPs
Average read depth CDC Frontier Cicer arietinum L. (Kabuli) Yield, Ascochyta blight resistance, photoperiod sensitivity 490,245 NA NA
Amit Cicer arietinum L. (Kabuli) Yield, Ascochyta blight resistance 496,109 1,592 7
CDC Xena Cicer arietinum L. (Kabuli) Yield, seed quality 531,970 1,813 7 ICC 12512-1 Cicer arietinum L. (Desi) Ascochyta blight resistance 507,802 2,872 8 ICCV 96029 Cicer arietinum L (Desi) Earliness, double podding, photoperiod insensitivity 520,733 3,286 8 Y9563-28 Cicer arietinum L (Desi) Earliness, double podding 509,682 2,898 8 Cr 5-10 Cicer reticulatum L. (wild) Rust (Uromyces ciceris-arietini) resistance 605,001 28,712 10 ILWC 118 Cicer reticulatum L. (wild) Ascochyta blight resistance 560,322 28,071 11
Total 4,221,864 51,632*
of 1 μg of DNA from each RIL was then used for RAD li-brary construction following the protocol described in Baird et al. [33] and an updated method to enable pair-end Illumina sequencing (https://www.wiki.ed.ac.uk/display/ RADSequencing/Home). Briefly, genomic DNA from each RIL was digested with EcoRI (New England Biolabs) and then ligated to a P1 adapter containing a six-bp index identifier unique to each individual. The adapter-ligated fragments were subsequently pooled, randomly sheared and size-selected between 300–500 bp on an agarose gel. The obtained DNA fragments were then ligated to a P2 adapter. To enrich RAD tags, the adapter-ligated DNA was subjected to 18 cycles of PCR enrichment followed by gel purification of the 300 to 500 bp DNA fragments. Up to 24 RAD libraries, each representing an individual RIL, were pooled for 100 bp pair-end sequencing using estab-lished v3 chemistry methodologies on single lanes of an Illumina HiSeq 2000 flow-cell (Illumina Inc.). Following sequencing and Illumina data processing (Casava v1.8.0), the valid raw pair-end reads were separated into pools using custom Perl scripts to identify reads associated with individual RILs.
Paired-end Illumina reads were demultiplexed using the FASTX toolkit's barcode splitter and PCR duplicates were removed with Samtools rmdup. Reads from each line were aligned to the chickpea genome with Bowtie [50], allowing up to two mismatches with a maximum of 600 bp between each end. SNP calling was performed using Samtools mpileup [51] allowing up to 66% missing data, a maximum of 10% heterozygosity, and allele fre-quency between 0.2 and 0.8. Additionally, any lines showing more than 10% residual heterozygosity were re-moved from further analysis. Some of the missing data was inferred by examining the allele calls flanking the missing data for a given line within a scaffold. If the flanking calls were identical we assume that no recom-bination occurred in that region. Based on this assump-tion, clusters of SNPs with identical segregation patterns were then merged and binned.
Genetic mapping
Genotypic data generated using the RAD-seq and Illu-mina GoldenGate were used to create the genetic link-age map of CPR-01. Linklink-age analysis between the markers and the best possible linear order of the loci were determined using MadMapper [52], RECORD [53] and QTL Icimapping V3.2 (http://www.isbreeding.net/) software. Before linkage analysis, genotypic scores were filtered for missing data (genotypic score missing in more than 25% RILs and 30% per marker) and distorted allele frequency. The marker loci with allele frequencies of < 0.2 for one parent and > 0.8 for the other parent were removed from further analysis. The filtered SNP markers were clustered into linkage groups using
MadMapper with recombination value (haplotype dis-tance) cut-off of 0.2 and a BIT score of 100. Linkage groups were assigned using the position of SNP markers on the pseudochromosomes of the chickpea genome. Marker order was determined using the RECORD algo-rithm of RECORD_win and QTL Icimapping V3.2 soft-ware with a setting of 30 cM gap size, Kosambi mapping function and 0.1 recombination fraction allowed. Rip-pling was done by permutation of a window of 5 markers using COUNT rippling criteria. Following the initial map construction, double recombinants or single-tons were identified as potential genotyping errors using the color genotypes feature of the MapDisto tool [54]. The potential genotyping errors and missing genotypes were inferred by using information from flanking marker data with the initial marker order. In the second round, (i.e. after error correction and infer missing genotypes) marker order was generated using the RECORD algo-rithm of RECORD_win and QTL Icimapping V3.2. The best marker order with the shortest linkage map distance was finally selected.
Calculation of recombination values and genome coverage
The average genome-wide average recombination fre-quency in cM/Mb was calculated by dividing the total genetic map length by 323 Mb genome size flanked by the most distal markers on each linkage group. The average recombination frequency in genes/cM was cal-culated by dividing the total number of genes (28,269) by the map length. Recombination rates for individual chromosomes were calculated by dividing the genetic length (cM) by the sequence length (Mb) between the first and last marker placed on each chromosome. The estimated genome length was calculated using the method 4 of Chakravarti et al. [55], in which total length of the linkage groups is multiplied by the factor (m + 1)/ (m-1), where m is the number of markers in the linkage groups. Furthermore according to Sekino and Hara [56] genome coverage was calculated as the ratio of total map length and estimated map length.
Results
Discovery and distribution of genic SNPs
In order to identify SNPs in the genic region of chick-pea, eight diverse chickpea genotypes (Table 1) were se-lected for targeted 3’-cDNA transcript profiling using 454 Pyrosequencing technology. This process generated 4.2 million high quality (HQ) reads with an average se-quence length of 472 bp (SD = 112, range = 46 to 1201). The number of raw sequence reads per genotype ranged from 496,109 reads (in cv. Amit) up to 605,001 reads (in Cr 5–10). The HQ reads were mapped against the initial draft scaffold assembly V0.1 using GMAP. Average read
depth ranged from 7 to 10. In total, Samtools mpileup detected a set of 51,632 non-redundant SNPs (Table 1). Finally, 2, 279 polymorphic SNPs among the cultivated genotypes and no more than 50% missing data, were se-lected for SNP assay design (Additional file 1).
Functional and structural impact of identified genic SNPs
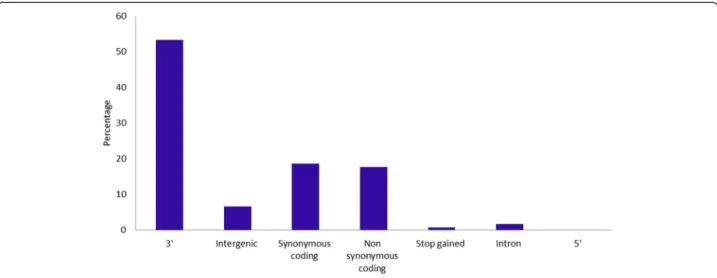
We investigated the functional and structural impact of the identified genic SNPs selected for assay design by comparing the position of the SNPs relative to the anno-tated chickpea genome. The majority (2,536 SNPs) were distributed across the eight chickpea pseudochromo-somes, whereas 153 SNPs were distributed in 93 un-placed scaffolds. Only 40 SNPs could not be located in the CDC Frontier genome sequence. The average fre-quency of SNPs across the chickpea genome was one SNP per 138.7 Kb. The distribution of the genic SNPs was not equal for all chromosomes. The highest number of SNPs was identified on Ca4 (696) followed by Ca7 (390), Ca6 (324) and Ca1 (315), whereas the lowest number of SNPs were identified on Ca5 (137) followed by Ca8 (139), Ca3 (263) and Ca2 (272). The ratio of transitions to transversions (Ts/Tv) was 1.5, which is ex-pected for genic regions. 53.3% of these SNPs resided downstream of an open reading frame, 37.4% in coding regions of which 18.7% were synonymous coding, 17.8% were non-synonymous coding and 0.8% generated a stop codon. Interestingly, 6.7% of SNPs resided in intergenic regions, that are located at least 5 kb up- or downstream of a gene. Further 23 SNPs in coding sequence that in-troduced a TAG, TAA, or TGA stop codon could poten-tially alter the function of these genes (Figure 2).
Functional characterization of SNPs (gene annotation)
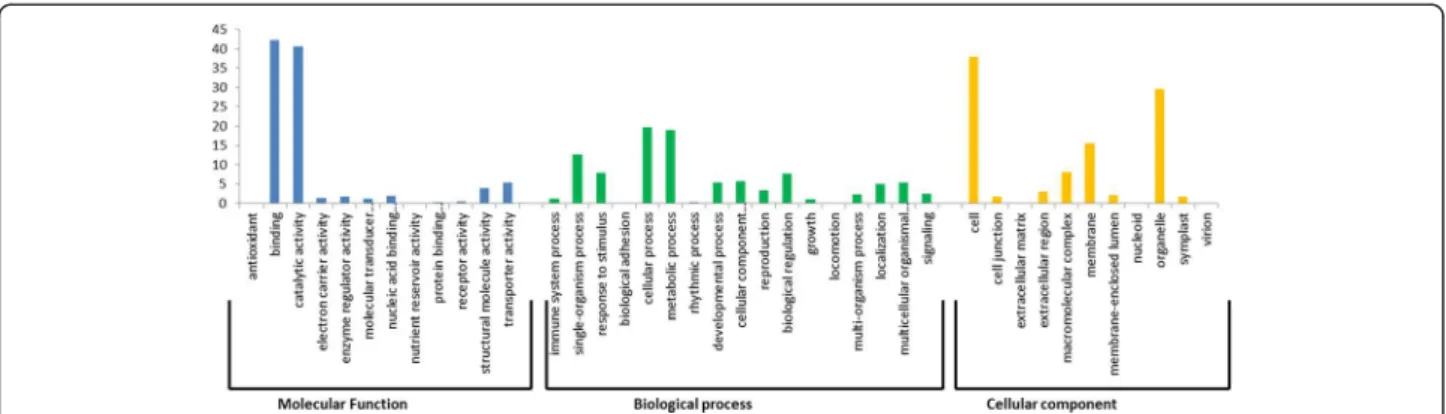
A total of 2,689 SNPs selected for assay design resided in the 1,322 genes of the CDC Frontier annotated chickpea genome. These SNPs represents an average of 1.3 SNPs per gene with a minimum of one and maximum of seven SNPs per annotated gene. 853 SNP-containing transcript sequences did not show any sequence similarity with anno-tated chickpea genes. SNP-containing transcript sequences were assigned GO term annotations using Blast2GO. A total of 1,056 sequences were assigned at least one GO term for describing biological processes, molecular func-tions and cellular components (Figure 3). For molecular function, genes involved in binding, catalytic activity and transporter activity were highly represented. Of the bio-logical process, the major categories were cellular process, metabolic process and single-organism process. In the cel-lular component group, the major categories were cell, or-ganelle and membrane.
The 1,322 SNP containing transcripts represent 464 ortholog groups (KO entries; the K numbers). The KO represents 241 pathways with maximum hits in the bio-synthesis of secondary metabolites, followed by meta-bolic pathways. Annotation of SNP containing transcript sequences into GO and KEGG could serve as important and valuable resources for gene identification and func-tional analysis of some important traits in chickpea.
Phylogenetic and diversity analysis
To investigate SNP diversity in the gene coding region that has been generated or lost during domestication and breeding, we compared SNPs between the cultivated chickpea (Cicer arietinum) genotype group and its wild progenitor (Cicer reticulatum) genotype group. A further
Figure 2 Distribution of genic SNPs on the basis of their location in the predicted gene models of the chickpea genome. SNPs were categorised using gene structure annotation information retrieved from the ICRISAT chickpea genome database (http://www.icrisat.org/gt-bt/ ICGGC/GenomeManuscript.htm).
95 SNPs were found polymorphic between desi and wild progenitor, and 227 SNPs between kabuli and wild type chickpea. We identified 104 SNPs that were present be-tween desi and kabuli groups.
Population structure was analysed based on genic SNPs, using principal component analysis (PCA) and NJ-phylogenetic tree. The first three principal compo-nents explained 56.3% of the total variation and showed
clustering of chickpea lines into cultivated and wild groups (Figure 4-A). The phylogenetic analysis also showed clear clades separating cultivated and wild ac-cessions. Further, cultivated groups sub-divided into desi and kabuli type of chickpea. Desi type chickpea ac-cession ICCV 96029 formed an intermediate clade be-tween desi and kabuli accessions, defining its pedigree (Figure 4-B).
Figure 3 GO annotations of SNP containing transcripts. Annotations were grouped by three Gene Ontology classes, molecular function, biological process and cellular component. The data presented here represents the level 2 analysis and illustrating the general functional categories.
Figure 4 Principal component analysis (PCA) and phylogenetic analysis using Neighbour joining (NJ) based on SNP genotypic data. A: PCA on SNP genotypic data of the eight chickpea accessions. The X and Y-axes show PC1 (21.2%) and PC2 (20.3%), respectively. B: NJ tree showing genetic relationships among the chickpea accessions. The NJ-tree grouped chickpea genotypes into two major clades wild and cultivars. Further the cultivars were grouped into sub-clades, i.e., desi and kabuli types.
Microsatellites or SSRs present in the genic sequences also showed the extensive genetic diversity among the chickpea accessions. A total of 1,415 loci containing microsatellite repeats were identified. Di-nucleotide SSRs were the most abundant repeats (55.6%), followed by tri-(42.6%), tetra- (1.3%) and penta-nucleotides (0.4%). The TA and GAA repeats represented the most di- and tri-nucleotide repeats, respectively. PCR primer pairs were designed for 585 SSRs. An in silico analysis of SSR con-taining sequences showed 153 polymorphic SSRs across the eight chickpea genotypes. Di-nucleotide SSRs were more polymorphic than tri-nucleotide repeats. The num-ber of alleles ranged from 2–4 and PIC value ranged from 0.2 to 0.6 (Additional file 2).
Development of SNP genotyping assays and RIL genotyping
A total of 2,729 SNPs were processed for custom OPA design with Illumina Assay Design Tool (ADT). On the basis of ADT, 2,562 (93.8%) SNPs were assigned ADT score of ≥0.6, indicating a high success rate for the con-version of a SNP into a successful GoldenGate assay. In the SNP validation process, 18 (90%) out of 20allele-specific PCR assays resulted in the identical genotype to the transcriptome sequence based SNPs (Additional file 3), thereby validating the process of SNP calling and confirming the high quality of this filtered set of SNPs. The 1,536 GoldenGate OPA was used to genotype the CPR-01 population. 1,519 SNPs (98.9%) exhibited clear interpretable clustering patterns and high GenTrain scores (mean = 0.81 ± 0.10 s.d.). Of these, 761 (49.5%) of the SNPs were polymorphic between ICCV 96029 and CDC Frontier and the remaining 750 (48.8%) were monomorphic. 17 (1.1%) SNPs failed and 8 (0.5%) had a pattern where one or another allele failed (Figure 5).
Restriction site-associated DNA sequencing (RAD-seq)
In total, 555.6 million raw sequence reads were gener-ated through sequencing of 92 individuals of the CPR-01 population and two parental lines in four lanes at 24-plex each lane. On average, 138.9 million raw sequence data were collected per lane; 51.4% of reads were mapped uniquely, whereas 20.9% of reads were mapped
to multiple positions in the chickpea scaffold assemblies. After removing redundant reads, 22.9% of the reads were used for further analysis. A total of 233,334 raw variant SNPs across 6,556 RAD tags were identified from the collective analysis of 92 RILs against the genome assem-bly and provided the raw segregation data matrix for the entire population. A filtered set of 29,464 high quality SNPs (maximum heterozygosity 10%, maximum missing data 66%) were identified. After further imputation of missing data, 12,012 high-quality SNPs were selected and clustered into 626 bins with identical segregation patterns. Single SNP representing each of the 626 bins was used for linkage analysis.
The number of RAD tags sequenced per Mb showed uniform genome-wide distribution across the chickpea genome (Figure 6). On average each tag was sequenced approximately 1to 235 times in every individual, indicat-ing sufficient depth to achieve significant statistical power for SNP calling.
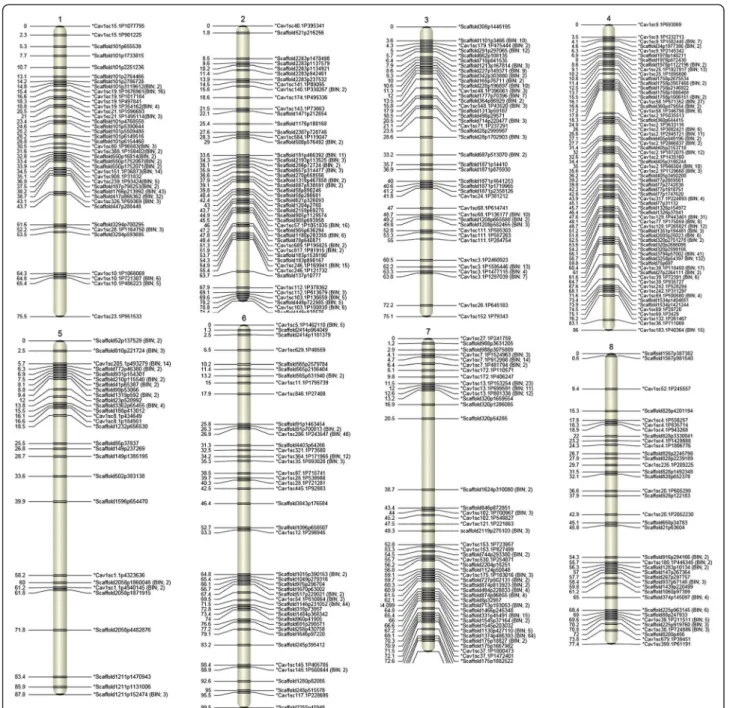
High-density CPR-01 genetic linkage map
A total of 92 RILs belonging to the CPR-01 population were used to construct the linkage map. A total of 1,336 SNPs out of 1,387 SNPs were mapped into eight linkage groups (Figure 7). The remaining 51 (22 RAD and 29 GoldenGate SNP) markers were not integrated into CPR-01 linkage map. CPR-01 showed a range of residual heterozygosity from 0 to 30.7%, with an average of 4.3% and median of 1.2%. Across the whole-population re-sidual heterozygosity is 6.4%, which is 4-fold more than the expected residual heterozygosity in an F7-derived
RIL population.
The linkage map covered a genetic distance of 653 cM, with 0.5 cM average distance between pairs of markers (Table 2). The linkage groups spanned a minimum of 71.4 cM (LG2) to a maximum of 99.5 cM (LG6). The number of loci per linkage group varied from 55 (LG5) to 429 (LG4) with a mean of 167 per linkage group. Accord-ing to 322 Mb portion of the chickpea genome flanked by the most distal markers on each linkage group, the average inter-marker physical distance is 240.9 Kbp per marker. The average recombination frequency in genic regions is 43.3 genes/cM.
(See figure on previous page).
Figure 5 Genotyping of CPR-01 RIL mapping population using Illumina GoldenGate genotyping platform. Representative clustering pattern of SNP genotyping generated using the Illumina GenomeStudio software where clusters in red dots represent ICCV 96029 type allele and blue represent CDC Frontier type allele. Illustrating examples of A: monomorphic marker (Cav1sc20.1p369405), B: polymorphic marker
(Cav1sc22.1p1201405), C: dominant type SNP (Cav1sc145.1p492549) being presence in ICCV 96029 and absence in CDC Frontier, D: dominant type SNP (Cav1sc22.1p1253434) being homozygous in CDC Frontier and heterozygous in ICCV 96029, E: heterozygote alleles for all RILs (Cav1sc242.1p436014), F: failed genotype pattern (Cav1sc680.1p93464). The data points in color represent genotype calls for each sample (red = AA; purple = AB; blue = BB; black = outlier) and the parents of CPR-01 population are highlighted in yellow. The x-axis (Norm Theta) represents angle of the center of cluster in normalized polar coordinate while y-axis (Norm R) represent normalized intensity.
Segregation distortion
Segregation distortion was observed for 468 (35.0%) of the total mapped markers (χ2 test, p < 0.05 and allele frequency ≤0.4 and ≥0.6). Among the distorted markers, the majority (93.4%) deviated towards the female parent ICCV 96029 and 6.6% marker deviated towards the male parent CDC Frontier. This pattern of preferential trans-mission of ICCV 96029 alleles occurred in all linkage groups; except LG3, LG6 and LG8. LG4 showed the highest proportion of ICCV 96029 alleles (62.0% of total maternal alleles), whereas LG3 showed the highest pro-portion of CDC Frontier alleles (54.9% of total paternal alleles). Most of the distorted markers were clustered in specific regions on linkage groups ranging in size from 2.9 to 34.1 cM and consisting of 2 to 200 markers (Figure 8). These regions were defined as Segregation Distortion Re-gions (SDRs). Generally, all the markers showing segrega-tion distorsegrega-tion had higher frequency towards the same parent in a given SDRs.
Comparison of CPR-01 genetic map with chickpea pseudochromosomes
As one of the parents of CPR-01 is CDC Frontier, we compared the genetic map of CPR-01 with the CDC Fron-tier genome assembly. BLAST search of SNP marker se-quences against the draft genome assembly assigned a total of 1,073 (80.3%) marker loci into eight pseudochro-mosomes and 215 (16.1%) markers into unplaced scaf-folds. 12 (0.9%) markers could not be placed on the chickpea genome sequence using the BLAST search indi-cating that the corresponding genome sequence was
missing from the published draft chickpea genome assem-bly. The details of mapped markers are presented in Table 3. Among the physically placed markers, 36 did not show the corresponding chromosomal assignment and are referred to as the non-syntenic markers. Some of these non-syntenic markers were singletons, but others formed clusters of 2–6 markers. For instance a cluster of 5 markers from LG4 was physically mapped to Ca6 of CDC Frontier genome. Whereas in another case, a cluster of 6 markers from LG4 was physically mapped on Ca3 of CDC frontier genome.
Marker order was relatively conserved between the CPR-01 genetic map and the Cicer_arietinum_GA_v1.0 pseudochromosomes (Figure 9). The highest correlation between the whole genetic map and the physical map was observed for LG2 and LG3 (Spearman’s correlation coeffi-cient 0.98), whereas the lowest correlation was observed for LG1 (Spearman’s correlation coefficient 0.69). For the rest of the linkage groups, Spearman’s correlation coeffi-cient ranged from 0.80 to 0.97, indicating an overall good correlation between genetic and physical maps. Within some regions of the genome, inconsistency in order was observed between the genetic and physical maps. For ex-ample, in LG5, the region between 39.9-87.8 cM has nega-tive Spearman’s correlation coefficient (−0.97) compared to the positive correlation coefficient value (0.83) of the entire LG5 indicating a possible inversion during assembly of the genome sequence. Similarly on LG8, the region be-tween 68.4-69.6 cM has negative Spearman’s correlation coefficient (−0.85). This also points out probable errors in the chickpea sequence assembly.
Figure 6 Distribution of RAD tags across the chickpea genome. Graph illustrates the number of RAD tags sequenced per Mb, in background with gene density and transposon density per Mb across the chickpea genome. All the transposons and genes were retrieved from the ICRISAT chickpea genome database (http://www.icrisat.org/gt-bt/ICGGC/GenomeManuscript.htm).
Genome wide recombination rate in chickpea
Comparison of the genetic distance based on CPR-01 link-age map and the physical distance based on CDC Frontier genome provided a snapshot of the relative range in the recombination rate along the chromosomes. The average recombination rate across the chickpea genome was 2.0 cM/Mb (Table 4). Recombination rates for individual chromosomes ranged from 1.6 to 4.8 cM/Mb. LG8 has the maximum recombination rate of 4.8 cM/Mb and LG1 the lowest at 1.6 cM/Mb likely due to the large inversion
occurred on the LG1. In contrast to the average recombin-ation rate of the entire chromosome, the recombinrecombin-ation rate within chromosomes varied considerably, with a range of 0 to 52 cM/Mb. Chromosomal regions with a high recombination rate (>20 cM/Mb) were considered as ‘hot spots’ for recombination. At least five hot spots were detected on chromosomes Ca1, Ca2, Ca4 and Ca8. There were also several regions with moderately high (10–19 cM/Mb) recombination rate. The highest re-combination rate was observed in an interval between
Figure 7 Linkage map of chickpea based on CPR-01. Distances of the loci (cM) are shown to the left and the names of SNP markers are shown to the right side of the linkage groups. Loci are represented as genetic BINs. The numbers of discrete polymorphic markers in corresponding BINs are noted in brackets.
scaffold101p2764466 and scaffold101p2786728 on Ca1, showing a genetic distance of 2.5 cM and physical dis-tance of 22.2 Kb. As the centromeres and their flanking pericentromeric regions are not precisely defined in the chickpea genome, the regions with 0 cM/Mb where re-combination was completely suppressed can be consid-ered ‘cold spots’ (Table 5). In order to avoid conflict between centromeric regions and recombination cold spots, we have not analysed the cold spots in detail in this research. However, one of the chromosomal regions in Ca6 was used to compare the region with high and low recombination rates. This chromosomal region in-cludes a recombination ‘cold spot’ (0 cM) that extends from scaffold1146p231052 to scaffold130p30393, with a corresponding physical distance of 22.8 Mb. This ‘cold spot’ has a low gene density of 39.6 genes per Mb as compared with gene density of 66.2 genes per Mb across the whole chickpea genome.
Discussion
SNP discovery and genotyping
Gene based molecular markers have increasingly been used in genetic mapping and in breeding programmes for marker-assisted selection (MAS) in several crops. Over the last few years NGS platforms have accelerated the process of large scale SNP discovery see review by [57] leading to the development of large numbers of SNP-based markers. Here we identified 2,979 high qual-ity SNPs in cultivated (desi and kabuli type) and wild chickpea genotypes using Aci I digested 3’-anchored cDNA profiled by 454 sequencing. 3’-anchored cDNA profiling, where cDNA is sequenced from the extreme 3’ end of transcript, provides an accurate analysis of mRNA distribution due to the high read-depth representation [27,40]. The larger representation of 3’ UTR-located SNPs compared to coding region SNPs (53.3% vs. 37.0% respectively), combined with the higher read-depth, leads to the higher prospect of identifying SNPs using
3’-anchored cDNA sequencing compared to sequencing of randomly sheared cDNA fragments.
One of the important reasons behind the utilization of genic SNP markers in genetic mapping is its potential to establish a direct link between important agronomical traits to the functional SNPs and also to find candidate genes underlying traits of interest. Several genic SNPs markers with significant association with traits have been identified in many plant species [58,59]. In chick-pea, SNPs from five different candidate genes (ERECTA, ASR, DREB, CAP2 and AMDH) were found significantly associated with morphological, phenological, yield and yield related traits [60]. Recently Thompson and Tar’an identified a SNP within the acetohydroxyacid synthase 1 (AHAS1) gene which confers resistance to imidazolinone (IMI) herbicide and also developed a breeder friendly allele-specific SNP marker for use in marker-assisted se-lection (MAS) for IMI-resistant in chickpea [61]. These findings suggest that genic SNPs can be used as func-tional markers to establish the link with traits and can be potentially used in marker assisted selection of geno-types with the desired alleles.
We used three genotypes of each desi and kabuli mar-ket class and two wild chickpea accessions for genic SNP discovery. The average allele frequency of the iden-tified SNPs was 4.9% for kabuli accessions and 8.8% for desi accessions. This difference reveals that desi acces-sions used in this study were more genetically diverse then the kabuli accessions. In contrast Upadhyaya et al. [62] observed more genetic diversity in kabuli accessions than in desi accessions using 48 SSR markers. The lim-ited sample size used in the current study makes it diffi-cult to draw any conclusion about SNP prevalence in either type of cultivated chickpea. The 8 accessions used in the analysis were selected as the most diverse mate-rials (based on pedigree, phenotype data and some initial marker analysis) from a pool of breeding lines and germ-plasm collection available to us. We believed that these
Table 2 Summary of the CPR-01 genetic linkage map
Linkage groups
Number of recombination BINs per LG
No of markers in BINs
Singleton markers
Total number of markers per LG
Total map distance in cM LG1 18 149 21 170 75.5 LG2 17 87 30 117 71.4 LG3 21 112 20 132 75.1 LG4 30 394 35 429 86.0 LG5 11 38 17 55 87.8 LG6 11 124 32 156 99.5 LG7 24 195 25 220 80.2 LG8 10 30 27 57 77.4 Total 142 1129 207 1336 653.0
lines although relatively small in number may represent the true diversity in the larger pool of genotypes. The identified genic SNPs were able to determine genetic re-lationships among the selected diverse chickpea acces-sions. The phylogenetic analysis based on SNP diversity identified clear clustering of chickpea accessions based on species type. Cultivated and wild type accessions were
clearly separated. Within cultivated accessions desi type and kabuli type also form separate clusters, whereas ICCV 96029 was placed intermediate between the desi and kabuli clusters. The pedigree of ICCV 96029 justifies the phylogen-etic relationship of ICCV 96029 with both desi and kabuli accessions as ICCV 96029 is derived from a complex cross between five different desi (K-850, Gw-5/7 and XP-458) and
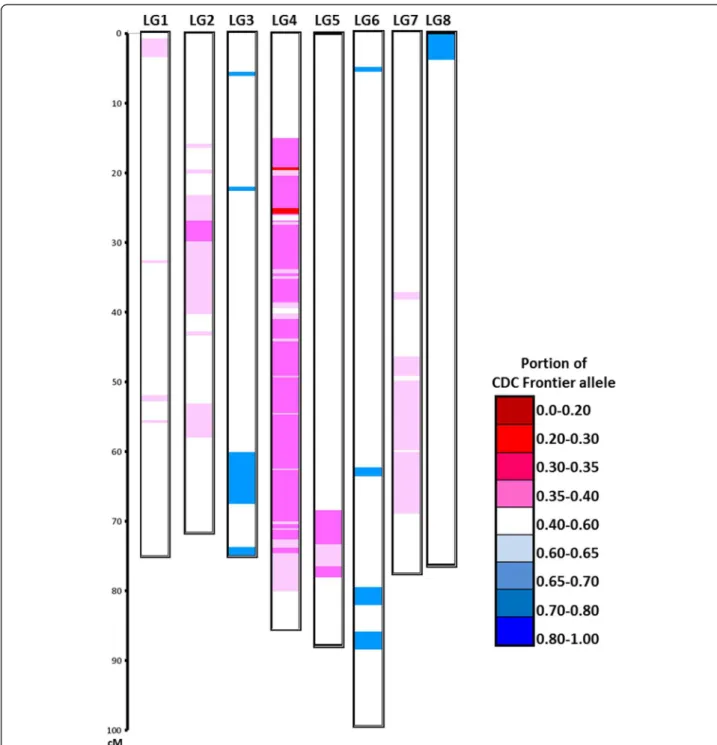
Figure 8 Segregation distortion in CPR-01 population. Genotype of 1,336 SNP loci over eight chickpea linkage groups. The proportion of CDC Frontier alleles is indicated by the color scale. White color indicates equal portion of CDF Frontier and ICCV 96029 alleles (no segregation distortion), increasing red intensity indicates significant overrepresentation of CDC Frontier alleles and increasing blue intensity indicates significant overrepresentation of ICCV 96029 alleles.
kabuli accessions (L-550 and Guamuchil). Overall, these results are in general congruence with the earlier genetic diversity studies [63] and demonstrate the utility of identi-fied genic SNPs for studying genetic diversity in chickpea.
The effectiveness and suitability of the Illumina GoldenGate SNP genotyping platform has been well
demonstrated in several crops, including chickpea [11]. Our study provides an additional set of 1,536 SNPs that can be used for genotyping mapping populations and other genetic resources of chickpea. The SNP genotyp-ing success rate was high, with 98.9% SNPs showgenotyp-ing clear scorable clusters. The higher genotyping success
Figure 9 Comparison between CPR-01 genetic map with the physical distance of eight chickpea pseudochromosomes, and corresponding recombination rates. X-axis: physical position of the SNPs on the chickpea psudochromosome in Mb. In case of comparison between genetic and physical map Y-axis: genetic distance in cM, whereas in recombination rate maps Y-axis: recombination rate in cM/Mb.
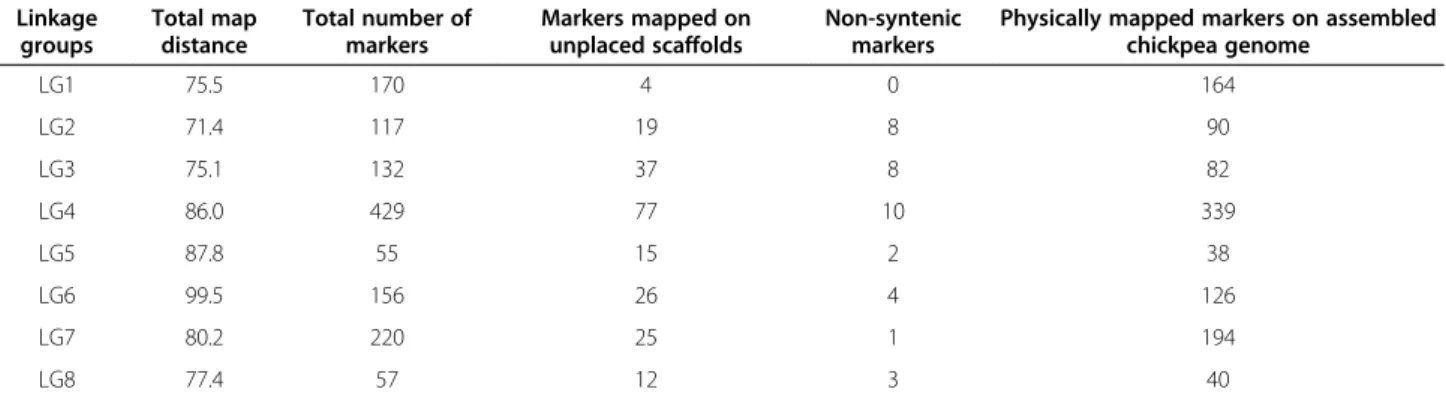
Table 3 Physical mapping of SNP markers in the chickpea genome
Linkage groups Total map distance Total number of markers Markers mapped on unplaced scaffolds Non-syntenic markers
Physically mapped markers on assembled chickpea genome LG1 75.5 170 4 0 164 LG2 71.4 117 19 8 90 LG3 75.1 132 37 8 82 LG4 86.0 429 77 10 339 LG5 87.8 55 15 2 38 LG6 99.5 156 26 4 126 LG7 80.2 220 25 1 194 LG8 77.4 57 12 3 40
rate than previously reported in chickpea (90.8%) [11], pea (91.0%) [64], and lentil (84.0%) [27] is attributed to the SNP calling criteria and SNP selection process employed in the assay design in this study.
Genetic mapping with gene-based SNP markers in chickpea genome consist of >45% repetitive elements of the total nuclear genome may result in uneven coverage of the genetic map. Therefore, in addition to genic SNP based GoldenGate genotyping arrays, we used RAD-seq to construct a high-density genetic linkage map. For the precise anchoring of the newly sequenced genome as-sembly, a high genome-wide marker density is necessary. The RAD-seq methodology utilized in this study has ad-vantages over other GBS methods in this regard. The use of EcoRI for RAD-Seq yields a uniform distribution of sequence reads across the genome that enables a greater coverage of the assembly. In contrast, GBS meth-odologies commonly utilized methylation-sensitive re-striction enzymes that cannot cleave the repetitive regions of the genome. This provides not only a targeted coverage of the gene rich regions of the genome but also
potentially missed portions of the assembly. A compari-son of the two methodologies for the purposes of an-choring a genome assembly has been provided recently for Brassica oleracea [65].
High-density genetic map using array-based genic SNPs and RAD tags
This study generated one of the most comprehensive in-traspecific linkage maps of chickpea to date. The map spans 653 cM and is divided into eight linkage groups corresponding to the number of chickpea chromosomes, with average inter-marker distance of 0.5 cM. In com-parison, earlier intraspecific linkage maps [12,66] were sparsely covered with 230 and 408 markers, spanning 740 cM and 752 cM with average inter-marker distance of 3.2 and 2.16 cM, respectively. Several interspecific linkage maps have been developed using second gener-ation sequencing technologies e.g., [11,21]. The most satu-rated chickpea reference genetic linkage map derived from a interspecific cross between ICC 4958 (Cicer arietinum) and PI 489777 (Cicer reticulatum), thus far is comprised
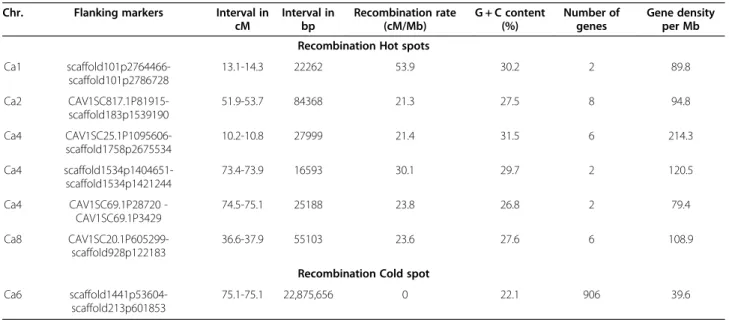
Table 5 Recombination hotspots and cold spot and their genomic composition
Chr. Flanking markers Interval in cM Interval in bp Recombination rate (cM/Mb) G + C content (%) Number of genes Gene density per Mb Recombination Hot spots
Ca1 scaffold101p2764466-scaffold101p2786728 13.1-14.3 22262 53.9 30.2 2 89.8 Ca2 CAV1SC817.1P81915-scaffold183p1539190 51.9-53.7 84368 21.3 27.5 8 94.8 Ca4 CAV1SC25.1P1095606-scaffold1758p2675534 10.2-10.8 27999 21.4 31.5 6 214.3 Ca4 scaffold1534p1404651-scaffold1534p1421244 73.4-73.9 16593 30.1 29.7 2 120.5 Ca4 CAV1SC69.1P28720 -CAV1SC69.1P3429 74.5-75.1 25188 23.8 26.8 2 79.4 Ca8 CAV1SC20.1P605299-scaffold928p122183 36.6-37.9 55103 23.6 27.6 6 108.9
Recombination Cold spot Ca6
scaffold1441p53604-scaffold213p601853
75.1-75.1 22,875,656 0 22.1 906 39.6
Table 4 Summary of the recombination rate on individual LGs and across the chickpea genome
Linkage group Map distance(cM) Distance between first and last marker in LG (Mb) Recombination rate (cM/Mb)
LG1 75.5 46.9 1.6 LG2 71.4 34.3 2.1 LG3 75.1 39.1 1.9 LG4 86.0 47.5 1.8 LG5 87.8 35.3 2.5 LG6 99.5 56.5 1.8 LG7 80.2 46.3 1.7 LG8 77.4 16.1 4.8 Total 652.9 321.9 2.0
of 1,291 markers, spanning 846 cM with an average inter-marker distance of 0.65 cM [20]. The intraspecific CPR-01 linkage map (Figure 6) covers more than 99% of the chick-pea genome and has an inter-marker distance of 0.5 cM, indicating the immense potential of this sequence-based mapping strategy for anchoring and detecting or correct-ing the orientation of scaffolds to the chromosome. The high density genetic maps can also greatly improve the precision of QTL mapping.
Segregation distortion is a common phenomenon in mapping populations which the frequency of genotypes skews from the expected Mendelian ratio [67]. In the CPR-01 mapping population, 468 (35.0%) of the mapped markers showed segregation distortion and the markers were retained in the map. Most of these distorted loci corresponded to regions already reported as prone to segregation distortion in previous studies [66,68-70]. In CPR-01, the majority of markers 325 (75%) located on LG4 showed distorted segregation toward the maternal parent ICCV 96029. Earlier reported studies using F2
and RIL mapping populations also observed several dis-tortion regions on LG4 [71]. However, in this study with a high-density linkage map we were able to plot the loca-tion of SDLs with a high degree of precision. LG4 contains several QTLs for important agronomical traits [9,72,73].
Genome wide recombination rate in chickpea
The recombination rate varies by an order of magnitude among species and between individuals [74,75]. Several studies have been conducted to attempt to understand the factors involved in genetic recombination rates and sequence features that may correlate with this variability. In many eukaryotic species, a positive correlation be-tween GC content and recombination rate was observed [74]. It was also observed that, the gene rich regions of wheat, barley, and maize, are more recombinationally ac-tive than gene-poor regions [76,77]. However, in the current study we found no relationship between recom-bination frequency and GC content (Table 5). The aver-age GC content of all identified recombination hot spots (29.2%) was similar to the overall GC content of the chickpea genome (30.8%). Though, all the identified re-combination hot spots showed higher gene density than the recombination cold spots and the gene density across the genome. Similar observations were also re-ported in rice and wheat [78,79]. On the other hand, a weak negative or lack of correlation between gene dens-ity and recombination rates has also been reported in Arabidopsis [77,80]. The comparison between genetic and physical distances has provided initial ‘landscape’ in-formation about the recombination rate and variation in the CPR-01 population. The recombination rates calcu-lated for CPR-01 do not necessarily apply to the other chickpea population as the recombination rate varies
substantially between different crosses and could reveal different general and location-specific levels of recom-bination [30]. However, understanding the detailed land-scape of recombination could provide information for marker-assisted selection strategies for specific traits in chickpea. Further experiments with analyses in different genetic backgrounds are needed to confirm the strength and the precise location of these hot spots.
Genome wide comparison between genetic map and the chickpea genome sequence
Alignment of the CPR-01 map with the chickpea pseudo-chromosomes indicated overall high co-linearity between the genetic and the physical order. However, the alignment also showed some inconsistency in localized order on Ca1, Ca5, Ca6, Ca7 and Ca8. This could be due to the incorpor-ation of small scaffolds and/or too little recombinincorpor-ation to allow exact placement or correct orientations of scaffolds during the chickpea genome assembly. Another possible reason of marker order inconsistency could be due to the utilization of an interspecific genetic map generated by using a cross between Cicer arietinum X Cicer reticulatum for the genetic anchoring of the chickpea pseodochromo-somes (Cicer_arietinum_GA_v1.0). In spite of substantial morphological similarities and crossability between C. arietinum and C. reticulatum, some chromosomal rear-rangements such as reciprocal translocation, a paracentric inversion or location of chromosomal satellites have been reported [81]. Also, comparative mapping of C. arietinum X C. reticulatum genetic map using common SSR markers also detected a few inversions in marker order possibly due to inversion of DNA sequences and minor chromo-somal translocation [66,82]. Therefore the observed marker order inconsistency in our analysis could poten-tially represent the reported chromosomal rearrangement between C. arietinum and C. reticulatum. Further analysis is needed to test this hypothesis.
NGS has dramatically increased the rate of the com-pletion of new genome sequences across different spe-cies. Most of the recently released plant genomes were sequenced using NGS platforms see “The First 50 Plant Genomes” review by [83]. Sequencing and genome as-sembly using NGS is a challenging task, especially for large eukaryotic genomes [84,85]. In order to improve these reference genome sequences, they need to undergo quality improvement to repair the assembly errors, as has been undertaken in the maize, Brassica and Arabi-dopsis genomes. With the availability of low cost geno-typing technologies, many high density alternative reference genetic maps have been generated and detailed comparisons of genetic maps and genome sequences have been conducted. These multiple reference genetic maps have all revealed some degree of physical assembly error and missing fragments in the reference genomes
[24,86]. With the high density chickpea genetic map generated in this study, it is now possible to locate gen-omic regions which less accurately placed using the earl-ier genetic map used in the chickpea genome assembly. Similarly, this high density map allows independent checking and validation of the current chickpea genome assembly. For example some of the major inversions on Ca5 and Ca8 can potentially be corrected using the current high density CPR-01 genetic map.
Conclusion
This study generated a high-density intraspecific linkage map of chickpea using genic SNP based genotyping assay and RAD-seq GBS. The map allowed addressing some issues with marker alignment in the corresponding chromosome and inconsistency in marker order within the physical map. The high-density CPR-01 map helped in assigning large number of previously unplaced scaf-folds from the version 1.0 of the CDC Frontier draft genome sequence. The alignment analysis also revealed the varying degrees of recombination rates and hotspots across the chickpea genome. On average the estimated genome-wide recombination rate in the current popula-tion is 2.0 cM/Mb ranging from 1.6 to 4.8 cM/Mb per chromosome.
The CPR-01 is one of the key genetic materials derived from an intraspecific cross segregating for some import-ant agronomic traits in chickpea, such as photoperiod sensitivity, ascochyta blight resistance and double pod-ding. Therefore the high-density CPR-01 map will help to precisely map and estimate the effects of quantitative trait loci for these traits. Furthermore, the information on the genome wide recombination rates in CPR-01 may provide the basis for designing effective marker-assisted selection strategies.
Availability of supporting data
The data sets supporting the results of this article are in-cluded within the article as additional files.
Data availability
Sequence data under the study has been deposited into NCBI Sequence Read Archive (http://www.ncbi.nlm.nih. gov/sra) accessions SRP044343 and SRP044316.
Additional files
Additional file 1: SNP data including list of high quality SNPs, reference base, alternate base, allele frequency and flanking 60 bp nucleotide sequences.
Additional file 2: List of Identified SSR, providing details on SSR motifs, primer sequences, expected PCR product size and in silico Polymorphism survey in eight chickpea genotypes.
Additional file 3: List of SNPs selected for KASP assays, and the results of these assays on a panel of 8 chickpea lines.
Competing interests
The authors declare that they have no competing interests. Authors’ contributions
Conceived, designed and managed the experiments: AAD, LR, AGS, MD, AS, KB, TDW and BT. Performed the laboratory experiments: AAD, AS and MD. Analyzed the data: AAD and LR. Wrote the manuscript: AAD and BT. All authors read and approved the final manuscript.
Acknowledgments
The authors wish to thank Rob Stonehouse, Janet Condie and Lacey Sanderson for technical assistance with GoldenGate assays and Dr. I Parkin of AAFC Saskatoon for access to the Illumina HiScan instrument. This work was supported by grants from the Saskatchewan Pulse Growers and the Agriculture Development Fund from the Government of Saskatchewan, Canada.
Author details
1Crop Development Centre, Department of Plant Sciences, University of
Saskatchewan, 51 Campus Dr, Saskatoon, SK S7N 5A8, Canada.2National
Research Council Canada, 110 Gymnasium Place, Saskatoon, SK S7N 0 W9, Canada.
Received: 25 March 2014 Accepted: 31 July 2014 Published: 23 August 2014
References
1. FAOSTAT: FAO Statistical databases. Rome: Food and Agriculture Organization (FAO) of the United Nations; 2011. http://faostat.fao.org/site/ 339/default.aspx.
2. Clarke H, Siddique K: Response of chickpea genotypes to low
temperature stress during reproductive development. Field Crop Res 2004, 90(2):323–334.
3. Pande S, Siddique K, Kishore G, Bayaa B, Gaur P, Gowda C, Bretag T, Crouch J: Ascochyta blight of chickpea (Cicer arietinum L.): a review of biology, pathogenicity, and disease management. Crop Pasture Sci 2005, 56(4):317–332.
4. Anbessa Y, Warkentin T, Vandenberg A, Ball R: Inheritance of time to flowering in chickpea in a short-season temperate environment. J Hered 2006, 97(1):55–61.
5. Millan T, Clarke HJ, Siddique KH, Buhariwalla HK, Gaur PM, Kumar J, Gil J, Kahl G, Winter P: Chickpea molecular breeding: new tools and concepts. Euphytica 2006, 147(1–2):81–103.
6. Varshney RK, Ribaut J-M, Buckler ES, Tuberosa R, Rafalski JA, Langridge P: Can genomics boost productivity of orphan crops? Nat Biotechnol 2012, 30(12):1172–1176.
7. Massman JM, Jung H-JG, Bernardo R: Genomewide selection versus marker-assisted recurrent selection to improve grain yield and stover-quality traits for cellulosic ethanol in maize. Crop Science 2013, 53(1):58–66.
8. Upadhyaya HD, Thudi M, Dronavalli N, Gujaria N, Singh S, Sharma S, Varshney RK: Genomic tools and germplasm diversity for chickpea improvement. Plant Genet Resour 2011, 9(1):45.
9. Tar'an B, Warkentin T, Tullu A, Vandenberg A: Genetic mapping of ascochyta blight resistance in chickpea (Cicer arietinum L.) using a simple sequence repeat linkage map. Genome 2007, 50(1):26–34. 10. Millan T, Winter P, Jüngling R, Gil J, Rubio J, Cho S, Cobos M, Iruela M,
Rajesh P, Tekeoglu M: A consensus genetic map of chickpea (Cicer arietinum L.) based on 10 mapping populations. Euphytica 2010, 175(2):175–189.
11. Gaur R, Azam S, Jeena G, Khan AW, Choudhary S, Jain M, Yadav G, Tyagi AK, Chattopadhyay D, Bhatia S: High-throughput SNP discovery and genotyping for constructing a saturated linkage map of chickpea (Cicer arietinum L.). DNA Res 2012, 19(5):357–373.
12. Stephens A, Lombardi M, Cogan NO, Forster JW, Hobson K, Materne M, Kaur S: Genetic marker discovery, intraspecific linkage map construction and
quantitative trait locus analysis of ascochyta blight resistance in chickpea (Cicer arietinum L.). Mol Breed 2014, 33(2):297–313. 13. Kudapa H, Azam S, Sharpe AG, Taran B, Li R, Deonovic B, Cameron C,
Farmer AD, Cannon SB, Varshney RK: Comprehensive Transcriptome Assembly of Chickpea (Cicer arietinum L.) Using Sanger and Next Generation Sequencing Platforms: Development and Applications. PloS One 2014, 9(1):e86039.
14. Shendure J, Ji H: Next-generation DNA sequencing. Nat Biotechnol 2008, 26(10):1135–1145.
15. Kwok PY: Methods for genotyping single nucleotide polymorphisms. Annu Rev Genom Hum Genet 2001, 2(1):235–258.
16. Külheim C, Yeoh SH, Maintz J, Foley W, Moran G: Comparative SNP diversity among four Eucalyptus species for genes from secondary metabolite biosynthetic pathways. BMC Genom 2009, 10(1):452. 17. Labate JA, Baldo AM: Tomato SNP discovery by EST mining and
resequencing. Mol Breed 2005, 16(4):343–349.
18. Gujaria N, Kumar A, Dauthal P, Dubey A, Hiremath P, Prakash AB, Farmer A, Bhide M, Shah T, Gaur PM: Development and use of genic molecular markers (GMMs) for construction of a transcript map of chickpea (Cicer arietinum L.). Theor Appl Genet 2011, 122(8):1577–1589. 19. Jhanwar S, Priya P, Garg R, Parida SK, Tyagi AK, Jain M: Transcriptome
sequencing of wild chickpea as a rich resource for marker development. Plant Biotechnol J 2012, 10(6):690–702.
20. Thudi M, Bohra A, Nayak SN, Varghese N, Shah TM, Penmetsa RV, Thirunavukkarasu N, Gudipati S, Gaur PM, Kulwal PL: Novel SSR markers from BAC-end sequences, DArT arrays and a comprehensive genetic map with 1,291 marker loci for chickpea (Cicer arietinum L.). PloS One 2011, 6(11):e27275.
21. Hiremath PJ, Kumar A, Penmetsa RV, Farmer A, Schlueter JA, Chamarthi SK, Whaley AM, Carrasquilla‐Garcia N, Gaur PM, Upadhyaya HD: Large‐scale development of cost‐effective SNP marker assays for diversity assessment and genetic mapping in chickpea and comparative mapping in legumes. Plant Biotechnol J 2012, 10(6):716–732.
22. Hyten DL, Song Q, Choi IY, Yoon MS, Specht JE, Matukumalli LK, Nelson RL, Shoemaker RC, Young ND, Cregan PB: High-throughput genotyping with the GoldenGate assay in the complex genome of soybean. Theor Appl Genet 2008, 116(7):945–952.
23. Akhunov E, Nicolet C, Dvorak J: Single nucleotide polymorphism genotyping in polyploid wheat with the Illumina GoldenGate assay. Theor Appl Genet 2009, 119(3):507–517.
24. Ganal MW, Durstewitz G, Polley A, Berard A, Buckler ES, Charcosset A, Clarke JD, Graner E-M, Hansen M, Joets J: A large maize (Zea mays L.) SNP genotyping array: development and germplasm genotyping, and genetic mapping to compare with the B73 reference genome. PloS One 2011, 6(12):e28334.
25. Parida SK, Mukerji M, Singh AK, Singh NK, Mohapatra T: SNPs in stress-responsive rice genes: validation, genotyping, functional relevance and population structure. BMC Genomics 2012, 13(1):426.
26. Bachlava E, Taylor CA, Tang S, Bowers JE, Mandel JR, Burke JM, Knapp SJ: SNP discovery and development of a high-density genotyping array for sunflower. PloS One 2012, 7(1):e29814.
27. Sharpe AG, Ramsay L, Sanderson L-A, Fedoruk MJ, Clarke WE, Li R, Kagale S, Vijayan P, Vandenberg A, Bett KE: Ancient orphan crop joins modern era: gene-based SNP discovery and mapping in lentil. BMC Genomics 2013, 14(1):192.
28. Hyten DL, Cannon SB, Song Q, Weeks N, Fickus EW, Shoemaker RC, Specht JE, Farmer AD, May GD, Cregan PB: High-throughput SNP discovery through deep resequencing of a reduced representation library to anchor and orient scaffolds in the soybean whole genome sequence. BMC Genomics 2010, 11(1):38.
29. Antanaviciute L, Fernández-Fernández F, Jansen J, Banchi E, Evans KM, Viola R, Velasco R, Dunwell JM, Troggio M, Sargent DJ: Development of a dense SNP-based linkage map of an apple rootstock progeny using the Malus Infinium whole genome genotyping array. BMC Genomics 2012, 13(1):203. 30. Sim S-C, Van Deynze A, Stoffel K, Douches DS, Zarka D, Ganal MW, Chetelat
RT, Hutton SF, Scott JW, Gardner RG: High-density SNP genotyping of tomato (Solanum lycopersicum L.) reveals patterns of genetic variation due to breeding. PloS One 2012, 7(9):e45520.
31. Elshire RJ, Glaubitz JC, Sun Q, Poland JA, Kawamoto K, Buckler ES, Mitchell SE: A robust, simple genotyping-by-sequencing (GBS) approach for high diversity species. PloS One 2011, 6(5):e19379.
32. van Orsouw NJ, Hogers RC, Janssen A, Yalcin F, Snoeijers S, Verstege E, Schneiders H, van der Poel H, van Oeveren J, Verstegen H: Complexity reduction of polymorphic sequences (CRoPS™): a novel approach for large-scale polymorphism discovery in complex genomes. PloS One 2007, 2(11):e1172. 33. Baird NA, Etter PD, Atwood TS, Currey MC, Shiver AL, Lewis ZA, Selker EU,
Cresko WA, Johnson EA: Rapid SNP discovery and genetic mapping using sequenced RAD markers. PloS One 2008, 3(10):e3376.
34. Chutimanitsakun Y, Nipper RW, Cuesta-Marcos A, Cistué L, Corey A, Filichkina T, Johnson EA, Hayes PM: Construction and application for QTL analysis of a Restriction Site Associated DNA (RAD) linkage map in barley. BMC Genomics 2011, 12(1):4.
35. Morris GP, Ramu P, Deshpande SP, Hash CT, Shah T, Upadhyaya HD, Riera-Lizarazu O, Brown PJ, Acharya CB, Mitchell SE: Population genomic and genome-wide association studies of agroclimatic traits in sorghum. Proc Natl Acad Sci 2013, 110(2):453–458.
36. Varshney RK, Song C, Saxena RK, Azam S, Yu S, Sharpe AG, Cannon S, Baek J, Rosen BD, Tar'an B: Draft genome sequence of chickpea (Cicer arietinum) provides a resource for trait improvement. Nat Biotechnol 2013, 31(3):240–246.
37. Jain M, Misra G, Patel RK, Priya P, Jhanwar S, Khan AW, Shah N, Singh VK, Garg R, Jeena G, Yadav M, Kant C, Sharma P, Yadav G, Bhatia S, Tyagi AK, Chattopadhyay D: A draft genome sequence of the pulse crop chickpea (Cicer arietinum L.). Plant J 2013, 74(5):715–729.
38. Thudi M, Li Y, Jackson SA, May GD, Varshney RK: Current state-of-art of sequencing technologies for plant genomics research. Brief Funct Genomics 2012, 11(1):3–11.
39. Warkentin T, Banniza S, Vandenberg A: CDC Frontier kabuli chickpea. Can J Plant Sci 2005, 85(4):909–910.
40. Eveland AL, McCarty DR, Koch KE: Transcript profiling by 3′-untranslated region sequencing resolves expression of gene families. Plant Physiol 2008, 146(1):32–44.
41. Parkin IA, Clarke WE, Sidebottom C, Zhang W, Robinson SJ, Links MG, Karcz S, Higgins EE, Fobert P, Sharpe AG: Towards unambiguous transcript mapping in the allotetraploid Brassica napus. Genome 2010, 53(11):929–938.
42. Margulies M, Egholm M, Altman WE, Attiya S, Bader JS, Bemben LA, Berka J, Braverman MS, Chen Y-J, Chen Z: Genome sequencing in microfabricated high-density picolitre reactors. Nature 2005, 437(7057):376–380. 43. Wu TD, Watanabe CK: GMAP: a genomic mapping and alignment
program for mRNA and EST sequences. Bioinformatics 2005, 21(9):1859–1875.
44. Conesa A, Gotz S, Garcia-Gomez JM, Terol J, Talon M, Robles M: Blast2GO: a universal tool for annotation, visualization and analysis in functional genomics research. Bioinformatics 2005, 21(18):3674–3676.
45. Moriya Y, Itoh M, Okuda S, Yoshizawa AC, Kanehisa M: KAAS: an automatic genome annotation and pathway reconstruction server. Nucleic Acids Res 2007, 35(suppl 2):W182–W185.
46. Cingolani P, Platts A, Coon M, Nguyen T, Wang L, Land SJ, Lu X, Ruden DM: A program for annotating and predicting the effects of single nucleotide polymorphisms, SnpEff: SNPs in the genome of Drosophila melanogaster strain w1118; iso-2; iso-3. Fly 2012, 6(2):80–92.
47. Meglecz E, Costedoat C, Dubut V, Gilles A, Malausa T, Pech N, Martin JF: QDD: a user-friendly program to select microsatellite markers and design primers from large sequencing projects. Bioinformatics 2010, 26(3):403–404. 48. Wong MM, Cannon CH, Wickneswari R: Development of high-throughput
SNP-based genotyping in Acacia auriculiformis x A. mangium hybrids using short-read transcriptome data. BMC Genomics 2012, 13:726. 49. Saghai-Maroof M, Soliman K, Jorgensen RA, Allard R: Ribosomal DNA
spacer-length polymorphisms in barley: Mendelian inheritance, chromosomal location, and population dynamics. Proc Natl Acad Sci 1984, 81(24):8014–8018.
50. Langmead B, Trapnell C, Pop M, Salzberg SL: Ultrafast and memory-efficient alignment of short DNA sequences to the human genome. Genome Biol 2009, 10(3):R25.
51. Li H, Handsaker B, Wysoker A, Fennell T, Ruan J, Homer N, Marth G, Abecasis G, Durbin R: The sequence alignment/map format and SAMtools. Bioinformatics 2009, 25(16):2078–2079.
52. Kozik A: MadMapper. Available at http://cgpdb.ucdavis.edu/XLinkage/MadMapper/ 2006:Accessed 30 Nov. 2013.
53. Van Os H, Stam P, Visser RG, Van Eck HJ: RECORD: a novel method for ordering loci on a genetic linkage map. Theor Appl Genet 2005, 112(1):30–40.