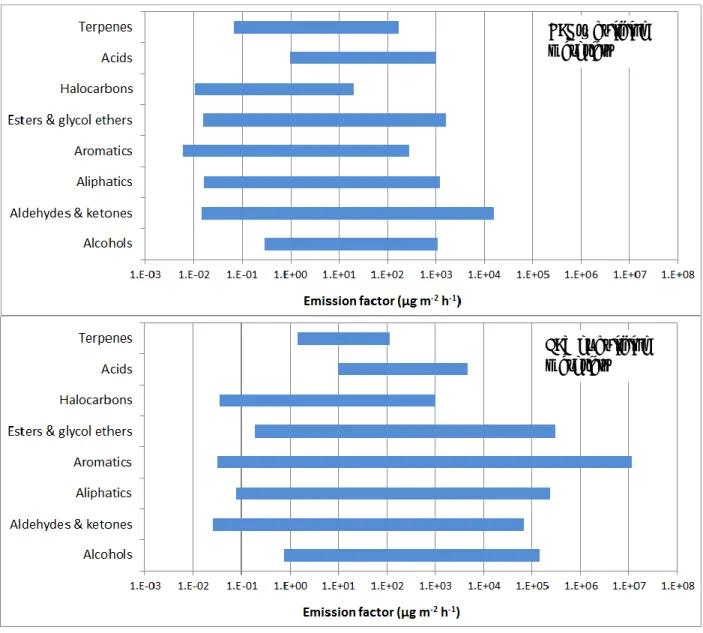
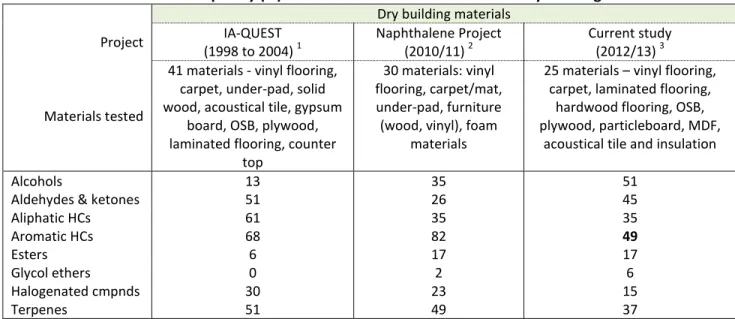
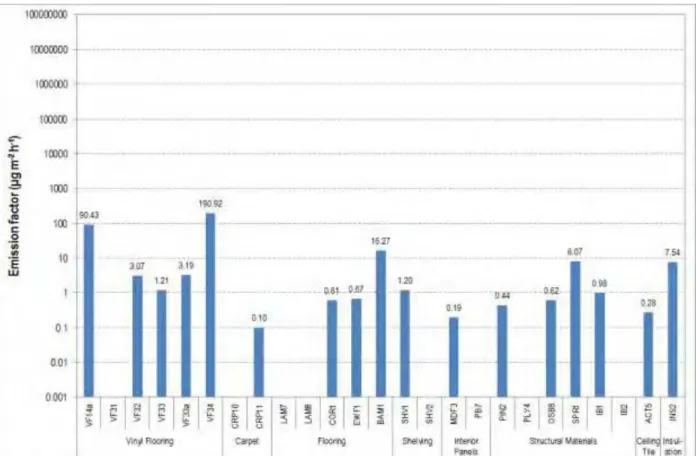
Material emissions data: 52 building materials tested for 124 compounds
300
0
0
Texte intégral
(2)
(3)
(4)
(5)
(6)
(7)
(8)
(9)
(10)
(11)
(12)
(13)
(14)
(15)
(16)
(17)
(18)
(19)
(20)
(21)
(22)
(23)
(24)
(26)
(27)
Figure


+7

Documents relatifs
Further improvements will be made to the ECCAD database in the forthcoming months, such as the inclusion of non-gridded data and the development of tools to compare gridded and
Les résultats de cette deuxième étude expérimentale indiquent que lorsque les milieux nutritifs sont considérés comme non infinis en Ca (limitants ou non limitants
On-road traffic emissions of polycyclic aromatic hydrocarbons and their oxy- and nitro- derivative compounds measured in road tunnel environments..
The spatial distribution of the surface emissions was studied with a static flux chamber and a funnel, in order to do a preliminary quick survey of methane and sulphur compounds
- (Ouais, cette femme est superbe, elle est pour moi. Je veux la conquérir dès ce soir! Et Dieu sait que j'en ai rencontré des demoiselles, mais là j'ai un sérieux béguin, pour une
- Some recent chemical and physical results obtained on organic conductors derived from Tetramethyltetraselenafulvalene (TMTSF) and Hexamethylenetetraselenafulvalene (HMTSF)
Also recent experimental work on alloying effects in CeFe2 [3, 9-14] strongly suggest a crucial role for Ce in the magnetic properties of CeFe2 and its
What is the expected impact of climate change on wine aroma compounds and their precursors in grape?
We also report some results associated with the incidence of grape growing conditions on white and red wine aging potential and on the composition of old wines.. Finally, we discuss
