Association of Adverse Cardiovascular Outcomes
with Weighted Morphologic Variability
following Non-ST-Elevation Acute Coronary Syndromes
byJoyatee Mudra Sarker
S.B., Massachusetts Institute of Technology (2009)
Submitted to the Department of Electrical Engineering and Computer Science in partial fulfillment of the requirements for the degree of
Master of Engineering in Electrical Engineering and Computer Science
ARCHIVES
at the MASSACHUSETTS INSTITUTE
OF TECHNOLOGY
MASSACHUSETTS INSTITUTE OF TECHNOLOGY
AUG 242010
May 2010
C 2010 Massachusetts Institute of Technology. All rights reserved. L SARIES
A uthor ...
Department of Electrifl Eyfginee g d Computer Science May 21, 2010 (\f\
Certified by ... ...
--...
. .t. .
.. . ..
...--.---.--.
Collin M. Stultz Associate Professor of Electrical Engineering and Computer Science and Health Sciences Technology Thesis SupervisorA ccepted by ... ...
\
K)
Dr. Christopher J. TermanAssociation of Adverse Cardiovascular Outcomes
with Weighted Morphologic Variability
following Non-ST-Elevation Acute Coronary Syndromes
byJoyatee Mudra Sarker
Submitted to the Department of Electrical Engineering and Computer Science on May 21, 2010
In Partial Fulfillment of the Requirements for the Degree of Master of Engineering in Electrical Engineering and Computer Science
ABSTRACT
Patients who have had an acute coronary syndrome (ACS) are at a relatively high risk of having subsequent adverse cardiac events. Several electrocardiographic (ECG) measures such as heart rate variability, heart rate turbulence, deceleration capacity, T-wave altemans, and
morphologic variability have been used to identify patients at an increased risk of recurrent myocardial infarctions and cardiovascular death.
In this work, we develop a new ECG-based measure for patient risk stratification called weighted morphologic variability. This measure is based on assessment of beat-to-beat changes in the morphology of consecutive beats. Weighted morphologic variability identifies patients who are at more than four-fold risk for cardiovascular death, which is an improvement in ECG-based risk stratification. The body of this work suggests that prognosticating patients ECG-based on electrocardiographic measures is an effective way of identifying those at risk of adverse cardiovascular outcomes.
Thesis Supervisor: Collin M. Stultz
Title: Associate Professor of Electrical Engineering and Computer Science and Health Sciences Technology
ACKNOWLEDGEMENTS
Above all, I would like to thank Collin for all of the support, advice, and encouragement he has given me through these years. With no irony intended (okay, maybe a little), Collin has the biggest heart of any advisor I have known. He has been such a great listener and his willingness to meet immediately at the drop of a call shows his dedication to his work. I have learned tremendously working with Collin, and I hope to one day be as great of a person as he is.
I would also like to thank Dr. John Guttag and his students for all of their ideas and suggestions. John has a remarkable brain, and it was wonderful to have weekly conversations with him. Thank you to Zeeshan Syed and Phil Sung for laying out the groundwork and
answering frantic emails in the beginning. I also want to thank Jenna Wiens and Anima Singh for their input on this body of work.
I would like to thank the soul of the lab, my lab mates. To Dr. Sophie Walker, Dr. Ramon Salsas-Escat, Dr. Paul Nerenberg, Dr. Christine Philips, and the to-be doctors Charles Fischer, Orly Ullman, and Elaine Gee: I thank you for all of the fun and help over the year. A special thanks to Veena Venkataraman and Chelsea Ostrander for their contributions to the project.
Minah Shahbaz, Tia Cartisano, and Carlos Amaya-thank you for putting up with me through my crazies.
Finally, I would like to thank my parents, Bhaba and Lopa, for all of their love, patience, and support. Their own perseverance has inspired me to come this far. To Aneek: thanks for grounding me, and, yes, I will always spoil you.
CONTENTS
A BSTRA CT... 3
A CKN OW LED GEM EN TS... 5
Chapter I: IN TRODU CTION ... 13
A. Background ... 15
1. Physiology of the H eart ... 15
2. Electrocardiograms... 15
B. Risk Stratification M easures ... 18
1. Non ECG-Based Risk-Stratification M easures ... 18
2. Electrocardiographic Risk-Stratification M easures ... 19
Chapter II: M ORPH OLO GIC V A RIA BILITY ... 25
A. Patient Population ... 25
B. Dynam ic Time W arping ... 26
C. M orphologic D istance ... 29
D . M orphologic Variability ... 30
E. Receiver Operating Characteristic ... 31
Chapter III: WEIGHTED MORPHOLOGIC VARIABILITY... 33
A. W eighted M orphologic Variability ... 33
1. WM V with 3 Frequency Bands ... 36 7
2. W M V with 600 Frequency Bands... 37
B. Sim ulated Annealing ... 38
1. Choice of Initial Temperature ... 39
2. Choice of Tem perature D ecrem ent Function... 40
3. N um ber of Perturbations at Each Tem perature... 41
4. Stop Criterion ... 42
Chapter IV: EVALUATION OF WEIGHTED MORPHOLOGIC VARIABILITY ... 45
A. D eterm ining Cutoffs for H igh and Low Risk ... 45
1. Cutoffs Using Q uartile Values ... 46
2. Cutoffs Using H azard Ratios... 47
3. Cutoffs Using Sensitivity and Specificity ... 48
B. Cross-Validation ... 50
C. Risk Stratifying Cardiovascular D eath ... 52
D . Risk Stratifying M yocardial Infarction ... 55
Chapter V : SU M M A RY AN D CON CLU SION S... 59
A. Sum m ary ... 59
B. Physiological Basis ... 61
C. Conclusions... 62
LIST OF FIGURES
Figure I-1. Physiology of the heart. ... 16
Figure 1-2. Electrophysiology of the heart. ... 17
Figure 1-3. RR interval discretization for heart rate turbulence... 21
Figure 1-4. Heart rate turbulence calculation... 22
Figure 1-5. RR interval discretization for deceleration capacity. ... 23
Figure II- 1. Alignment of heart beats using dynamic time warping. ... 27
Figure 11-2. M D tim e series... 29
Figure 11-3. Heat map of morphologic variability. ... 32
Figure IV-1. Receiver operating characteristic curve for WMV and cardiovascular death. ... 49
Figure IV-2. Weights for various frequencies in WMV risk stratification of cardiovascular death. . ... ... 5 3 Figure IV-3. Kaplan Meier hazard curves for MERLIN and DISPERSE populations using WMV > 1.3 5 6... 54 Figure IV-4. Weights for various frequencies in WMV risk stratification of myocardial infarction.
... 5 5 Figure IV-5. Kaplan Meier hazard curves for MERLIN and DISPERSE populations using WMV
LIST OF TABLES
Table 111- 1. C-statistics
from
weighting various MV values... 37 Table IV- 1. Hazard ratio, sensitivity, and specificity using quartile cutofffor cardiovasculard ea th ... 4 7 Table IV-2. Hazard ratio, sensitivity, and specificity using maximum hazard ratio cutofffor
cardiovascular death. ... 48 Table IV-3. Hazard ratio, sensitivity, and specificity using maximum sensitivity and specificity
cutofiffor cardiovascular death... 49
Table IV-4. Hazard ratio, sensitivity, and specificity using maximum sensitivity and specificity
cutoiffor myocardial infarction... 49 Table IV-5. Cross-validation hazard ratios using WMV to risk stratify for cardiovascular death.
... 5 1 Table IV-6. Cross-validation hazard ratios using WMV to risk stratify for myocardial infarction.
... 5 1 Table IV-7. Hazard ratio for risk stratification measures of cardiovascular death on MERLIN
and D ISPERSE patients. ... 53 Table IV-8. Hazard ratio for risk stratification measures of myocardial infarction on MERLIN
Chapter I:
INTRODUCTION
Approximately 3.5 million people in the United States are hospitalized every year due to an acute coronary syndrome [1]. An acute coronary syndrome (ACS) is a broad term that describes clinical events characterized, in part, by myocardial ischemia, which is characterized by decreased blood flow to the heart. Patients with an ACS often enter the hospital complaining of chest discomfort that may be accompanied with shortness of breath. ACS can be grouped into two categories: unstable angina and myocardial infarction (MI). Unstable angina is due to
ischemia without evidence of infarction, or death of the heart muscle (myocardium). A myocardial infarction, more commonly referred to as a heart attack, is the condition when
ischemia leads to death of the myocardium.
Patients who are diagnosed with an ACS are more likely to have other adverse
cardiovascular events. The GUSTO-Ib trial followed 12,142 patients post-ACS to determine the effects of recurrent ischemia [2]. Patients with a non-ST segment elevation MI (NSTEMI) had a 5.7% 30-day mortality rate and an 11.1% 1-year mortality rate. Patients with an unstable angina had a 2.4% 30-day mortality rate and a 7.0% 1-year mortality rate. 7.5% of NSTEMI patients and 4.8% of unstable angina patients had a myocardial (re)infarction within 30 days. Post-ACS patients are also likely to have congestive heart failure (CHF), a disease in which failure of the heart to adequately pump blood to vital organs leads to increased pressure in the pulmonary vasculature. The increased pulmonary vasculature pressure results in shortness of breath. The accurate identification of high risk patients is of importance because once these patients are
detected, doctors can offer them treatments that may decrease their risk of future adverse outcomes.
Typically, an acute coronary syndrome (ACS) is caused by atherosclerosis, a potentially dangerous disease characterized by the accumulation of plaques in blood vessels. Atherosclerosis is very common-nearly all adults have some plaque amassment in their blood vessels [3]. However, not everyone is aggressively treated for atherosclerosis because they are not at high risk of adverse cardiovascular outcomes. Patients may be at high risk due to hereditary factors or their lifestyle choices. The extent of an ACS may also vary widely. Therefore, doctors are keen on understanding the likelihood and type of adverse cardiovascular event that a post-ACS patient may have.
Currently, there are several techniques that are used to predict adverse cardiovascular outcomes. The Thrombolysis in Myocardial Infarction (TIMI) risk score is computed from various clinical factors observed at the initial admission of a patient. Cardiac catheterization is a helpful invasive test; however, indiscriminate use on all patients may lead to unnecessary
complications on patients who are at low-risk. Many non-invasive tests are used to risk stratify patients, such as echocardiography, cardiac magnetic resonance imaging (MRI), and cardiac x-ray computed tomography (CT), but these are expensive and not readily available in many communities. In contrast, electrocardiographic (ECG) -based measures are inexpensive, non-invasive, and are easily obtained. We propose the use of a novel ECG-based metric to predict adverse cardiovascular outcomes in post-ACS patients.
This thesis is organized as follows: the remainder of this chapter is devoted to
background information on electrocardiograms and other risk-stratification techniques. Chapter 2 describes a specific electrocardiographic technique in detail, called morphologic variability
(MV). Chapter 3 explains the novel electrocardiographic risk-stratification technique called weighted morphologic variability (WMV) in association with mortality and myocardial infarctions. Chapter 4 evaluates the performance of WMV. Finally, chapter 5 ends with a summary of WMV with a hypothesis about its physiological basis.
A. Background
1. Physiology of the Heart
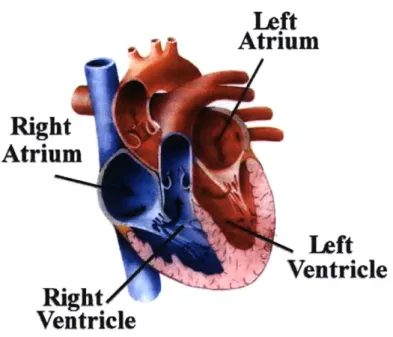
The heart is a pump that transports blood, carrying essential nutrients and oxygen, throughout the body. The heart consists of four chambers: the left and right upper atria, and the left and right lower ventricles (Figure 1-1). The left atrium collects oxygenated blood from the lungs and delivers it to the left ventricle. The left ventricle then pumps this oxygenated blood to the rest of the body. After blood has been dispersed through the body, and oxygen and nutrients have been taken up, the deoxygenated blood flows into the right atrium. The right atrium delivers this blood to the right ventricle, which pumps the blood to the lungs to be oxygenated. A full heart beat consists of a simultaneous contraction of the atria, followed by a simultaneous contraction of the ventricles.
2. Electrocardiograms
Electrocardiograms (ECGs) measure surface electrochemical potential differences that result from signals that originate in the heart (Figure I-2a). Portable Holter monitors can collect ECGs from patients for at least 24 hours. Between 3 to 12 leads are placed in various locations
on the body to measure surface potential differences arising from the heart. Many
electrocardiographic risk stratification metrics only require information from a single channel 15
(consisting of three leads) to predict a patient's cardiovascular health. The work in this thesis is developed on the information from a single channel.
lft
Atrium
Right
Atrium
Ieft
f7Ve
ntricle4a
Right
Ventricle
Figure I-1. Physiology of the heart. The heart has four chambers: the left and right atria, and left and right ventricles. Image courtesy of Hartzog [4].
At rest, a myocardial cell, or myocyte, remains at a negative potential relative to the outside of the cell. If the myocyte is stimulated, it becomes depolarized as positive ions flow into the cell. The cell then repolarizes and returns to its normal, resting state. In the heart, the
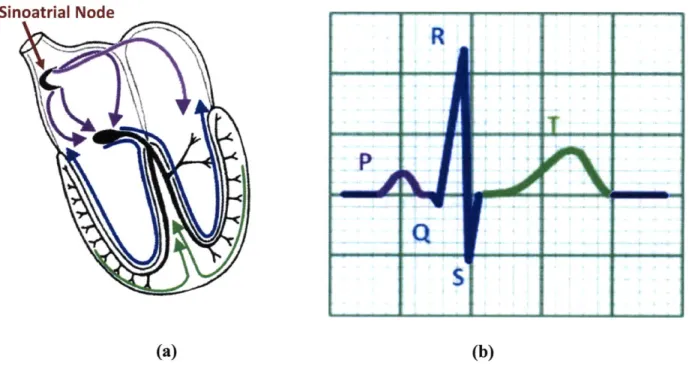
electrical stimulation begins at the sinoatrial node (Figure I-2a). This stimulation spreads through the atria, then through the septum that separates the two ventricles, and finally along the outer sides of the ventricles. After the initial electrical stimulation, the myocytes all repolarize in order to return to their resting potential.
An electrocardiogram measures the sum of the potential differences of all of the
myocytes of the heart. Several leads are placed in different locations on the thorax. Each pair of 16
leads records the morphology of the voltage changes along a particular axis in the heart. By analyzing all of the recordings from the leads together, one can determine how the electrical impulse travels through the heart. Physicians typically identify different parts of the conduction path with the names "P wave," "PR segment," "QRS complex," "ST segment," and "T wave" (Figure I-2b). The P wave represents right and left atrial depolarization, the QRS complex represent ventricular depolarization, and the T wave represents ventricular repolarization.
Sinoatrial Node
R
S
(a) (b)
Figure 1-2. Electrophysiology of the heart. Figure I-2a depicts the electrical impulses travelling through the heart, and Figure I-2b shows the corresponding ECG signal recorded. Images
courtesy of Lemkin [5].
B. Risk Stratification Measures
Various techniques are used to risk stratify patients for adverse cardiovascular outcomes. The following section will describe a few methods in detail. In particular, the TIMI risk score and echocardiograms are used to noninvasively risk-stratify patients. Also, various
electrocardiographic techniques can be used to predict if post-ACS patients will have a future adverse cardiovascular outcome.
1. Non ECG-Based Risk-Stratification Measures
A TIMI risk score was developed to assess a patient's risk of death, recurrent MI, or ischemia, thereby allowing doctors to make better therapeutic decisions. The score is tabulated based on seven independent factors, which are all associated with poor cardiac outcomes: age > 65 years, the presence of at least three risk factors for cardiac heart disease, prior coronary stenosis of> 50%, the presence of ST segment deviation on admission ECG, at least two angina episodes in the prior 24 hours, elevated serum cardiac biomarkers, and the use of aspirin in the prior seven days [6]. While the TIMI risk score is a useful predictor of future cardiac events, some patients who do not have a high risk score may still suffer from cardiovascular events and other patients with a low risk score may have adverse cardiovascular sequelae. Therefore, additional methods for accurate risk stratification are needed.
An echocardiogram is an ultrasound study of the heart, and can reveal information about blockages and blood flow within the heart. Other imaging techniques can provide similar
information. Clinicians often use the left ventricular ejection fraction (LVEF) as a measure of the health of the heart, which can be calculated using an echocardiogram. The LVEF is the fraction of blood in the left ventricle that is pumped out of the heart during systole, when the left
ventricle contracts. Typically, a healthy patient has an LVEF of 55-75% [7]. The Candesartan in Heart failure: Assessment of Reduction in Mortality and morbidity (CHARM) Program found that adverse cardiovascular outcomes were minimal in patients with LVEF higher than 45% [8]. Clinicians typically aggressively treat patients with LVEF lower than 40%.
2. Electrocardiographic Risk-Stratification Measures
Damaged myocardium conducts electrochemical impulses differently than normal myocardium. As a result, the morphology of ECG signals may look very different in diseased hearts. The morphology of the ECG can therefore give insight to the health of the cardiovascular system. By observing the shape of a patient's ECG, physicians can gain insight into the problems a patient may have. Heart rate variability (HRV), deceleration capacity (DC), and T-wave
alternans (TWA)-quantities that are calculated from the ECG-can provide information on the "electrical health" of the heart, thereby identifying patients at potential risk.
Heart rate variability (HRV) is a measure of small differences in the heart rate. Since the heart rate is largely determined by the autonomic nervous system, HRV is an indirect measure of the health of the cardiovascular and autonomic nervous systems. In some people, either the autonomic nervous system does not function properly or the heart does not respond appropriately to the autonomic stimuli. An unhealthy patient's heart rate exhibits relatively small beat-to-beat variations in measured Holter recordings.
HRV is based on an analysis of the RR time series. The RR series is a sequence of times between successive R-waves in an ECG. The NN series (for normal-to-normal) is defined as the RR time series for "normal beats; i.e., beats representing normal conduction through the
myocardium. Time-domain metrics commonly include the SDNN (standard deviation of the NN 19
series) and the SDANN (standard deviation of the mean NN series in a five-minute window). Frequency-domain metrics use the power spectral density (PSD) of the RR interval time series. One frequency metric includes LF/HF, which is the ratio of the power in the low frequency band (0.04 - 0.15 Hz) to the power in the high frequency band (0.15 - 0.40 Hz). The LF/HF ratio is computed for 5-minute windows. Patients with a LF/HF ratio < 0.95 are considered to be at risk
[9]. Frequency-domain metrics correlate well with in-hospital mortality independently of other commonly-used predictors such as left ventricular ejection fraction [10]. Low HRV also
correlated with death within 30 days and death within a year after admission to a hospital for an unstable angina or acute MI [11]. Combined with other risk factors, HRV increases the
predictability of cardiac events [10].
Heart rate turbulence (HRT) is an electrocardiographic measure that is also based on changes in the heart rate. In particular, HRT assesses the response of the heart rate following premature ventricular complexes (PVCs). The premature beat causes less blood than normal to eject from the heart, resulting in a lower blood pressure than expected. The autonomic nervous system maintains homeostasis by increasing the heart rate in order to increase the blood pressure. Usually, the autonomic nervous system over-regulates and the blood pressure increases too much. The heart rate is then decreased in order to bring the blood pressure back to homeostatic levels.
HRT quantifies the heart rate fluctuations with two ECG metrics: the turbulence onset (TO) and the turbulence slope (TS). TO is the percentage change, expressed as a ratio, in the first RR interval after PVC to the last RR interval before PVC, to quantify the increasing heart rate changes. This is shown in (Equation I-1), where RR 1 and RR 2 are the first two normal intervals
following a PVC, and RR -2 and RR -1 are the first two normal intervals preceding a PVC (Figure 1-3, Figure 1-4). (RR1+RR 2)- (RR-2+RR-1) (RR - 2 + RR - 1) (Equation I-1) RR-2 RR-1 RR 1 RR2
Figure 1-3. RR interval discretization for heart rate turbulence. RR -2 and RR -l are the first two normal intervals preceding a PVC and RR 1 and RR 2 are the first two normal intervals following a PVC. Figure adapted from Biocom Technologies [12].
The turbulence slope (TS) measures the slowing of the heart rate as it returns to its baseline value. TS is the maximum regression slope of any five consecutive RR interval values following a PVC (Figure 1-4). A lower slope means the heart takes longer to return to the baseline value, indicating an unhealthy heart or an unhealthy autonomic nervous system.
Patients are scored 0 for normal HRT values, 1 for either an abnormal TS or abnormal TO, and 2 for abnormal TS and TO. Patients who are in the HRT category 2 are more likely to die following a myocardial infarction (MI) [13]. The baroreflex function activates the
parasympathetic nervous system, which lowers blood pressure within the body and is found to correlate with HRT [14].
E
TS
g
TO
-1 1 5 10 15
# of RR interval
Figure 1-4. Heart rate turbulence calculation. Heart rate turbulence (HRT) is calculated by the turbulence onset (TO) metric and the turbulence slope (TS) metric. The PVC is identified as beat
'0'. TO is the ratio between the average of the two RR intervals preceding a PVC to the average of the two RR intervals following a PVC. TS is the maximum regression slope of 5 consecutive RR intervals within the first 15 RR intervals after the PVC. The light blue lines indicate all of the possible regression slopes, and the dark blue line indicates the maximum regression slope. Figure courtesy of Bauer [15].
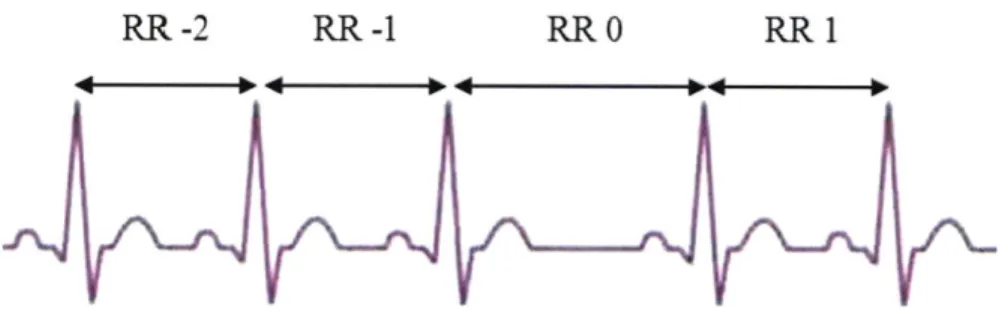
Deceleration capacity (DC) has also been associated with undesired cardiac events [16]. This work has been developed as an extension to the work on HRT, but no PVC is required for the calculations. First, anchors are identified in which one long RR interval follows a shorter RR interval. The anchor is defined as the longer RR interval. The computation for DC is similar to that of TO calculated in HRT. The lengths of the two RR intervals before (RR -2 and RR -1) the anchor, the length of the anchor (RR 0), and the length of the interval after the anchor (RR 1) are recorded (Figure 1-5). The average of all of the lengths of the RR -2 intervals, RR -1 intervals,
RR 0 intervals, and RR 1 intervals are denoted by X[-2], X[-l], X[O], and X[l], respectively. Then, the DC calculation is as follows:
DC = (X[0] + X[1]) - (X[-2] + X[-1])
4
(Equation 1-2) Low DC values were found to be more predictive of mortality than LVEF in post-myocardial infarction patients [16].
RR -2 RR -1 RR 0 RR I
Figure 1-5. RR interval discretization for deceleration capacity. The anchor is the identified as the long RR intervals where one long RR interval precedes a shorter one. RR -2 and RR -l are the first two RR intervals preceding the anchor, RR 0 is the long RR interval anchor, and RR 1 is the first normal interval following the anchor. Figure adapted from Biocom Technologies [12].
Finally, T-wave alternans (TWA) is another ECG-based analytical technique used to risk stratify patients. In some patients, the T-wave varies in magnitude from beat-to-beat, usually alternating between two morphologies. TWA measures these variations. TWA has been associated with ventricular arrhythmias [17] and may be correlated with sudden cardiac death
(SCD) [14]. However, TWA is often difficult to measure from standard ECGs because it operates in the range of microvolts while standard ECG recordings are on a milivolt scale. Therefore, sensitive equipment is required to measure TWA.
23
HRV, HRT, DC, and TWA all correlate with poor outcomes such as death and
ventricular arrhythmias. However, none of these measures are able to identify all patients who are at risk of adverse cardiac events. Therefore, improved risk-stratification measures are still required.
Chapter II:
MORPHOLOGIC VARIABILITY
Morphologic variability (MV) measures the underlying beat-to-beat changes in the shape of an ECG. To calculate the MV of a patient, the ECG first needs to be segmented into the individual beats. Then, an intermediate time series called the morphologic distance (MD) is calculated using a technique called dynamic time warping (DTW) that measures the difference between two successive beats. Finally, the MD is analyzed in the frequency domain to determine the MV value for a patient.
A. Patient Population
The goal of this work is to identify patients who are high risk of cardiovascular death and recurrent myocardial infarction after an ACS. To accomplish this, we developed and tested the WMV method using data from the DISPERSE-2 (TIMI 33) trial and MERLIN (TIMI 36) trial.
The MERLIN trial followed 6560 post-non-ST segment elevation ACS (NSTEACS) patients for a median follow up period of 348 days, and the DISPERSE-2 (TIM133) trial followed 990 post-NSTE ACS patients for 90 days for clinical drug studies [18, 19]. ECG data were sampled at 128 Hz for a portion of those patients, and data with too much noise were discarded.
The ECGs from these patients were pre-processed for calculating MV [20]. Patients with less than 24 hours of continuous ECG data were excluded from the study. Noise was removed from the signals in two steps. First, the ECG signal was median filtered to estimate the amount of
baseline wander. This estimated baseline wander was subtracted from the ECG signal. Second, additional noise was removed by applying a wavelet denoising filter with a soft threshold [21]. Afterwards, parts of the ECG signal were rejected if the signal-to-noise ratio was still small post-noise-removal. The Physionet Signal Quality Index (SQI) package removed portions of the ECG with a high signal-to-noise ratio and ectopic beats [22]. This was to ensure that the actual
morphology of the beats was being analyzed instead of the length of the beats. Finally, the ECG signal was divided into 30-minute segments. For each segment, if the standard deviation of the R-wave amplitude was greater than the standard deviation for a uniform distribution between 0.5 and 1.5, the segment was removed [20]. The reasoning behind this is that, physiologically, it is unlikely for the R-wave to change uniformly by more than 50% of its mean value. Therefore, a maximum standard deviation of 0.2887 was chosen for the R-wave amplitudes in each 30-minute interval.
Data from a total of 764 DISPERSE patients (14 cardiovascular deaths, 28 post-ACS myocardial infarctions) and 4555 MERLIN patients (230 cardiovascular deaths, 347 myocardial infarctions) were observed. 2254 of the MERLIN patients were given a trial drug called
ranolazine. A placebo was administered on the rest of the MERLIN patients. The patients were given Holter monitors to continuously record their ECGs for 7 days after a hospitalization occurred within 48 hours of an ACS.
B. Dynamic Time Warping
To calculate morphologic variability, the energy difference between each pair of consecutive beats first needs to be found. If the beats were strictly subtracted from each other however, samples from one beat may be compared with samples from another beat that are part
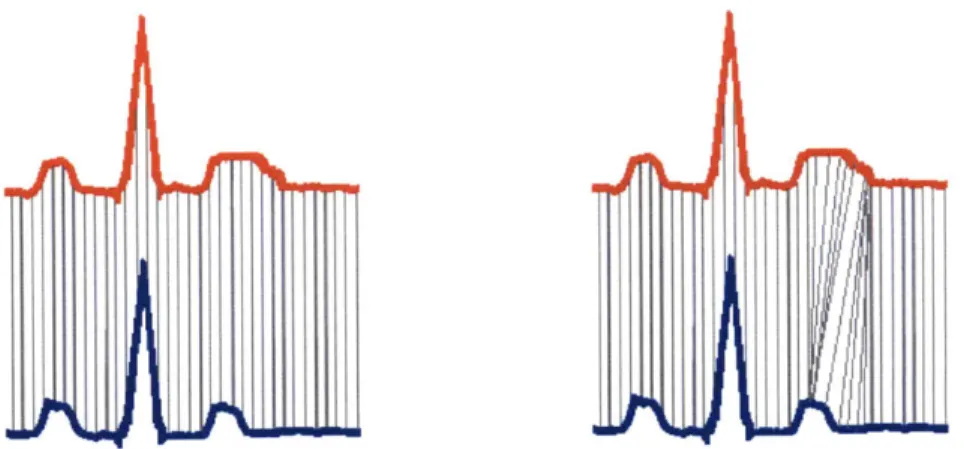
of different waves or intervals. For example, in Figure II-1, the end of the T-wave in the blue ECG corresponds to the middle of the T-wave in the red ECG. To determine the difference between two beats based on morphology, we wanted to ensure that appropriate segments of each beat were being compared. Dynamic time warping (DTW) measures the morphologic similarity between two heart beats (Figure II-1). The two beats are "warped" in the time domain to reveal the underlying morphological differences in the beats. One sample in a beat can match with
several samples in another beat.
Figure 11-1. Alignment of heart beats using dynamic time warping. The two beats on the left depict a comparison of the beats using strictly the Euclidean distance. The vertical lines show that the sample from a given time in the red beat is compared to a sample at the same time from the blue beat, though the beats may be at different phases on conduction at that time. The end of the T-wave in the blue beat is being compared to the middle of the T-wave in the red beat. The figure on the right shows how DTW can align two beats so that relevant conduction phases are compared. Relevant points in the conduction path of the two beats are evaluated. This figure depicts the variability in the T-wave. However, DTW can capture differences along the entire
conduction cycle. Image courtesy of Syed, et al. [20].
DTW is an alignment of two time series, A and B, of length m and n, respectively. An
m x n distance matrix is constructed, where the (ij) element of the matrix is the distance
between the ith element of A and the h element of B. The distance metric used is the Euclidean
distance, (A (i) - Bqj))2 .A warping path, (p, of length K is found from this distance matrix. An alignment of the two beats is simply the warping path. p(k) is defined as:
P(k) = (9A(k), (PB(k)), 1 < k < K,
(Equation 11-1) where pA represents the row index of the distance matrix and (pB represents the column index of the distance matrix.
The dynamic time warping alignment is the path that has the minimum cost associated
with it. The cost, C, for a particular path is defined as the sum of the squares of the differences between the pairs of matched elements (Equation 11-2).
K
Ce(A,B) = (AOA(k)] - B[VB(k)])2
k=1
(Equation 11-2) The cost to align two successive beats is the energy difference between the two beats. Therefore, the dynamic time warping alignment between the two beats can be used as a metric for how much the two beats differ (Equation 11-3).
DTW(A, B) = min C.(A, B)
(Equation 11-3) Thus, the final alignment of the two beats depends both on the amplitude alignment of the beats, and temporal aspect of the beats, as reflected in the length of the alignment, K.
C. Morphologic Distance
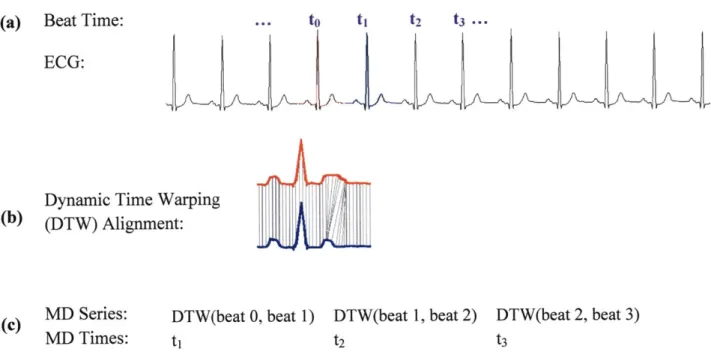
The morphologic distance (MD) is a measure of the difference in the morphology of two heart beats. DTW aligns two heart beats by their morphology. The MD value for two beats is defined as the energy difference, or cost, for the DTW alignment of those two beats. An ECG signal is converted to an MD time series by comparing each beat with its previous beat in a pair-wise manner (Figure 11-2). This MD series is then smoothed using a median filter of length 8 for further analysis [20].
(a) Beat Time: to ti t2 t3 ...
ECG:
Dynamic Time Warping (b) (DTW) Alignment:
(c) MD Series: DTW(beat 0, beat 1) DTW(beat 1, beat 2) DTW(beat 2, beat 3)
MD Times: ti t2 t3
Figure 11-2. MD time series. The successive beats of an ECG (a) are aligned using dynamic time warping (DTW) (b). Vertical lines connect data that correspond to each other in the red and blue heart beats. After using DTW, related portions of a beat are mapped to correspond to each other. The morphologic distance (MD) is the sum-of-squares energy difference between aligned beats, or the DTW cost (c). DTW image courtesy of Syed, et al. [20].
... . ... ... ... . .. ... . .... ... ... ... . . .. .. ...
-D. Morphologic Variability
Commonly used electrocardiographic risk-stratification measures observe variations in the heart rate of a patient. Morphologic variability (MV) observes changes in the shapes of the heart beats in an ECG [20]. These changes in the morphology of the heart beat may indicate some underlying problem with the conduction path of the electrical signal through the heart. The problem in the conduction pathway could be due to ischemia or myocardial infarction.
MV is computed from the morphologic distance time series. First, the ECG signal for a patient is divided into 5-minute intervals. Only the first 24 hours of the signal are used. Then, the DTW distance between each pair of consecutive beats is computed and recorded as the MD time series. Using the rationale from HRV, the frequency domain of the MD time series can also characterize the variability in the ECG morphology. Therefore, the power spectral density of the MD series is computed. To compute the MV, the sum of the power over a particular diagnostic frequency band is found for all five-minute intervals for each patient (Equation 11-4).
HF
MV6 = Power (v)
v = LF
(Equation 11-4) where 0 represents a particular 5 minute interval, v is the frequency, LF is the low frequency bound, and HF is the high frequency bound. The final MV value is the 90th percentile value of all of the sums, or 90th percentile value of the MVe's.
The choice of the optimal frequency band in the computation of MV is a key component of the analysis. To find an optimal diagnostic frequency band, the subsequent procedure is followed. For all combinations of low and high threshold frequencies between 0.10 Hz and 0.60 Hz in intervals of 0.01 Hz, MV values are calculated for each patient. The correlation of the MV values and certain cardiovascular outcomes are then measured based on a receiver operating
characteristic (ROC) curve. The optimal frequency band is found from this ROC analysis, as described in the following section.
E. Receiver Operating Characteristic
The receiver operating characteristic (ROC) is a measure of the predictive capability of a metric. Specifically, the ROC measures the true positive, hit rate of correctly identifying patients at high risk of adverse cardiovascular outcomes versus the false positive rate of incorrectly identifying patients at high risk. The area under the ROC curve is the c-statistic. A c-statistic of 0.5 indicates that the true positive rate is equivalent to the false positive rate, meaning the predictor cannot distinguish between high risk and low risk patients. The larger the area under the ROC curve, the larger the true positive rate. Generally, a c-statistic of 0.7 or greater is considered to adequately distinguish between two outcomes.
By computing ROC curves for many different frequency bands, we identify the
frequency range that is best able to differentiate between low risk and high risk patients. Based on the MV values, a frequency band that correlates the most with a certain outcome is identified. For each combination of frequency bands from 0.10 Hz to 0.60 Hz, with a resolution of 0.01 Hz, a c-statistic is computed. These c-statistics are then combined graphically to form a 'heat map.' A heat map shows which frequency ranges provide the highest c-statistic, or the best predictive value (Figure 11-3).
Previous work suggests that patients in the upper quartile of MV values (> 52.5) had a c-statistic of 0.72 for a frequency range between 0.30-0.55 Hz when calculated to predict death. This diagnostic frequency of MV values was found to have a hazard ratio for death of 8.46 post-ACS, indicating that MV was predictive of death [20].
0.6 0.76 0.55 0.74 0.5 -0.45 0.72 0.4 -: 0.35 0 - 0.3 -~ 0.3 06 0.68 0 0.25 -0.2- 0.66 0.15 -0.64 0.1 0.1 0.2 0.3 0.4 0.5 0.6
DF band upper limit / Hz
Figure 11-3. Heat map of morphologic variability. The best c-statistic for MV was 0.774 in the 0.35-0.36 Hz frequency range. However, the diagnostic frequency was generalized to 0.30-0.55 Hz.
Chapter III:
WEIGHTED MORPHOLOGIC VARIABILITY
In this chapter, a new method, called weighted morphologic variability (WMV), will be introduced that uses electrocardiographic morphologic information to predict post-ACS adverse cardiovascular outcomes. This chapter is organized as follows. First, we will describe the patient populations we used to evaluate WMV. Next, the calculation of WMV will be presented. WMV weights various frequencies according to their importance in risk stratification. We end by
describing the simulated annealing algorithm that was used to find the best set of weights for risk stratifying patients.
A. Weighted Morphologic Variability
Weighted morphologic variability (WMV) is an extension of the work on morphologic variability. Morphologic variability uses one frequency band to estimate a given patient's risk of subsequent adverse cardiac event. WMV uses multiple frequency bands to estimate risk factors.
Recall that the MV was found by initially calculating the power spectral density of the MD series, divided into 5-minute intervals. The MV for a particular 5 minute interval was found as the sum of the power over a particular frequency band (Equation III-1). A patient's MV was then the 90th percentile value of the entire individual 5-minute interval MVs. The 90th percentile value was chosen maximize information, but minimize noise [23]. Thus, the steps for finding MV are:
1. Compute the MD time series and divide the MD time series into 5 minute intervals. 33
2. Compute the MV0 for each 5-minute interval over a particular frequency band (Equation III-1). HF MV0 = Power (v) v = LF (Equation 111-1) 3. MV is the 9 0th percentile MVe value.
Weighted morphologic variability similarly uses the MD time series, divided into 5-minute intervals. However, WMV associates a weight with each frequency interval. WMV is computed as following:
1. The MD series is calculated and divided into 5 minute intervals. 2. The maximum frequency band is divided into n intervals.
3. For each interval, WMV, is the 9 0th percentile value of the sum of the power in that
particular frequency band (Equation 111-2).
HFi
WMV = Powero (v)
v = LFj
(Equation 111-2) 4. WMV is the sum of the weighted WMVe's (Equation 111-3).
n WMV= a- WMV n HFi = a Power0(v) i=1 v=LFi (Equation 111-3) where n is the number of intervals into which the complete frequency range is divided into, a, is the weight associated with a particular frequency band, LFn is the lower bound frequency of a particular frequency band, and HFn is the upper bound frequency of the frequency band. Power9
is the sum of the power over the specified frequency range for a particular 5-minute interval. To give the weights a bound, the sum of ai's are set to be 1 (Equation 111-4).
n
ai= 1 i=1
(Equation 111-4) MV is a special case of WMV. If n = 1 and a = 1, (or ifa1 = 1, and all other a, = 0) then:
1 HFi WMV = I 1_ Powere (v) i=1 v=LFi HF = Powero(v) = MV v = LF (Equation 111-5) However, it is important to note that extracting the 90% value when computing MV and WMV
occur at different points in the calculation. When calculating MV, the 9 0th percentile value of the
sums is found last. In WMV calculations, the 90th percentile values are found first, before weighting the WMVi's.
Two tests were performed on the various datasets to determine the best set of weights, or ai's, and the robustness of WMV in predicting death and myocardial infarction. First, the
maximum frequency range was divided into three intervals, where n = 3. Then several sets of weights were tested to determine the importance of WMV. Afterwards, simulated annealing was used to find the best set of alphas with n = 600, the largest possible n, given the data. The
1. WMV with 3 Frequency Bands
WMV was first tested using three frequency bands. The power spectral density of the MD time series was computed from 0.00 Hz to 0.60 Hz. First, the 0.001Hz to 0.600 Hz frequency spectrum was divided into three segments. The spectrum had two variable cutoff points,
si
and 02. TheP's
were iterated through all possible values from 0.00 to 0.60 Hz in 0.01 Hz intervals. A weighting, aj, was assigned to each band. The data were iterated through all of the possible weights from 0 to 1 in intervals of 0.1 for the three segments, and through all of the possible cutoffs for the division into the three segments. The WMV over these ranges werecalculated, and weighted according to the possible a's (Equation 111-6).
i P2 0.6 Hz
WMV = a1 Power0(v) + a2 Powere (v) +a1 Power6(v)
v =0Hz V= V= 2
(Equation 111-6) Again, the sum of the ai's was set to 1. The sum of these weighted MVs was then used to find a c-statistic. The combination of the best cutoffs and best weights was subsequently analyzed. The best c-statistic would have to perform at least as well as the value determined from MV because if 01 and
p2 were set to 0.30 Hz and 0.55 Hz, respectively, and only a
2 = 1, the resulting c-statistic would be exactly that computed from MV in previous studies. The results from this experiment are shown in Table 111-1. Indeed, the best c-statistic using WMV was 0.785 for death, compared to that of 0.771 using MV. For myocardial infarctions, the best c-statistic using WMV was 0.610, an improvement from a c-statistic of 0.488 using MV.The results from this experiment indicated that data from multiple frequencies contain predictive value. Thus, we performed an annealing algorithm to determine which set of weights for the various frequencies would best predict various cardiac outcomes.
DISPERSE-2 a1 a2 a3 Pi 02 c-statistic Death (c-statistic for 0.0 0.9 0.1 0.350 Hz 0.360 Hz 0.785 0.3-0.55 Hz = 0.771) MI (c-statistic for 1 0 0 0.100 Hz 0.110 Hz 0.610 0.3-0.55 Hz = 0.488)
Table III-1. C-statisticsfrom weighting various MV values. MV values derived from three frequency bands (0.1Hz -
p1
Hz, $1 Hz -p2
Hz, p2 Hz - 0.6 Hz) were weighted according to various a's. The combination of cutoffs (O's) and weights (a's) that produced the best c-statistics are shown. The best c-statistic for predicting cardiovascular death, given MV in the 0.3-0.55 Hz frequency range was 0.771. The best c-statistic for predicting myocardial infarction (MI)previously was 0.488.
2. WMV with 600 Frequency Bands
We further investigated optimal weighting by finding the best possible combination of weights for the smallest frequency bands allowed. The power spectral density of the MD time series was created from 0.001 to 0.600 Hz, in 0.001 Hz intervals. Therefore, 600 weights for each 'band' (0-0.100 Hz, 0.001-0.002 Hz, etc.) needed to be determined (Equation 111-7). The morphologic variability for a single frequency (MVSF) is the 90th percentile power from the MD
time series for a particular frequency (Equation 111-8).
600
WMV = a - MVSFj
(Equation 111-7)
MVSFj = Power0(v), where v = i -10-3
After determining the MVSF's, a set of weights for the various frequencies that best predict various cardiac outcomes needed to be found. Finding the optimal alphas in a high dimensional space is an NP-hard optimization problem. For such problems, one can use a commonly-used method to find the solutions. We used simulated annealing to determine the set of weights that best predict adverse cardiovascular outcomes. A simulated annealing run
randomly samples various sets of weights and finds the lowest energy point in an energy landscape. For our purpose, the energy landscape was the set of possible negative of the c-statistics found from calculating the WMV of all possible sets of weights. Therefore, the
minimum in the negative c-statistic landscape actually found the set of weights that produced the best c-statistic.
The simulated annealing algorithm, as described in the following section, is performed to find a set of weights that produce the best c-statistic for a particular set of training data on a particular outcome.
B. Simulated Annealing
Simulated annealing is a popular method of optimizing complex functions [24]. The formulation for this method is analogous to crystal optimization. One way to perfect
crystallization is to heat the crystals and allow them to slowly cool. Similarly, the simulated annealing algorithm searches through space, randomly sampling, in order to find the global minimum. A control parameter, 'temperature', is used to determine the annealing schedule. This term does not have any physical meaning, and should not be confused with our standard notion of temperature. The temperature begins at a very high level. At each temperature, several points in global space are randomly sampled, and their energies are compared. Some samples are
accepted, based on a Metropolis criterion. As the temperature decreases, samples are accepted only if their energies are lower. The temperature is decreased until some stopping criterion is reached. For our purpose, the energy space for the simulated annealing algorithm was the set of c-statistics produced from computing the WMV for all possible sets of weights. In actuality, because we want to optimize the maximum c-statistic, and simulated annealing finds the
minimum of a global space, we use the negative of the c-statistics to determine the global energy space.
An annealing schedule is fully described by the following steps: 1. Choice of the initial temperature
2. Choice of the temperature decrement function 3. Number of perturbations at each temperature 4. Stopping criterion
The remainder of this chapter details the annealing schedule selected to determine the best set of weights for WMV.
1. Choice of Initial Temperature
The initial temperature is set high, such that most perturbations of the weights will be accepted. This ensures that a large energy space is sampled. For this simulation, a temperature was selected that had > 97% acceptance. This ensured that c-statistics had a large variation in the first step (between 0.3 and 0.8). As temperature decreases, the percentage of acceptances
2. Choice of Temperature Decrement Function
The temperature is decremented slowly to ensure that energy space is sampled adequately. However, the annealing run needs to complete in finite time. Therefore, the temperature decrementing function needs to be set to optimize the annealing schedule.
The decrementing function used in this simulation is a modified, slower version of the function described in Stultz, et al. [25]. For the annealing step, Tan+, the temperature is
decremented by the minimum of AT, and T,/8 (Equation 111-9).
Tan = Tn - min(A Tn, Tn/8), (Equation 111-9)
ST
if lstsq (T)<
tolerance where ATn = * T2) Tn if lstsq (Tn)>
tolerance 4 - o(EO)The relaxation time, Tn, is the time required for the energy perturbations to reach equilibrium at a given temperature. v is the 'thermodynamic distance,' or how close the set of perturbations are to equilibrium. Eo is the mean energy, or the mean of the negative of the c-statistics, for a set of perturbations at a given temperature. o(Eo) is the standard deviation of the fluctuations in the mean energy over the perturbations.
This annealing schedule is desirable because variable temperature decrements can be made. When the temperature is low, relaxation is very long and small temperature decrements are taken to ensure the global minimum is reached. However, once the system has reached equilibrium, larger temperature decrements may be taken in order to complete the simulation.
3. Number of Perturbations at Each Temperature
In order to anneal to the best set of weights, a random set of weights that varied between 0 and 1, with the sum equal to 1, was created. First, all weights were set to 0. Then, a random alpha, ak, was selected to be set between 0 and 1. Another random zeroed alpha was then set to between 0 and (1 -ak). This was repeated so that each subsequent alpha was set to some random
value between 0 and(1 - Z0 a1). Thus, the initial set of alphas varied from 0 to 1, summing to
1.
A perturbation was made to each set of alphas. A random alpha, ak, was chosen to be perturbed. This ak was set to a random number between a lower bound and an upper bound. The bounds were set as following:
upper bound = minimum (ak + rand, 1)
lower bound = maximum (a -rand, 0)
The new alpha, au', then determined the values of the remaining alphas. All of the alphas were renormalized, such that the sum of the weights equals to 1, as shown in (Equation III-10).
1 - al
a= ai k where a' = new alpha
1 a a
(Equation III-10) After each perturbing a single alpha value, and renormalizing the rest of the weights on the frequencies, the Metropolis criterion is tested. Each weight, ai, is used to scale the MVSF value at each frequency for each patient. The total WMV value is the sum of the weighted MVSF values. A c-statistic is calculated from the sensitivity and specificity of the WMV values of each patient. The Metropolis criterion uses the negative of the c-statistic to decide whether to accept or reject the set of weights. The Metropolis criterion accepts the weights that meet one of two requirements:
1. The current c-statistic is larger than the previous perturbation's c-statistic. Equivalently, the negative of the current statistic is less than the negative of the previous perturbation's c-statistic.
2. A proposal Gaussian density, centered at the negative c-statistic of the current set of weights, is greater than some random number in (0, 1). Formally, this is written as
E-E
e T > p
where E is the old c-statistic, E' is the new c-statistic, T is the temperature, and p is a random value between 0 and 1.
All of the accepted c-statistics for the current temperature are then fit to an exponential curve. The time constant, z, of the curve is determined, and is defined as the relaxation time. The temperature is decremented either if more than 3T perturbations have been made or if the
maximum number of perturbations, set by the user, has been reached. For our purposes, the maximum number of perturbations was 100x the degrees of freedom, or 60,000 maximum perturbations.
4. Stop Criterion
The entire annealing is considered complete when the c-statistic value is not changing significantly. At high temperatures, perturbations occur far way from each other on an energy landscape. However, at lower temperatures, accepted a perturbations have c-statistics near each other. At very low temperatures, the c-statistics of the a perturbations should occur right next to each other on an energy landscape. Therefore, when the c-statistic does not vary much, the annealing run is thought to have found the global energy minimum. To determine if the
annealing run has reached this minimum, the standard deviation of the c-statistics calculated at 42
the end of each temperature. If the standard deviation of the last 10% of the c-statistics is smaller than some c, the run is considered complete. F was set to 5 x 10⁻⁵.
The final product of the simulated annealing run is a set of weights that produce the highest c-statistic, or the lowest negative of the c-statistic, for a particular adverse cardiovascular outcome. The next chapter will evaluate the performance of the weights found for WMV using simulated annealing. The results will be assessed for both cardiovascular death and myocardial infarctions post-ACS.
Chapter IV:
EVALUATION OF WEIGHTED MORPHOLOGIC
VARIABILITY
We assessed the performance of weighted morphologic variability (WMV) using patients from both the MERLIN and DISPERSE-2 data sets.
To ensure that small variations in the sizes of the weights would not drastically affect the performance of WMV, we performed a smoothing of the weights from the simulated annealing run. A running average of various window sizes was performed on the alphas. A window size of
0.007 Hz was chosen to compute a running average on the weights, when computing WMV. These smoothed weights were used for the remainder of this work.
This chapter outlines how to separate individuals at low risk of adverse cardiovascular outcomes from high risk individuals, how we validated our data, and the performance of WMV in prognosticating.
A. Determining Cutoffs for High and Low Risk
WMVs for all of the patients were calculated using the method described in chapter 3. Our aim was to determine a low risk and a high risk group of patients for complete risk stratification. The hazard ratio, sensitivity, and specificity of the test could thus be calculated. The hazard ratio is a measure of risk. We used Cox proportional hazards model to estimate the hazard ratio, which compares the rates of death for the high risk and low risk patients [26].
Sensitivity is the true positive rate of the test, or the ratio of true positives to the total number of
positives in a test. Specificity is the true negative rate. A high sensitivity and specificity suggests that a test is accurate at predicting risk. In order to determine the risk, the WMV values for all of the patients are sorted, and a cutoff was determined that separated a low risk group from a high risk group. This cutoff was determined in one of three ways: using the quartile as a cutoff, maximizing the hazard ratio, and maximizing sensitivity and specificity values. These three methods are described in detail below.
1. Cutoffs Using Quartile Values
The first method of determining a risk cutoff was using the quartile as a marker. In Syed, et al. [20], the upper quartile of MV values was considered high risk, and the lower three
quartiles of MV values were considered low risk. Similarly, the upper quartile of WMV values was determined to be high risk. The hazard ratio, sensitivity, and specificity for this cutoff were calculated using the training and testing sets, as shown in Table IV-1. Using quartiles as the difference between low and high risk groups was typically used for research in MV; however, a more data-driven approach to determining a cutoff was desired.
Dataset Hazard Sensitivity Specificity Ratios
Best Fit Weights MERLIN, placebo 6.61 0.559 0.764
(Cutoff =1.3794) DISPERSE 6.37 0.714 0.717
MERLIN, ranolazine 3.68 0.429 0.806
Running Average MERLIN, placebo 6.03 0.539 0.764
(Cutoff =1.3778) DISPERSE 6.21 0.714 0.711
MERLIN, ranolazine 3.70 0.429 0.791
Table IV-1. Hazard ratio, sensitivity, and specificity using quartile cutofffor cardiovascular death. The DISPERSE testing dataset contained 764 patients (14 cardiovascular deaths), the MERLIN placebo training group included 2301 patients (102 cardiovascular deaths), and the MERLIN ranolazine testing group had 2254 patients (91 cardiovascular deaths).
2. Cutoffs Using Hazard Ratios
The second method of determining a risk cutoff was using hazard ratios. The WMV values were sorted from lowest to highest value. Then, the hazard ratios for all of the possible
cutoffs between two WMV values were calculated. The cutoff that maximized the hazard ratio was used to determine the difference between high and low risk. These results are shown in
Table IV-2. However, these results were not used for a final cutoff because the results over-fit for a high hazard ratio. The high hazard ratio used for one set of data performed poorly on other sets of data. Therefore, this method of finding a cutoff was not used for the final results.
Dataset DatasetRatios Hazard Sensitivity Specificity
Best Fit Alphas MERLIN, placebo 1366302.55 0.990 0.054
(Cutoff= 1.1816) DISPERSE 1347131.55 1.000 0.039
MERLIN, ranolazine 1.09 0.967 0.048
Running Average MERLIN, placebo 7.98 0.912 0.254
(Cutoff = 1.2448) DISPERSE 3.14 0.929 0.196
MERLIN, ranolazine 3.47 0.846 0.250
Table IV-2. Hazard ratio, sensitivity, and specificity using maximum hazard ratio cutofffor cardiovascular death. This technique of determining cutoffs tends to produce high hazard ratios for the testing data, seemingly over-fitting the data. The sensitivity (true positive rate) is nearly
100%. However, the specificity (true negative rate) is very poor. This suggests that most of the patients are classified as high risk, and few are classified as low risk. This method of determining a cutoff does not discriminate between high and low risk well, and, therefore, a better method is required.
3. Cutoffs Using Sensitivity and Specificity
Sensitivity and specificity are measures of the predictive ability of a particular test. Sensitivity is the true positive, hit rate of correctly identifying patients at high risk. Specificity is the true negative rate, the rate at correctly identifying low-risk patients. Our final metric of determining the cutoff was finding a point which corresponded to the maximum specificity and sensitivity of the training set. Typically, the apex of the receiver operating characteristic (ROC) curve is chosen. However, the ROC curve for this particular dataset does not have a natural apex point, as shown in Figure IV-1. Therefore, we chose the cutoff point that maximized the sum of the sensitivity and specificity. The results for this chosen cutoff are shown in Table IV-3 and
0.4 0 8 0.7 O 06 045 0.3 0 01 02 03 04 05 06 07 08 09 False Positive Rate
Figure IV-1. Receiver operating characteristic curve for WM Dataset
V and cardiovascular death.
Hazard Sensitivity Specificity Ratios
Best Fit Alphas MERLIN, placebo 8.91 0.833 0.560
(Cutoff= 1.3037) DISPERSE 3.59 0.786 0.492
MERLIN, ranolazine 3.78 0.648 0.577
Running Average MERLIN, placebo 6.24 0.618 0.717
(Cutoff = 1.3564) DISPERSE 7.15 0.786 0.659
MERLIN, ranolazine 4.32 0.516 0.741
Table IV-3. Hazard ratio, sensitivity, and specificity using maximum sensitivity and specificity
cutofffor cardiovascular death. Based on these results, the highlighted cutoff used for further
studies was found by maximizing sensitivity and specificity, using a running window size of 0.007 Hz.
Dataset Hazard
Ratios Sensitivity Specificity
Best Fit Alphas MERLIN, placebo 2.35 0.489 0.696
(Cutoff = 2.392) DISPERSE 0.54 0.250 0.602
MERLIN, ranolazine 1.16 0.360 0.673
Running Average MERLIN, placebo 2.37 0.532 0.620
(Cutoff = 2.357) DISPERSE 0.73 0.392 0.510
MERLIN, ranolazine 1.11 0.453 0.585
Table IV-4. Hazard ratio, sensitivity, and specificity using maximum sensitivity and specificity
As shown in these results, the sensitivity and specificity cutoff perform better, based on hazard ratios, than using a cutoff based on hazard ratios or on quartile values. Using sensitivity and specificity to determine cutoffs is standard practice [27]. Therefore, the remainder of this chapter will use the sensitivity and specificity cutoff for determining high or low risk.
B. Cross-Validation
In order to show that the hazard ratios produced from our WMV values are relatively consistent, we performed a cross-validation. The MERLIN placebo group was randomly divided into two evenly-sized groups, with approximately equal numbers of patients who had a
cardiovascular death in each group. Simulated annealing was performed on one of the groups, in order to find a set of weights and a cutoff. These weights and cutoffs were then tested on the second group, as well as the DISPERSE patients and MERLIN ranolazine patients to see if the hazard ratios were consistently high. This validation was performed 10 times. The results for the cross-validation on cardiovascular death are shown in Table IV-5, and the results for myocardial infarction are shown in Table IV-6. For posterity, only the MERLIN placebo training and testing group results were considered, so our final testing groups would truly be testing groups. The performance of WMV of the DISPERSE and MERLIN ranolazine groups were included in Table IV-5 and Table IV-6 for completeness, but were not considered when evaluating the WMV cross-validation results.