Publisher’s version / Version de l'éditeur:
Vous avez des questions? Nous pouvons vous aider. Pour communiquer directement avec un auteur, consultez la première page de la revue dans laquelle son article a été publié afin de trouver ses coordonnées. Si vous n’arrivez pas à les repérer, communiquez avec nous à [email protected].
Questions? Contact the NRC Publications Archive team at
[email protected]. If you wish to email the authors directly, please see the first page of the publication for their contact information.
https://publications-cnrc.canada.ca/fra/droits
L’accès à ce site Web et l’utilisation de son contenu sont assujettis aux conditions présentées dans le site
LISEZ CES CONDITIONS ATTENTIVEMENT AVANT D’UTILISER CE SITE WEB.
59th Canadian Geotechnical Conference (Sea to Sky Geotechnique 2006)
[Proceedings], pp. 1-10, 2006-10-01
READ THESE TERMS AND CONDITIONS CAREFULLY BEFORE USING THIS WEBSITE.
https://nrc-publications.canada.ca/eng/copyright
NRC Publications Archive Record / Notice des Archives des publications du CNRC :
https://nrc-publications.canada.ca/eng/view/object/?id=657ef75a-fb33-4ec7-9fa5-9f106a5c6f63
https://publications-cnrc.canada.ca/fra/voir/objet/?id=657ef75a-fb33-4ec7-9fa5-9f106a5c6f63
NRC Publications Archive
Archives des publications du CNRC
This publication could be one of several versions: author’s original, accepted manuscript or the publisher’s version. / La version de cette publication peut être l’une des suivantes : la version prépublication de l’auteur, la version acceptée du manuscrit ou la version de l’éditeur.
Access and use of this website and the material on it are subject to the Terms and Conditions set forth at
Water content measurement in highly plastic clay using dielectric
based probes
http://irc.nrc-cnrc.gc.ca
W a t e r c o n t e n t m e a s u r e m e n t i n h i g h l y p l a s t i c
c l a y u s i n g d i e l e c t r i c b a s e d p r o b e s
H u , Y . ; V u , H . ; H u b b l e , D .
N R C C - 4 9 2 6 0
A v e r s i o n o f t h i s d o c u m e n t i s p u b l i s h e d i n
/ U n e v e r s i o n d e c e d o c u m e n t s e t r o u v e
d a n s : 5 9
t hC a n a d i a n G e o t e c h n i c a l
C o n f e r e n c e ( S e a t o S k y G e o t e c h n i q u e
2 0 0 6 ) , V a n c o u v e r , B . C . , O c t . 1 - 4 , 2 0 0 6 ,
p p . 1 - 1 0
WATER CONTENT MEASUREMENT IN HIGHLY PLASTIC CLAY USING
DIELECTRIC BASED PROBES
Yafei Hu
1, Hung Vu
2, and David Hubble
11
Centre for Sustainable Infrastructure Research (CSIR), Institute for Research in Construction (IRC),
National Research Council Canada (NRC), Regina, SK
2
Industrial Secondment Visiting Fellow at NRC-SCIR, Regina, SK
ABSTRACT
Dielectric methods are widely used to monitor in situ volumetric water content in granular or fine-grained soils with low to medium plasticity. However, the use of these methods in highly plastic, unsaturated, expansive clay soil is very limited. For highly plastic clay, manufacturer-provided calibration curves are generally not applicable and soil-specific calibrations are required. This paper presents the results of a calibration program carried out for various commercially available probes using compacted specimens of highly plastic Regina Clay in the laboratory. The influence of dry density and temperature on dielectric permittivity for the soil was also studied. The applicability of the dielectric methods to monitor water content in Regina Clay is also discussed.
RÉSUMÉ
Les méthodes diélectriques sont largement utilisées pour contrôler, in situ, la teneur en eau dans les sols
granuleux ou les sols à grain fin avec une plasticité basse à moyenne. Cependant, l'usage de ces méthodes
dans de l'argile très plastique, non saturée, expansif est très limitée. Pour l’argile très plastique, les courbes
de calibrage fournies par les fabricants ne sont pas, en général, applicables et les calibrages spécifiques
aux sols sont exigés. Ce papier présente les résultats d'un programme de calibrage exécuté à
plusieurs
sondes commercialement disponibles. Le calibrage a été réalisé dans un laboratoire avec des spécimens
compact d'argile très plastique (Regina Clay). L'influence de la densité sèche et de la température sur la
constante diélectrique du sol a aussi été étudiée. L'applicabilité des méthodes diélectriques pour contrôler la
teneur en eau de l’argile de Regina est aussi discutée
.1. INTRODUCTION
Monitoring of soil water conditions in the field has proven to be an important measurement in geotechnical engineering for understanding the behaviour of an unsaturated, expansive soil and verifying soil mechanics theory (Fredlund, 2006). There is a range of available methods for measuring soil-water conditions (Fig. 1). Dielectric techniques are indirect methods that have quick response time, do not require maintenance, and can provide continuous readings through automation (Munoz-Carpena 2004). The dielectric methods use empirical
calibrated relationships between volumetric water content and the sensor output signal such as time, frequency, impedance and wave phase.
Dielectric methods are widely used to monitor in situ soil volumetric water content in granular or fine-grained soils with low to medium plasticity. However, the use of these methods in highly plastic, unsaturated, expansive clay soil is very limited. For this type of clay soil, manufacturer-provided calibration curves are generally not applicable and soil-specific calibrations are necessary.
Measurement of Soil-water Conditions
Direct Methods Indirect Methods
Volumetric Water
Content Measurement MeasurementSuction
Neutron Moderation Techniques Dielectric Techniques
Time Domain
Reflectometry, TDR Reflectometry, WCRWater Content Reflectometry, ADRAmplitude Domain Reflectometry, FDRFrequency Domain Others
This paper presents the calibration procedures and results of a highly plastic, expansive soil (called Regina Clay) for various commercially available dielectric based probes. The applicability of these probes to monitor water content in the soil is also discussed. The soil-specific calibrations were carried out in the laboratory using compacted specimens. The influence of dry density and temperature on dielectric permittivity for the soil was also studied. 2. THEORETICAL BACKGROUND
The dielectric methods estimates soil water content by measuring the soil bulk dielectric permittivity, Ka, that determines the velocity of an electromagnetic wave through the soil. In a composite material like soil (i.e., made up of soil minerals, air and water), the bulk dielectric permittivity is made up of the relative contribution of each of the components. Since the dielectric permittivity of liquid water (Klw = 79~82) is much larger than that of other soil constituents (e.g. Ks = 2~5 for soil minerals and Kair = 1 for air), the total bulk dielectric permittivity of the soil is mainly governed by the presence of liquid water (Look and Reeves, 1992).
Various dielectric methods have been developed to measure volumetric water content in soil (Fig. 1). These methods include the time domain reflectometry (TDR), the water content reflectometry (WCR), the amplitude domain reflectometry (ADR), and the capacitance and frequency domain reflectometry (FDR). Although each method may measure different electromagnetic wave signal properties, they have common features. In all these methods, a waveguide or probe is embedded in the soil of interest and an electromagnetic wave is sent through the soil along the waveguide. The electromagnetic wave is reflected back at the end of the waveguide and is captured and sampled by electric circuits or oscillators. During the travel process of the electromagnetic wave, some of the signal’s properties are influenced by the bulk dielectric behaviour of the soil. Therefore, the analysis of the reflected electromagnetic wave can relate the signal properties to the bulk dielectric permittivity of the soil. The bulk dielectric permittivity thus determined can then be related to the soil water content via either empirical calibration or theoretical analysis (Hansson and Lundin 2006).
The TDR method measures the travel time of a broadband electromagnetic wave signal propagating along a waveguide that is surrounded by the soil. Since the propagation velocity (v) is a function of Ka, Ka is therefore proportional to the square of the transit time (t, in seconds) down and back along the waveguide:
2 2 ⎟⎠ ⎞ ⎜ ⎝ ⎛ = L t c Ka [1]
where c is the velocity of electromagnetic waves in a vacuum (3×10⁸
m/s) and L is the length of the waveguide embedded in the soil (in m). The factor 2 in the denominator of Eq. 1 accounts for the two-way travel of
the signal. Using TDR, the reflected electromagnetic wave is captured by oscillators and is used to analyze the travel time of the wave. The travel time thus determined is related to soil water content via empirical calibration. The WCR method operates similar to TDR systems. Its transmission line oscillators generate a voltage pulse inside the sensor head, which propagates along the waveguide at a velocity that is dependent on the dielectric permittivity of the soil surrounding the waveguide. The arrival of the reflected pulse triggers the next pulse. The number of voltage pulse reflections over a certain time interval is recorded. The probe period, inversely related to the number of reflections per second, is output. The probe output period is empirically related to water content using a calibration equation.
When an electromagnetic wave travelling along a waveguide reaches the section of the waveguide embedded in the soil, part of the energy transmitted is reflected back into the transmitter because of the different impedances between the part of the waveguide inside the soil and that part of the waveguide outside the soil. The section of waveguide in the soil has an impedance that depends on the dielectric permittivity of the soil into which it is inserted and, therefore, is usually different from that outside the soil. The reflected wave interacts with the incident wave producing a voltage standing wave along the waveguide, i.e., change of wave amplitude along the length of the waveguide. ADR probes measure the voltage amplitude difference, which is subsequently related to the dielectric permittivity and the water content in the soil via empirical calibration.
After the bulk dielectric permittivity of soil is determined from the measurement of some of the electromagnetic wave signal properties via any of the aforementioned methods or other dielectric methods, then the electromagnetic wave signal property is readily related to the soil water content if the relationship between the bulk dielectric permittivity and the water content is known. Topp et al. (1980) showed that the relationship between
Ka and soil water content, as measured by dielectric methods in the megahertz to gigahertz frequency range, is very similar for a wide range of soils and other porous materials. They suggested an empirical relationship between the soil dielectric permittivity, Ka, and volumetric water content, θw, as follows:
3 2
7
.
76
146
3
.
9
03
.
3
w w w aK
=
+
θ
+
θ
−
θ
[2]This relationship was initially considered to be universal (i.e., independent of soil type, dry density, temperature and soil salinity), and has been applied successfully by other investigators, e.g., Kachanoski et al. (1990) and Zegelin et al. (1989), among others. The universal relationship laid the foundation for wide application of dielectric methods for water content measurements, because calibration requirements are minimal – in many cases soil specific calibration is not needed. Based on the
same reason, many dielectric based instruments provide standard equations to convert their measured signal properties to water content values for soils under general conditions.
However, with increasing application of dielectric methods in different soils and environments, it has become clear that the relationship proposed by Topp et al. (1980) does not hold for all soils. The use of standard equations for some types of soils or some extreme conditions may produce large measurement errors (Dirksen and Dasberg, 1993). For better accuracy, soil-specific calibration has to be performed. One typical example is unsaturated clay soil. Compared with the typical three phase (solid particle, water and air) structure of the soil group that followed the calibration curve of Topp et al. (1980), this type of soil has an extra phase: a thin layer of bound water on the clay mineral surfaces. This part of the water in the soil is comprised of water molecules that are oriented due to the charged mineral surface. These molecules can not rotate as freely as the bulk pore water under alternating electric field, resulting in less polarization compared with that of “free” water, and a lower measured dielectric permittivity. The dielectric permittivity for the bound water may be closer to that of ice and much lower than that of liquid water. The volume fraction of bound water is determined by the soil specific surface and soil dry density (Dirksen and Dasberg, 1993).
Soil dry density not only influences the dielectric behaviour of clay soil through bound water, the density itself affects the dielectric permittivity as well. The effect comes from the potential for considerable volume changes of clay soils with change in their water content. Dry density changes from 1.25 to 1.56 Mg/m3 for Kenmuir clay (Brown Ferrosol) and from 0.87 to 1.85 Mg/m3 for Waco clay
(Black Vertosol) were reported (Bridge et al., 1996). Because the dielectric permittivity of solid soil particles is in the range from 2 to 5 and the dielectric permittivity of air is near unity, the denser the soil, the larger the bulk dielectric permittivity of dry soil. Ledieu et al. (1986) reported that the calibration was improved if bulk dry density was included.
Clay typically has high electric conductivity (EC). The soil EC comes from the electrically charged clay colloid surface and the electrolytes in the soil solution. The effect of the EC of clay on soil water content measurement using dielectric methods has been observed and discussed by Topp et al. (1980), Topp et al. (2000), Malicki et al. (1994), and White et al. (1994), among others.
The dielectric permittivity of the clay soil may also be affected by temperature change in the soil. The temperature change may influence the dielectric permittivity in two aspects. In one aspect, the dielectric permittivity of liquid water Klw is temperature dependent. The change of dielectric permittivity of free water with temperature can be described by the following formula (Weast, 1986): 3 8 2 5 3 ) 25 ( 10 8 . 2 ) 25 ( 10 19 . 1 ) 25 ( 10 579 . 4 1 [ 54 . 78 − × − − × + − × − = − − − T T T Klw [3]
where T is the water temperature in Celsius. This equation shows that the Klw will decrease when the temperature increases. Since Klw is the predominant contributor to the bulk dielectric permittivity, Ka, Ka will decrease with increasing temperature. The other aspect of the temperature effect is opposite to the first one, i.e., the Ka will increase with the increase in temperature because more bounded water in clay soil will be released and become free water. The competing phenomenon of increasing temperature on dielectric permittivity was experimentally verified by Wraith and Or (1999).
At very low water contents, the Ka increased with the increase in temperature because the dielectric behaviour was dictated by the soil solids and bound water. At high water content, Ka decreased with temperature increase because free water became a large component of the total volume and the effects of temperature on free water began to dominate.
3. DIELECTRIC BASED PROBES
Three types of dielectric based probes were used in this study. The probes are CS616, ML2x and SM200. The CS616 is a WCR type sensor and is manufactured by Campbell Scientific, Inc. (Logan, UT, USA). The CS616 probe has two 300 mm long stainless steel rods of 3.2 mm diameter. The ML2x and SM200 are ADR type sensors, both are marketed by Delta-T Devices Ltd. (Cambridge, UK). The ML2x probe has four 60 mm long rods of 3 mm diameter. The SM200 probe has two 51 mm long rods of 3 mm diameter. The manufacturer specified accuracy of CS616, ML2x and SM200 are 2.5%, 1% and 3%, respectively after calibration to a specific soil type. Two CS616, named CS616-1 and CS616-2, one ML2x and one SM200 probe were used.
4. MATERIALS USED AND TESTING METHODS The soil used in this study was post-glacial lake deposit, highly plastic, expansive clay, called Regina Clay. Grain size distribution analysis indicates that the soil particles are 86.5 percent clay size, 11.6 percent silt and 1.9 percent sand. Atterberg limits tests indicate a liquid limit of 74 percent, a plastic limit of 30 percent and a plasticity index of 44 percent.
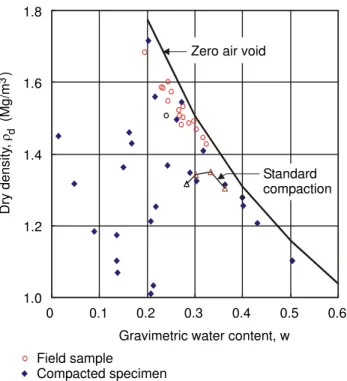
In the field, Regina clay is typically over consolidated due to desiccation. Gravimetric water content varies from 0.20 to 0.40 and dry density varies from 1.40 to 1.75 Mg/m3.
The in situ dry density is higher than the standard Proctor maximum dry density of 1360 Mg/m3 obtained from a
1.8 1.6 1.4 1.2 1.0 0 0.1 0.2 0.3 0.4 0.5 0.6 D ry de nsi ty , (M g/ m ) ρd 3
Gravimetric water content, w Zero air void
Standard compaction
Field sample
Compacted specimen
Figure 2. Dry density versus gravimetric water content for compacted specimens and field samples
The soil from the field was first oven-dried and ground to pass a 2 mm sieve. Based on the desired water content and dry density, the exact quantities of dried soil and water were measured and mixed thoroughly on a tray. The mixture was then cured in a sealed polyethylene bag for 24 hours to achieve a uniform distribution of water in the soil. The moist soil was then compacted in a steel mold 550 mm in length, 150 mm in width and 150 mmin height to have an adequate volume of soil for the calibration of the probes. Depending on the required dry density and water content of the soil specimen, different lifts and compaction effort were applied (the soil was compacted using a standard Proctor compaction hammer, a modified Proctor compaction hammer, or a jackhammer).
For stiff to hard compacted soil specimens, insertions of the probes were done using guide rods or predrilled holes. The sensors were connected to a data acquisition system and the travel time for CS616 or voltage for ML2x and SM200 was recorded for analysis. As a check on the reproducibility, multiple readings were taken in rapid succession for each soil sample. For CS616, the same insertion hole was used for the readings. The soil sample size allowed only one test location without including any boundary effect in the measured values. The ML2x and SM200 probes were inserted at three or four different positions in the same sample. Following the probe readings, the gravimetric water content of the soil specimen was determined by sampling five different parts of the specimen and the results were averaged.
A total of 34 tests were done for the calibration, with dry densities ranging from 1.0 to 1.7 Mg/m3 and gravimetric water contents that ranged from 0.02 to 0.50. Figure 2
shows the distribution of dry density and gravimetric water content of the tested specimens. Also shown in this figure is a range of field dry density and gravimetric water content and the zero air void curve of the tested clay. Knowing the dry density of the specimen, the determined gravimetric water content values can be converted to volumetric water content values.
The effect of temperature on the readings of dielectric permittivity was investigated on a compacted soil specimen having a dry density 1738 kg/m3 and volumetric water content of 29 percent. The specimen temperature was varied from 20°C to 5°C in decrements of 5°C and then from 5°C to about 40°C in increments of 5°C.
5. TEST RESULTS
To establish a calibration curve for each water content probe, the electromagnetic wave signal readings (travel time for CS616 and voltage for ML2x and SM200) can be plotted against measured soil water content. Alternatively, the readings can be first related to the bulk dielectric permittivity of the soils using a reading-bulk dielectric permittivity relationship provided by the manufacturers and then the bulk dielectric permittivity is plotted against the measured soil water content.
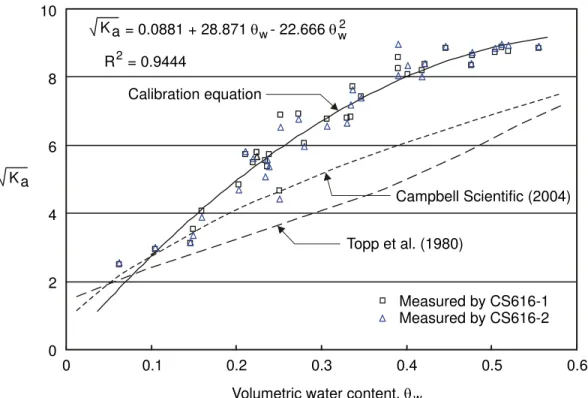
5.1 Calibration for CS616 probes
For the CS616 probes, the manufacturer-provided instruction manual uses a direct calibration of probe output period against the measured water content (Campbell Scientific, Inc. 2005). Both linear and quadratic calibration equations relating output period (in seconds) to volumetric water content, θw, are supplied depending on user accuracy requirement. For later comparison with the ML2x and SM200, the probe output period was first converted to the bulk dielectric permittivity and then the curve fitting was used between the measured soil water content and the bulk dielectric permittivity. Hansson and Ludin (2006) presented a two-parameter equation for the relationship between the probe output period and the bulk dielectric permittivity for the CS616 probe:
(
t a) (
a L c)
Ka = /1024−2 1 /2 2+4 / [4]
where t is the probe output in seconds, a1 and a2 are two
fitted parameters: a1 = 5.36×10
-9
s and a2 = -2.41×10
-10
s. Equation 4 was used to calculate the square root bulk dielectric permittivity value from the probe output as shown in Fig. 3. A quadratic equation was used to establish the relationship between the square root bulk dielectric permittivity and the volumetric water content:
2 w w
a c b a
K = + θ + θ [5]
where a, b and c are constants to be determined by the fitting. Figure 3 shows the fitting result for the CS616 probes with a coefficient of determination (R2) of 0.94.
For comparison, the prediction based on the Topp et al. (1980) equation and the manufacturer–supplied calibration equations are plotted in Fig. 3. A calibration equation provided by the manufacturer for CS616 probes has the following form (Campbell Scientific 2004):
2 0006 . 0 0070 . 0 0180 . 0 t t w=− − + θ [6]
where t is probe output in microseconds. Both Topp et al. (1980) empirical equation (Eq. 2) and the manufacturer’s calibration equation (Eq. 6) under-predicted the bulk dielectric permittivity of the soil (Fig. 3).
The soils used in the Topp et al. (1980) calibration were sandy loam and clay loam and Eq. 6 was calibrated by the manufacturer based on a sandy clay loam, which are different from the highly plastic Regina Clay used in this study. As discussed previously, some part of the water in highly plastic clay was bound to the clay mineral surface and had a much lower dielectric permittivity than that of liquid water. Because of large surface area of the Regina Clay, it is expected that the calibration curve of this soil should be below those of the Topp et al.’s (1980) and the manufacturer-supplied. However, Fig. 3 shows that the clay soil used in this study had a bulk dielectric permittivity higher than that of either group of soils used by Topp et al. and Campbell Scientific (2004) for the entire range of water content. This suggests that some other mechanisms are responsible for the observed differences in dielectric permittivity of the highly plastic clay.
5.2 Calibration for ML2x and SM200 probes
Measured by CS616-1 Measured by CS616-2 Calibration equation Campbell Scientific (2004) Topp et al. (1980) 10 8 6 4 2 0 0 0.1 0.2 0.3 0.4 0.5 0.6
Volumetric water content, θw Ka
Ka = - 0.0881 + 28.871 θ 22.666 θ
2 R = 0.94442
w w
Figure 3. Dielectric permittivity as a function of volumetric water content and calibration curve for the CS616 probes
Delta-T Devices Ltd. (1999, 2005) provided the following relationships between the probe output voltage and the bulk dielectric permittivity for the ML2x (Eq. [7]) and the SM200 (Eq. [8]) probes: 3 2 7 . 4 4 . 6 4 . 6 07 . 1 V V V Ka = + − + [7] 5 4 3 2 536 . 13 032 . 46 881 . 60 725 . 38 103 . 16 0 . 1 V V V V V Ka + − + − + = [8]
where V is the probe output voltage (in V). The corresponding square root bulk dielectric permittivity was then calculated with Eqs. 7 and 8 for ML2x and SM200, respectively. Quadratic equations were also used to calibrate the calculated square root bulk dielectric permittivity and the measured water content as shown in Figs. 4 and 5. A similar coefficient of determination (R2 =
0.95) with that of the CS616 probes was achieved for the SM200 probe and a slightly higher coefficient of determination (R2 = 0.98) was found for the ML2x probe.
Also shown in Figs. 4 and 5 is the prediction based on Topp et al. (1980) equation and the manufacturer’s calibration equations. The manufacturer provides the same calibration equation for both ML2x and SM200 probes (Delta-T Devices Ltd., 1999, 2005):
w a
Calibration equation
Delta-T Devices Ltd. (1999)
Topp et al. (1980)
Measured by ML2x
Ka = -
1.157 + 15.778
θ
14.823
θ
2R = 0.9790
2 w w8
6
4
2
0
0
0.1
0.2
0.3
0.4
0.5
0.6
Volumetric water content, θ
wKa
Figure 4. Dielectric permittivity as a function of volumetric water content and calibration curve for the ML2x probe
Calibration equation Delta-T Devices Ltd. (2005) Topp et al. (1980) Measured by SM200 Ka = - 1.878 + 18.077 θ 16.051 θ 2 R = 0.94962 w w 8 6 4 2 0 0 0.1 0.2 0.3 0.4 0.5 0.6
Volumetric water content, θw Ka
Figures 4 and 5 show that the prediction values from Topp
et al. (1980) (Eq. 2) and the manufacturer’s calibration
equation are similar at volumetric water content up to 0.4. However, these equations under-predicted the bulk dielectric permittivity of the soil tested in this study.
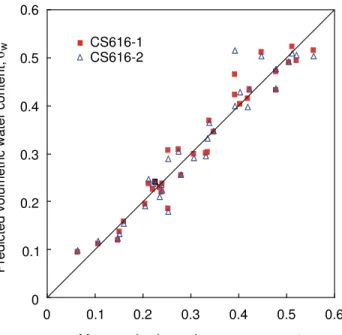
5.3 Comparison between measured and predicted water content
Using the three calibration equations and the measured signal values (travel time for the CS616 probes and voltage for the ML2x and SM200 probes), the volumetric water contents were back-calculated and compared with the measured water content as shown in Figs. 6 and 7. The standard errors of estimate are 3.4%, 3.1% and 3.2% for the CS616, ML2x and SM200 probes, respectively. However, the water contents predicted by CS616 probes have larger scatter than those of the ML2x and SM200 probes. The predicted volumetric water content accuracies for the three types of probes are 0.130 m3/m3,
0.068 m3/m3, 0.074 m3/m3, respectively. Compared with the typical accuracy of ±0.025 m3/m3, ±0.01 m3/m3, ±0.03
m3/m3 for the CS616, ML2x and SM200 probes after calibration to a specific soil as specified in their instruction manuals, the accuracy of the predictions is relatively low. 5.4 Soil density effect
Because of the wide range of soil densities used for the calibration of Eq. 5, the possible effect of soil density on the calibration was also investigated. A linear term was added to the right of Eq. 5 to consider the density effect with the following form:
d w w
a a b c d
K = + θ + θ2+ ρ [10]
where ρd is the soil dry density and a, b, c and d are constants to be determined from fitting the square root dielectric permittivity vs. measured volumetric water content. A least-square fitting was performed for the three probes and a, b, c and d was determined for each of the probes. The calibrated equations were then used to predict the volumetric water content based on the probe output and soil dry density. When compared with the volumetric water content obtained by Eq. 5, no clear trend of improvement was observed by Eq. 10. Further work is required to study the influence of dry density of highly plastic clay to its bulk dielectric permittivity.
5.5 Temperature effect
Figure 8 illustrates the experimental results of temperature effect on the dielectric permittivity of the Regina clay soil. The square root dielectric permittivity, Ka , was
normalized by dividing the value by the corresponding value at 20°C, C T a K o 20
= . The largest temperature
influence on the square root dielectric permittivity occurred to the CS616 probes with a range varying from -8% to +4% for the measured temperature range (4.2°C to 38°C). The ML2x probe had the smallest temperature response
of ±2% for the same measured temperature range. The temperature response of the CS616 and SM200 probes can be best described by quadratic polynomial curves while a linear curve can adequately describe the relationship between the dielectric response of the ML2x probe and the temperature.
0.6 0.5 0.4 0.3 0.2 0.1 0 0 0.1 0.2 0.3 0.4 0.5 0.6 P re di cte d vo lu m et ric w at er co nt en t, θ
Measured volumetric water content, θw
w CS616-1
CS616-2
Figure 6. Comparison of the measured volumetric water content and the predicted volumetric water content for CS616 probes
Figure 7. Comparison of the measured volumetric water content and the predicted volumetric water content for ML2x and SM200 probes
5.6 Electrical conductivity
As observed by Robinson et al. (1999), all measurements made using the three probes were to a greater or lesser extent influenced by the electrical conductivity (EC) of soils. The effect may be significantly higher for the Regina Clay due to its high montmorillonite content. Typically, Regina Clay has a cation exchange capacity (CEC) of 31.7 meq/100g (Fredlund 1976) and, therefore, is very conductive. Signals travelling along the probe surrounded by clay will be attenuated. Mojid et al. (2003) experimented with a Na-bentonite clay (50 percent montmorillonite, CEC of 60 meq/100g, and exchangeable sodium percentage of 90) at various volumetric water contents and found that EC increased with increasing θw from their air dry condition (θw = 16 percent, w = 14 percent) and up to its saturation point (about θw = 60 percent, w= 50 percent). During this water content range, a TDR (Tektronix 1502C TDR cable tester) – measured Ka increased initially from θw = 16 to θw = 24 percent (w= 20 percent). At this point, the energy loss of the TDR waveform due to EC increase became considerable. With further increase in EC due to increased θw, the energy loss also increased and caused attenuation of the waveform. When EC increased to about 3.0 dS/m, the waveform was completely attenuated and the program algorithm failed to analyze it for dielectric permittivity. Figures 3 to 5 indicate that the dielectric permittivity of the Regina clay soil tends to level off around θw = 40 percent. This may be due to the attenuation of electromagnetic waves in the soil.
Figures 3 to 5 also show that the difference between the Topp et al. (1980) curve and the measured dielectric
permittivity is small for the ML2x probe and large for the CS616 with the SM200 in between. This observation may be attributed to the rod arrangement of the probes. ML2x has four rods with one in the centre and the other three around the centre. This rod arrangement can keep the electric field highly concentrated and converged on the central rod; therefore, reduce the energy loss. Conversely, the rod arrangements used by SM200 and CS616 probes produce an unbalanced electric field, leading to a higher energy loss (Jones 2002). In addition, CS616 probes have longer rods than those of the SM200 probes, which may explain the large difference in the CS616 probes because a longer rod leads to higher accumulative energy loss along the entire probe rod.
1.05
1.00
0.95
0.90
5
10
15
20
25
30
35
40
0
Temperature, T ( C)
oK
a
K
(at 20
C)
a
oML2x measured data
SM200 measured data
CS616-1 best fit
ML2x best fit
SM200 best fit
Figure 8. Variation of the normalized square root of dielectric permittivity versus temperature
The differences between the measured and the predicted dielectric permittivity using manufacturer’s calibration equations may also be attributed to the EC. As observed by other researchers, e.g., White et al. (1994) and Topp et
al. (2000) among others, an elevated EC increases the
dielectric permittivity.
Inclusion of an EC term in the calibration may improve the fitting. However, EC was not measured during the tests and, therefore, a quantitative analysis cannot be performed in this study. Further tests on EC effect on dielectric permittivity of Regina Clay is required for including EC in the calibration equation.
6. FIELD APPLICATIONS
Some problems may be encountered in the field when using the tested probes with the Regina Clay. First, the soil is over-consolidated and very stiff to hard. It is difficult
to push or drive the probes into the soil and to keep the rods parallel during the insertion. Some installation guides may help the insertion, but they also bring additional problems, including possible voids between the rods and their surrounding soils. Second, the soil has considerable volume change potential upon changes in soil water content. Periodic swelling/shrinking may produce a network of fine fissures in the soil and possible air gaps adjacent to the probes. Any air gaps between the probes and the surrounding soils may cause an underestimation of water content by the probes (Bridge et
al. 1982). Pre-existing fissures may misguide the rod
during rod insertion and lead to unparallel rods. In addition, large cracks may exist, particularly near ground surface. If the cracks are located between the rods of the probes, they may significantly affect the readings. If the probes are inserted into soil blocks with intervening fractures, the readings from the probes may not be representative of the bulk water contents of the test site. The dielectric permittivity measurements reported in this paper were made on laboratory compacted specimens. The compaction process would have disturbed the original soil structure and made the dielectric behaviour of the compacted soil different from that of the soil in situ. Therefore, it is expected that the field data may exhibit even larger scatter than the laboratory data. Field calibration of the probes using in situ soils, their comparison with the laboratory tests, and their field performance are underway.
7. CONCLUSIONS
Dielectric based probes were calibrated for a relationship between the dielectric permittivity and the volumetric water content of a highly plastic Regina Clay. Two types of dielectric based probes were used for the calibration; namely, a WCR type sensor (Compbell CS616 probes) and an ADR type sensor (Delta-T ML2x and SM200 probes). A second order polynomial equation was found to adequately fit the relationship between the square root dielectric permittivity and the volumetric water content of the soil. Coefficients of determination (R2) were found to
be 0.94, 0.98 and 0.95 for the CS616, ML2x and SM200 probes, respectively, for a soil water content range of about 10 percent to 40 percent. About θw=40 percent, the
calibration is less reliable.
The measurement of soil dielectric permittivity using the CS616, ML2x and SM200 probes showed that all measurements of dielectric permittivity in Regina Clay were higher than the dielectric permittivity predicted from the empirical Topp et al. (1980) equation and manufacturer-provided equations. This may be due to the electric conductivity of the soil. The electric conductivity may also explain the different measured dielectric permittivity by the three probes because different rod arrangements produce different electric field distributions around the rods, which may affect the extent of energy losses in the soil. Further work is required to quantify the effect of the electric conductivity on the calibration equations of the probes and confirm this hypothesis.
The effect of temperature on dielectric measurements was observed for all three probes. The effect is largest for CS616 and smallest for ML2x for the measured temperature range from 4°C to 38°C. The influence of temperature on the CS616 and SM200 probes can be described by quadratic polynomial curves while a linear curve can adequately describe the relationship between the dielectric response of the ML2x probe and the temperature.
ACKNOWLEDGEMENTS
We extend our appreciation to Kendra Svingen and Brad LaFontaine of the Centre for Sustainable Infrastructure Research, Institute for Research in Construction, National Research Council Canada and Ken Tam and Mark Johnston of Clifton Associates, Ltd. for their valuable assistance during the soil test program. We also acknowledge the in-kind contribution of Clifton Associates and the guidance of Wayne Clifton and Dave Kent. References
Bridge, B.J., Sabburg, J., Habash, K.O., Ball, J.A.R. and Hancock, N.H. 1996. The Dielectric Behaviour of Clay Soils and Its Application to Time Domain Reflectometry. Australian Journal of Soil Research, 34: 825-835.
Campbell Scientific. 2004. Instruction Manual: CS616 and CS625 Water Content Reflectometers. Campbell Scientific, Logan, UT, USA.
Dasberg, S. and Hopmans, J.W. 1992. Time Domain Reflectometry Calibration for Uniformly and Nonuniformly Wetted Sandy and Clayey Loam Soils. Soil Science Society of American Journal, 56: 1341-1345.
Delta-T Devices Ltd. 1999. ThetaProbe Soil Moisture Sensor User Manual: Type ML2x. Cambridge, England.
Delta-T Devices Ltd. 2005. SM200 Soil Moisture Sensor Quick Start Guide. Cambridge, England.
Dirksen, C. and Dasberg, S. 1993. Improved Calibration of Time Domain Reflectometry Soil Water Content Measurements. Soil Science Society of American Journal, 57: 660-667.
Fredlund, D.G. 2006. Unsaturated Soil Mechanics in Engineering Practice. Journal of Geotechnical and Geoenvironmental Engineering, ASCE, Vol. 132 (3): 286-321.
Fredlund, D.G. 1976. Engineering Properties of Expansive Clays. Shallow Foundations on Expansive Soils: Design, Construction and Performance. Proceedings of a Seminar held in Regina, SK, October 27 and 28, 1975.
Hansson, K. and Ludin, L. 2006. Water Content Reflectometer Application to Construction Materials and its Relation to Time Domain Reflectometry. Vadose Zone Journal, 5: 459-468.
Herkelrath, W.N., Hamburg, S.P. and Murphy, F. 1991. Automatic, real-time monitoring of soil moisture in a remote field area with time-domain reflectometry. Water Resources Research, 27: 857-864.
Kachanoski, R.G., Van Wesenbeeck, I.J., Von Bertoldi, P., Ward, A. and Hamlen, C. 1990. Measurement of Soil Water Content During Three-Dimensional Axial-Symmetric Water Flow. Soil Science Society of American Journal, 54: 645-649.
Ledieu, J., De Ridder, P., De Clerck, P. and Dautrebande, S. 1986. A Method for Measuring Soil Moisture Content by Time Domain Reflectometry. Journal of Hydrology, 88: 319-328.
Look, B.G. and Reeves, I.N. 1992. Application of Time Domain Reflectometry in Geotechnical Instrumentation. Geotechnical Testing Journal, 15: 277-283.
Malicki, M.A., and Skierucha, W.M. 1989. A Manually Controlled TDR Soil Moisture Meter Operating with 300ps Rise-time Needle Pulse. Irrigation Science, 10: 153-163.
Munoz-Carpena, R. 2004. Field Devices for Monitoring Water Content. Website http://edis.ifas.ufl.edu
Robinson, D.A., Gardner, C.M.K. and Cooper, J.D. 1999. Measurement of Relative Permittivity in Sandy Soils Using TDR, Capacitance and Theta Probes: Comparison, Including the Effects of Bulk Soil Electrical Conductivity. Journal of Hydrology, 223: 198-211.
Topp, G.C., Davis, J.L. and Anan, A.P. 1980. Electromagnetic Determination of Soil Water Content: Measurement in Coaxial Transmission Lines. Water Resources Research, 16: 574-582.
Topp, G.C., Zegelin, S. and White, I. 2000. Impacts of the Real and Imaginary Components of Relative Permittivity on Time Domain Reflectometry Measurements in Soils. Soil Science Society of American Journal, 64: 1244-1252.
Weast R.C. (ed.) 1986. Handbook of Physics and
Chemistry, 67th ed., CRC Press, Boca Raton, FL,
USA.
White, I., Knight, J.H., Zegelin, S.J. and Topp, G.C. 1994. Comments on ‘Considerations on the Use of Time-Domain Reflectometry (TDR) for Measuring Soil Water Content’ by W.R. Whalley. European Journal Soil Science, 45: 503-508.
Wraith, J.M. and Or, D. 1999. Temperature effects on Soil Bulk Dielectric Permittivity Measured by Time Domain Reflectometry: Experimental Evidence and Hypothesis Development. Water Resources Research, 35: 361-369.
Zegelin, S.J., White, I. and Jenkins, D.R. 1989. Improved Field Probes for Soil Water Content and Electrical Conductivity Measurements Using TDR. Water Resources Research, 25: 2367-2376.