Chain End Segregation at Polymer Thin Film
Surfaces
by
Thomas Francis Schaub, Jr.
B.S., Engineering Physics
State University of New York at Buffalo, 1993
Submitted to the Department of Materials Science and
Engineering
in partial fulfillment of the requirements for the degree of
Master of Science in Materials Science and Engineering
at the
MASSACHUSETTS INSTITUTE OF TECHNOLOGY
June 1995
©
Massachusetts Institute of Technology 1995. All rights reserved.
/?
Author . ... . .. . ...
Department of Material Science and Engineering
I//~
--
I
My 12, 1995
Certified by ...
Accepted by
...
...---
,
-,.--
-
...
Anne. Mayes
Class of '48 Assistant Professor of Polymer Physics
Thesis Supervisor
· . - . ·· ·· · ·· I ·
.
·· . . . . .Carl V. Thompson II
Professor of Electronic Materials
Chair, Departmental Committee on Graduate Students
MASSAiGHUSEHTS INSITilFUTE
Chain End Segregation at Polymer Thin Film Surfaces
by
Thomas Francis Schaub, Jr.
Submitted to the Department of Materials Science and Engineering
on May 12, 1995, in partial fulfillment of the requirements for the degree of
Master of Science in Materials Science and Engineering
Abstract
Chain end segregation, the localization of a high polymer's chain-end repeat
units at a surface, has been observed and modelled in this thesis. A series of
polystyrene samples ranging in molecular weights from 4k to 90k were
anioni-cally synthesized and terminated with a functionalized silane group containing
an oligotetrafluoroethylene tail. After characterization, these samples formed
the basis for two related avenues of experimentation. First, x-ray photoelectron
spectroscopy and neutron reflectivity (NR) studies were performed on thin films
of neat end-functionalized polymer samples to measure chain end segregation.
Complete segregation of chain ends to the air surface and substrate interface
was seen in films less than 4RG in thickness. Next we explored the
possibil-ity of utilizing chain end segregation as a means of controlling the properties
of a polymer surface. AB/A blends consisting of end-modified polymers and
high molecular weight polystyrenes were studied using NR as a function of the
blend concentration. Our results indicate that a high fraction of end-modified
polymer localizes near the surface. To complement both sets of studies,
con-tact angle measurements were taken to observe what effect these structural
changes have upon surface properties. In each case, the surface energy is found to be lower for higher surface concentrations of chain ends. Results from a free
energy model of the blend systems are compared with the experimental results
from the blend studies.
Thesis Supervisor: Anne M. Mayes
Acknowledgments
The last two years at MIT have been an exciting part of my life. I'm grateful that I've been able to draw upon the wealth of knowledge that the people who make up the MIT community have to offer.
For their support, both professional and personal, I would like to
acknowledge the people without whom this thesis would not have
materialized:
To Prof. Anne Mayes whose talent and dedication have never ceased to amaze me. As one of Anne's first graduate students, I think we've
both learned alot; at least she can't say I left her with any more gray
hairs for her efforts.
To Drs. Greg Kellogg and Bruce Carvalho who shared their wisdom freely. Their input for this work was virtually continuous; 20% is on the way guys.
To Dave Walton who taught me alot about how to use computers. Maybe Andersen got things mixed up.
To Ish Modak who has been a special and integral part of my life for
the last year. Her constant encouragement kept me going at times I
didn't think I'd make it.
To my parents and family whose generous love gives me the confi-dence I need. Thank you for the freedom to pursue my aspirations.
To the many others who have played important roles in conjunction
with my experience here at MIT, especially: Neal Mitra, Roland
Ayala, Mark Brillhard, Doris Lee, Jeff Baur, Jason Gratt, Jimmarie
Contents
1 Introduction 9
2 Chain End Segregation
13
2.1 Evidence for Chain End Segregation ... 13
2.2 Surface Properties: Chain End Segregation ...
17
3 Free Energy Model 20 3.1 Model Development ... ... 20
3.2 Results of Model ... 26
3.3 Conclusions ... 28
4 Experimental Procedure
32
4.1 Synthesis of End-Functional Polystyrenes ...
32
4.1.1 General Description of Anionic Synthesis ... 32
4.1.2 Synthetic Experimental Procedure ...
35
4.1.3 Polymer Characterization ... 36
4.2 Investigative Techniques ...
...
40
4.2.1 X-ray Photoelectron Spectroscopy ... 40
4.2.2 Contact Angle Measurements ... 41
4.2.3 Neutron Reflectivity ... 41
4.3 Sample Preparation ...
...
44
5 Results and Discussion
47
5.1 Chain End Segregation ...
47
5.1.1 Scaling Relations ... ... 47
5.1.2 Reflectivity Studies ... 50
5.1.3 Contact Angle Measurements . . . ... 51
5.2 End Functional Polymer Blends ... 55
5.2.1 Reflectivity Studies ... 55
5.2.2 Contact Angle Measurements ... 72
6 Conclusions 75
7 Recommendations for Future Work
76
A Free Energy Model Source Code
79
B GPC Chromatograms of End-Modified Polystyrenes
82
C NMR Spectra of Selected End-Modified Polystyrenes
87
List of Figures
2-1 Perturbed polymer conformation at a surface ...
...
14
2-2 The three regimes of chain end segregation. . . . 14 3-1 Schematic illustration of the free energy model for AB/A blends . 21
3-2 Matrix molecular weight model variations, h=750A, N=65. . ...
29
3-3 Additive molecular weight model variations, h=750A, Nh=3856. . 30 3-4 Sample thickness model variations, N=65, Nh=386, X = .05. . .. 31
4-1 Initiation of deuterated styrene by sec-butyllithium ...
33
4-2 Propagation of deuterated styrene ...
33
4-3 Termination of propagating deuterated styrene anion ...
34
4-4 Tg dependence on M, for end functionalized PS and dPS polymers. 38 4-5 FTIR results: Chain end concentration versus molecular weight. 39 4-6 (A) Example of droplet used for contact angle measurements. (B)
Schematic illustration of force balance in contact angle
measure-ments ...
42
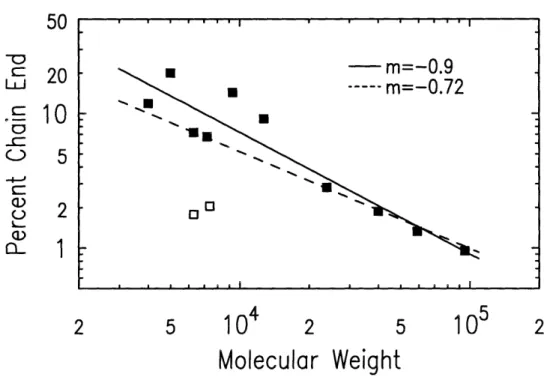
4-7 Simple geometry for neutron reflectivity ... 44 5-1 Scaling factor determination for bulk chain end concentration. . 48
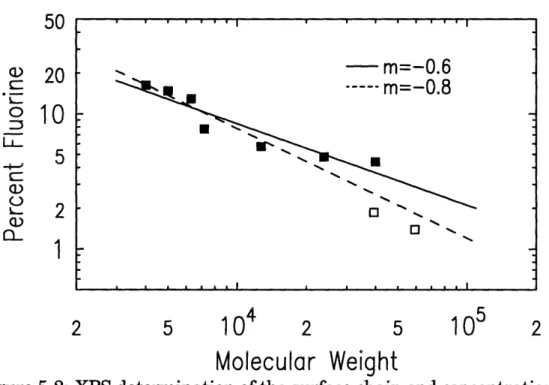
5-2 XPS determination of the surface chain end concentration....
49
5-3 Thin film NR studies on 7k dPS-TFE sample ... 52 5-4 7k dPS-TFE thin film assuming no chain end segregation .... 53 5-5 Equilibrium contact angles as a function of molecular weight... 54 5-6 4k PS contact angle measurement. 0e = 95° . ... 56
5-7 4k PS-TFE contact angle measurement. 0e
=102
°...
56
5-8 90k PS contact angle measurement. 0e = 970 ... 57
5-9 94k PS-TFE contact angle measurement. 0e = 970 ... 57
5-10 NR profiles for AB/A concentration studies ... 59
5-11 NR profiles for AB/A concentration studies ... 61
5-12 Volume fraction of end-functionalized component in AB/A blends. 63 5-13 Surface excess for the 7k dPS and 7k dPS-TFE blends. ... 65
5-14
NR
profiles
for
AB/A
concentration
studies
... 66
5-15 Volume fraction of end-functionalized component in AB/A blends. 68 5-16 Surface excess for 7k dPS-TFE and 6k PS-TFE blends. ... 70
5-17 Summary of AB/A blend studies. ... 71
5-18 Contact angle measurements for PS matrix blends. ... 73
5-19 Contact angle measurements for dPS matrix blends ...
74
7-1 Thin film sample exhibiting complete chain end segregation. . .
77
B-1 GPC chromatogram of sample #1. 83 B-2 GPC chromatogram of sample #2. ... 84 B-3 GPC chromatogram of sample #3. ... 85 B-4 GPC chromatogram of sample #4. ... 86 C-1 NMR spectrum of 500 PS-TFE ... 88 C-2 NMR spectrum of 6.3k PS-TFE ... . 89 C-3 NMR spectrum of 7.2k dPS-TFE ... 90
List of Tables
3.1 Parameter values used in free energy model ...
25
4.1 4.2 4.3 4.4
GPC molar mass results ...
36
DSC Tg measurement results ... 37
DSC Tg measurement results ... 37
Material constants used in reflectivity analysis ...
45
5.1 Summary of 7k dPS-TFE/400k PS Concentration Studies 5.2 Summary of 6k PS-TFE/300k dPS Concentration Studies
... . 69
Chapter 1
Introduction
When considering the suitability of a material for a particular design
appli-cation, some of the most important factors to be taken into account are the
surface properties of the material. There are at least two reasons why special
attention must be given to a material's surface properties: first, the properties
desired at the surface are often specific and distinct from the bulk properties
of the material; and second, materials may exhibit different structural
charac-teristics near a surface which will affect the material's properties. Examples of
properties affected by polymer surface structure include adhesion, wettability, friction, permeability, stain resistance, gloss, corrosion, surface electrostatic charging, cellular recognition, and biocompatibility [1]. From this perspective
it is easy to understand why such a large volume of research has been directed
at understanding the nature by which surfaces modify polymer structure and
at using this knowledge to control the surface properties exhibited by polymers.
Classically, control of a material's surface properties has been achieved by modification of the surface through various chemical or physical processes. The most common surface modification techniques include plasma treatment [2, 3], surface grafting [4, 5], chemical reaction [2, 6], vapor deposition of metals [7], and flame treatment [8]. Such kinetically governed reaction mechanisms how-ever, allow relatively little control over the final surface composition and
small molecules or oligomeric additives which migrate to the polymer surface [9]. Because they are not strongly bound to the polymeric matrix however, such
additives may compromise the polymer's bulk physical properties by diffusing
away from the surface; they may also be removed altogether by evaporation, for example.
One recent innovation in the attempt to gain careful control of the
sur-face composition and properties, while maintaining the structural integrity of
the bulk matrix, has been to chemically synthesize polymers which have
"sur-face specific" tails of various functionalities [10]. Preliminary results indicate
that using end-functionalized polymers with low energy fluorocarbon tails
en-hances the surface concentration of these chain ends; more studies are needed
however. These end-modified materials have also been employed in the
syn-thesis of high molecular weight lipophilic polymers
-
such as polystyrene,
poly(methyl methacrylate), and styrene-butadiene rubber
-
using
supercriti-cal carbon dioxide (CO2) as a solvent, whereby the fluorocarbon moiety acts to
stabilize the growing chains in the CO2 [11, 12, 13]. The attractiveness of this
synthetic route from an environmental standpoint could ultimately lead to wide
scale production of such end-functionalized polymers, making their application as surface modification agents commercially feasible.
The mechanism behind this concept of surface control is explained by
under-standing the role a surface, or non-interacting interface, plays in modifying the
enthalpic and entropic forces governing a polymer's behavior near an
impene-trable boundary. In the bulk
-
in the absence of strong enthalpic interactions
- polymer chains typically take on a so-called random coil conformation, where
the physical orientation of each repeat unit along the chain's backbone is
essen-tially uncorrelated with the orientations of the chain's other repeat units. The
presence of a surface, however, places tight constraints upon the conformations
of chains near the surface such that the random coil conformation is perturbed.
To alleviate this entropically unfavorable situation and lower the overall free
energy of the system, it has been predicted [14] that polymer chains in the
vicinity of the surface will segregate their chain ends to the boundary, thereby
avoiding the unnecessary entropic penalty.
An argument which may be made against surface control via end-modified polymers is that although it is technologically possible to synthesize such poly-mers, the cost of doing so would be prohibitively expensive. To circumvent this problem, one alternative is to blend the high-cost, end-functionalized polymers with low-cost, widely available commodity plastics, referred to as AB/A blends. The anchoring portion of the end-functionalized polymer is chosen to match the commodity plastic, while the end-functionalized tail is selected to deliver the
desired surface properties. A recent study on block copolymers [15] suggests
only small amounts of specially synthesized polymers may be needed to obtain appreciable levels of surface enrichment of the low surface energy component, and hence control of the surface properties.
The present work explores two aspects of chain end segregation. In each case the primary vehicle by which chain end segregation phenomena are in-vestigated is a series of anionically synthesized functionalized (or end-modified) polymers of various molecular weights. The first avenue examined is the dependence of molecular weight on the degree of chain end
segrega-tion. To study this relationship, three experimental techniques are used: x-ray
photoelectron spectroscopy (XPS), neutron reflectivity (NR), and contact angle measurements. The second avenue pursued is the usage of end-modified
poly-mers in AB/A blends. To undertake this examination, a theoretical description
of the systems being studied is first developed and used to help anticipate
ex-perimental results. Experiments are then conducted using NR to assess and
measure the extent to which end-modified polymers segregate as a result of
their low surface energy tails.
This thesis is divided into seven chapters. Chapter 2 contains an in-depth
review of previous works performed on chain end segregation and its related topics. Chapter 3 presents a discussion and results of a free energy model devel-oped and executed to predict the degree of chain end segregation in AB/A blends.
Chapter 4 describes the experimental procedures used in this investigation,
in-cluding the anionic synthesis and characterization of the end-functionalized
polymers by gel permeation chromatography, differential scanning calorimetry,
and fourier transform infrared spectroscopy; additionally, basic explanations
of x-ray photoelectron spectroscopy, contact angle measurement, and neutron
reflectivity analyses are provided; lastly, details of the techniques used in the
sample preparation are given. Chapter 5 presents the results and discussion
of this effort. Chapter 6 is a summary of the conclusions to be drawn from
these studies. Finally, chapter 7 suggests directions which future studies of
chain end segregation may take. Appendix A includes the Fortran source code
for the free energy model presented in chapter 3. Appendix B provides GPC data as a supplement to chapter 4. Appendix C illustrates NMR spectra for the end-modified systems synthesized for this study.
Chapter 2
Chain End Segregation
2.1 Evidence for Chain End Segregation
In bulk, amorphous high polymers typically take the conformation of a random
coil. Physically this model is essential in explaining many polymer phenomena,
such as the dynamic and thermodynamic properties of polymer melts [16]. Polymer chains having random coil conformations can be characterized by the
most probable end-to-end distance RG, also known as the root mean square
(rms) end-to-end distance, given by equation 2.1, where N is the number of
chain segments and a is the statistical segment length.
RG = N1/2a
(2.1)
In the vicinity of a surface or non-interacting interface, however, the random
coil conformation is perturbed. To minimize the loss in conformational entropy,
polymer molecules within one rms distance of the surface may localize their
chain ends to the surface (see figure 2-1) [14] and thereby avoid the required
"reflection" at the material boundary.
DeGennes has explored this concept in greater detail, and has expressed
this tendency in terms of a preferential attraction between the terminal (chain
entropically
unfavorable
surface
polymer
Figure 2-1: Perturbed polymer conformation at a surface
given by:
Aa 2
u = kbT (2.2)
where A is the difference in surface tensions, 7 -
end,between a hypothetical
chain with no ends and a real chain's terminal groups, a
2is the surface area per
monomer, and the product kbT is the thermal energy at temperature T.
Accord-ing to his explanation, three regimes of behavior can be delineated dependAccord-ing
on the magnitude of u. Figure 2-2 presents a brief schematic to help illustrate
the nature of the behavior endemic to each regime:
I
ro
_
K\1
weak
intermediate
strong
Figure 2-2: The three regimes of chain end segregation
Regime I (u < 1): In the weak regime the surface does not perturb the chains,
hence the random coil conformation is not compromised. The surface
volume fraction of chain ends is effectively equal to the bulk qp, and the
surface tension is 7y - Ap.
Regime II (u - 1): In the intermediate regime all chain ends within RG of
the surface will be localized at the surface. From this it follows that the
concentration of chain ends near the surface, 0qs, will equal (RG/a)qp. Regime III (u > 1): In the strong segregation regime A is of such magnitude
that chains will stretch to accomodate more chain ends per unit surface
area. The increased concentration of chain ends at the surface is limited
by the increase in elastic free energy of the chains near the surface.
Theoretically, chain end segregation has been predicted on the basis of
mean-field calculations, as well as molecular dynamics and Monte Carlo simulations. Mean-field results for the case of end-modified polymers predict a preferential
adsorption of the surface active "head", even in the absence of an interaction
parameter (i.e. X = 0) [18]. This finding was explained on entropic grounds,
as chain end segments have fewer constraints than mid-chain segments. The
molecular dynamics results showed an excess of end groups in the region
near-est the gas phase (i.e. the outermost region) with an excess of "middle" groups
in the region immediately beneath the first. The authors suggest that a middle
group in the outermost region is energetically unfavorable and may force the
chain into an unfavorable "horseshoe" conformation [19, 20]. Finally, Monte
Carlo results showed the occupancy of end groups in the first sublayer next to
an interface more than twice as large as the bulk average [21].
Experimental evidence for the segregation of chain ends to the surface of
polymer melts is currently limited. In one study, Meyers et al. used atomic force microscopy to probe the surface of amorphous polystyrene (PS) systems of various molecular weights [22]. Surface patterns were observed analogous to
These results were interpreted as evidence that the nature of the PS surface is
elastic, even though the bulk glass transition falls at around 110
0C. The authors
further noted a clear molecular weight dependence in the characteristic spacing
of the observed surface modulations. These results suggest a depression of the
surface Tg as evidenced by the lower elastic modulus at the surface relative to the bulk. Though not explicitly stated, chain end segregation could account for
the author's findings [23].
A more direct verification for chain end segregation has recently been
re-ported by Zhao et al. [24] using neutron reflectivity (NR). Their study utilized
a deuterated polystyrene (dPS)/PS/dPS triblock of M, = 65.6k. Experimental
results indicated that the labelled dPS ends did in fact segregate to the surface.
The authors claim that the best model to account for their data indicated a
two-times excess of chain ends at the free surface. This result is questionable
however, since it did not properly account for a depletion region beneath the
surface excess region where a paucity of chain ends would be expected had
chain end segregation actually occurred.
In another study, Botelho do Rego et al. [25], used high resolution elec-tron energy loss spectroscopy (HREELS), a vibrational spectroscopy technique
sensitive to isotopic substitutions in polymer chains, to measure the relative
abundance of triblock components near the surface. A M,=10.4k dPS/PS/dPS polymer was used, with each of the dPS segments being approximately 2 repeat
units in length. In HREELS the recoiling energy of inelastically backscattered
electrons is measured such that peaks appear in the spectra at energies
cor-responding to the molecular vibrational energies of the material being probed.
An end-segment concentration of twice the bulk value was reported near the
surface, followed by a depletion region, such that the total penetration depth
probed by the electron beam was approximately 10A.
In a related work [26], Affrossman et al. attempted to isolate the impact of
the chemical nature of the chain ends upon surface segregation. In addition
was synthesized having PS tails each approximately 3 segments in length.
Using static secondary ion mass spectroscopy a 300% surface excess of the PS ends in the PS/dPS/PS triblock, and a 400% surface excess of dPS ends in
the dPS/PS/dPS triblock was observed. Since the complementary results rule
out a large surface energy difference between perdeuterated and hydrogenated
materials, the authors conclude from this experiment that there is a natural
tendency for chain ends to segregate to the surface.
Finally, Elman et al. [10] recently examined the effects of polymer
function-alization upon chain end segregation. In their study anionic synthesis was
used to make PS/dPS diblocks with high energy (repulsive) end groups, low energy (attractive) end groups, and neutral (control) end groups. Their results qualitatively suggest a depletion of the high energy carboxylic acid end groups and a surface excess of the low energy fluorocarbon chain end groups in the
re-spective experiments. The authors further noted the importance of the initiator
fragment capping the chain at the end opposite the terminal group, suggesting
that surface adsorption of the fragment occurs in all three cases.
2.2 Surface Properties: Chain End Segregation
The presence of chain ends affects both bulk and surface properties. In bulk,
measurements on polymeric materials have shown that many physical
proper-ties, such as density and yield strength, obey a scaling relation of the following
form [27, 28]:
P = P - kb/M.
(2.3)
In this relation P is the bulk property of concern, P is the bulk property
of a hypothetical infinite molecular weight polymer,
kbis a parameter which
depends on the specific polymer's properties and M, is the number average
molecular weight [29]. This relationship captures the effect which chain ends
have upon the polymer's bulk properties. Since the volume fraction of chain
ends, q,, in the bulk is 2/N, the larger the molecular weight, the smaller the
contribution made by chain ends to the property.
A relationship similar in form to equation 2.3 has been observed for surface
tension [30, 31, 14]:
7
=
o - ka Mn.'(2.4)
where
ais the surface tension,
-y.
is the extrapolated surface tension of an
infinite molecular weight polymer where the effects of chain ends are negligible,
and k, is a material parameter. The scaling exponent, x, has been found to have
a value on the order of 2/3 depending on the polydispersity and molecular weight
of the system [29, 32]. The fact that the exponent is less than 1 suggests that
chain ends are attracted to the surface thus enhancing their contribution to
this surface property.
The predicted increase in surface concentration of chain ends for systems
in the intermediate and strong regimes may also have important consequences
on other surface properties. Mayes has suggested that an excess concentration
of chain ends will lead to a depression in the glass temperature of the surface
region, T,, [23]. Assuming intermediate regime behavior for a system, q, can
be expressed in terms of the number of chain segments by substituting for RG
and Oa in the 0q relationship
RG (N1/2a) 2 2
A a
= (
a
) N
=
N/ 2(2.5)
Whereas the bulk concentration of chain ends scales as N
- 1, the surface
con-centration scales as N
-1/ 2,and the surface glass temperature depression is
expressed as follows:
ATq,
8= T,. - Tg,
8= C/N1/2.
(2.6)
The magnitude of this depression can be quite sizable even for high polymers,
surface in mind.
Another example of how chain end segregation can be used to control surface
(and interfacial) properties was recently presented by Norton et al. [33]. Their
study utilized a series of carboxylic acid terminated deuterated polystyrene
(dPS-COOH) samples to enhance adhesion at a thermoset-thermoplastic
inter-face. Since the end-functionalized tail grafts to the epoxy resin, a large increase
in fracture toughness may be expected to result. Their studies showed that for
the optimized surface density of dPS-COOH, an increase of over 20 times the
Chapter 3
Free Energy Model
3.1 Model Development
A free energy model was developed to describe the segregation of chain ends at a surface or non-interacting interface in AB/A polymer blend films. The
approach taken in developing this phenomenological model is similar to that
followed in the development of models for the formation of micelles [34, 35]. The system modelled has two components, an end-modified polymer (AB) of N
total segments, with short, low surface energy tails (represented as B), and a
homopolymer (A) with Nh segments. The localization of the low energy chain
ends at the surface is assumed for the end-modified chains in the near-surface
region. The free energy of the system is constructed with reference to a bulk
state where the two components are completely separated.
The overall expression of the free energy which describes this system has the following form:
Ftotal = Fsurf + Fmix
where Furf is the free energy of the near-surface region, and Fmi is the
Flory-Huggins free energy of mixing for the two polymers outside the near-surface
region. Figure 3-1 depicts the geometry assumed for this model. At the surface,
L 1 surface near-surface region "bulk" region h
Figure 3-1: Schematic illustration of the free energy model for AB/A blends
region where the anchored chains and the matrix homopolymer are expected to
mix. In the bulk region, end-modified polymers which do not segregate to the surface intermix with unmodified homopolymers.
The free energy Fs,,,rf of the near-surface region can be broken down into three components as follows:
Fsrf = Air +- .Fd + m (3.1)
Aia
represents the contribution from the interfacial tension,
Fdrepresents the
contribution from the deformation of the polymer chains, and
JFmrepresents
the Flory-Huggins free energy of mixing for the AB and A polymers in the
near-surface region.
The first term derives from the difference in surface tensions between a chain
end and a main chain segment. The free energy expression for Aia is equal to the surface area, L2, multiplied by the thermal energy kbT, multiplied by the surface fractions covered by each of the system's three components, i.e. end-modified
chain end segments, end-modified anchoring segments, and homopolymer main
chain segments. Using data taken from [9], this is expressed as:
2 - 2pa2 L2 - 2pa2 2pa2
kbTL2 {rlYAAB( L2 ) + (1
- )AA( L2 ) + 0.803 L2 (3.2)
where
is the fraction of A monomer in the near surface region from
end-modified polymer, AA, is the surface tension of the end-modified polymer's A block, 2pa2 is the portion of the surface covered with end-modified tails, and /YAA
is the surface tension of the A homopolymer. Captured in this term is
the tendency for the system to lower its free energy by localizing the lower surface tension B component of the end-modified polymer to the surface. Alsoincorporated in the model through this term is the dependence of the surface
tension on the molecular weight of the end-modified polymer and homopolymer;
from equation 2.4 the molecular weight dependence can be expressed as:
Ai = YA,oo -
kM,
12/3.(3.3)
The next term,
Fd,is the deformation term. Deformation energy results from
a contraction or elongation of the end-modified chains from their unperturbed, random coil dimension. The specific form of this term is given as:
3 12 i fNa2
kbTP[f Na +
-
12
1(3.4)
kbP[2 fNa2 6 12 ]
where fN is the number of statistical segments in the A block of the
end-modified polymer. This term is needed in part to counterbalance the first term;
while a lower free energy can be achieved by localizing chain ends to the surface, a point is reached whereby chains must stretch to accomodate more ends. This
is a very unfavorable conformation for individual chains to assume, and in the
second regime the savings in free energy is not sufficient to overcome such a high entropic penalty.
The last contribution to the near-surface free energy,
Fm,is the mixing
in the near-surface region, given as:
L21kbT ln (1-) ln(1 - (
3
-Inq+
l
n( - )}
(3.5)
where I is the thickness of the near-surface region, NA is the number of
statis-tical segments in the anchoring portion of the end-modified polymer, and
Nhis
the size of the homopolymer. The mixing entropy is increased by increasing the amount of homopolymer in the near-surface region. If, however, this concen-tration becomes too large, the A blocks will be elongated, which is energetically
unfavorable. Also, with increasing homopolymer fraction, the surface coverage of low energy tails decreases.
A complete model must allow for the possibility that not all end-modified chains will segregate to the near-surface region. To account for this, Fmiz, the Flory-Huggins free energy of mixing between the homopolymer and
end-modified chains remaining outside the near-surface region, is included in the
total free energy; it has the following form:
Fmix = kbTQ(l -
ryAW){-
N Iln l + Nh I) n(1 - )} (3.6)where W, is the concentration of end-modified polymer in the bulk region, Ayl
is the volume fraction of the system occupied by the near-surface region, and
Q is the total number of monomers in the system. Note that the mathematical
form of this term is identical to that of equation 3.5; this follows from the fact
that both contributions to the total free energy arise from the same physical
basis, the arguments are changed to accurately depict the components being
mixed.
In order to minimize the free energy of the system for a given set of param-eters, more information is needed. One assumption which can be made is that
the material has a constant density, or in other words, that the system is
in-compressible. In making this statement the assumption is also made that both
the chain end and main chain units have the same persistence length, or
effec-tively the same size. Strictly speaking this is not a fully accurate assumption,
but given the small portion of the system which is composed of the modified
end units, the error is minimal. Thus, incompressibility can be quantitatively
stated as follows:
Qa3 = L2h (3.7)
where Q represents the total number of monomers in the system, and h
repre-sents the thickness of the system as shown in figure 3-1.
This model assumes segregation to a single surface of a film of finite
thick-ness. In the near surface region, the number of segments contributed by the
end-modified polymer chains, pN, is related to Q through:
pN = 2 a (3.8)
where V is the concentration of end-modified polymer in the system, and -y is the
fraction of end-modified polymers which segregate to the near-surface region. Additionally, I can be eliminated from the model equations by redefining it
in terms of the system's other parameters:
1 = pNAa3/L2 (3.9)
where A = f/ l + (1- f).
The variables and expressions used in the model are summarized in
ta-ble 3.1.
At this point in the development of the model, the two constraint equations,
3.7 and 3.8, plus the definition of 1, equation 3.9, are used to define the problem in terms of two variables: 7 and 7. To obtain solutions, the total free energy of the system per monomer Ftotall/kbT, is minimized with respect to these two variables. A FORTRAN program which computes values of Ftotat and deter-mines the lowest point on the closed bounded region for V and y between 0 and
Table 3.1: Parameter values used in free energy model
symbol description
concentration of end-modified polymer in homopolymer
N
total number of statistical segments in end-modified polymer
[ N = NA + NB ]
f A-block fraction of end-modified polymer
[
= NA / N ]Nh
number of statistical segments in A homopolymer
c ratio of length of end-modified polymer to homopolymer
[= N/Nh ]
fraction of A monomers in near-surface region contributed by the A-block of end-modified polymer
1 - V remainder of near-surface region A monomers, composed of
interpenetrating homopolymer chains
A fraction of monomers which segregate to comprise near-surface region [= f/rl + (1 - f)]
p
the total number of end-modified chains comprising the
near-surface region
ap(l - r7)/2r the total number of homopolymer chains comprising the
near-surface region
-y fraction of end-modified polymers which segregate
'Pl concentration of end-modified monomers in volume outside the
near-surface region [= W(1 - 7)/(1 - o7yA)]
Wo-A
volume fraction of system occupied by near-surface region
f2
total number of monomers in the system
Q(1 - VpyA) total number of A & B monomers outside the near-surface
appendix A.
3.2 Results of Model
Three sets of parameter variations were performed utilizing the model to test
its predictive capacity.
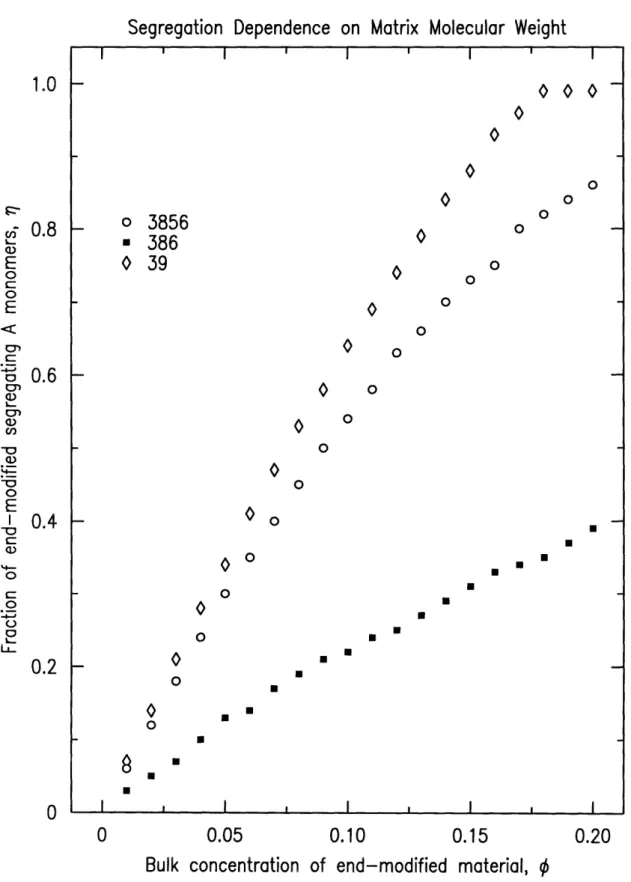
In the first set of model variations, the fraction of polymer in the near-surface
region is studied as a function of the bulk concentration of end-modified
mate-rial for three different matrix molecular weights. The number of segments in
the end-modified additive is held constant in this series at N=65 (modeling a 7k
dPS-TFE material). The matrix molecular weights were chosen as Nh=39, 386, and 3856 (modeling a 4k, 40k and 400k PS matrix, respectively). The sample
thickness, h, was held constant at 750A. The results of the matrix molecular
'weight variations can be seen in figure 3-2. The model clearly shows that as
ma-trix molecular weight is increased, the fraction of end-modified material near
the surface increases for any given bulk concentration of end-modified material.
The model also predicts that as the bulk concentration of end-modified material
is increased, the fraction of end-modified material in the near-surface region
:increases. For the highest matrix molecular weight sampled, when the additive
concentration reaches 17.5%, the near-surface region is composed entirely of end-modified material as indicated by the model.
The results in figure 3-2 can be interpreted by understanding the depen-dence of the free energy on molecular weight. As the molecular weight of the
matrix component increases, the contribution from the mixing entropy
(equa-tions 3.5 and 3.6) to the overall free energy of the system decreases, while the energetic savings afforded by localizing the end-functional polymers near the
surface (equation 3.2) increases. The fraction of end-modified chains in the
near-surface region increases roughly linearly with increasing bulk
concentra-tion up to saturaconcentra-tion, when the near-surface region is composed entirely of
end-modified material.
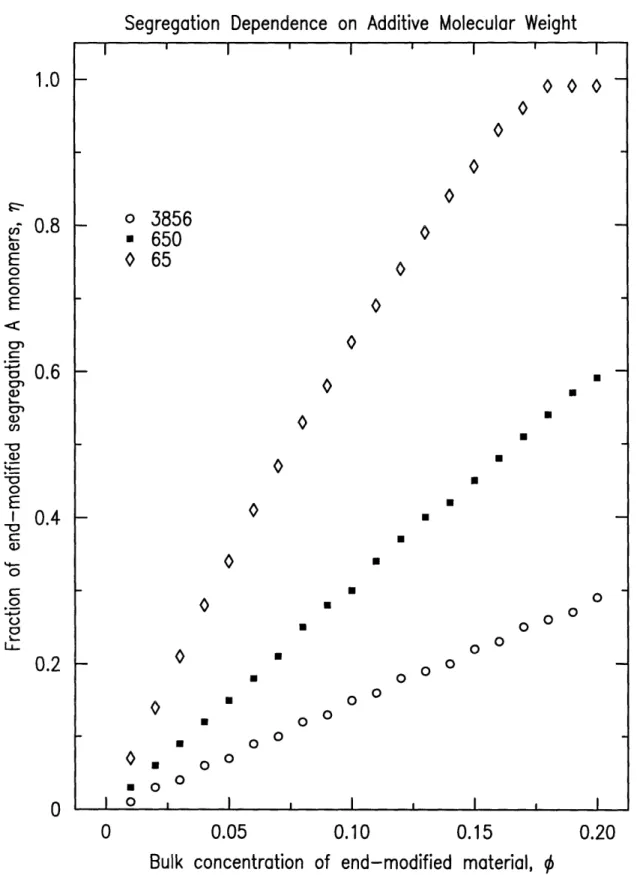
In the second set of model variations, the fraction of polymer in the
near-surface region is studied as a function of the bulk concentration of end-modified material for three different end-modified (or additive) molecular weights. The
matrix in these tests was held constant at Nh=3856 (400k PS). The additive
molecular weights were N=65, 650, and 3856 (7k, 70k, and 400k PS
respec-tively). The sample thickness was held constant at 750A. The results of the
additive molecular weight variations can be seen in figure 3-3. The trend
of increasing end-modified fraction in the near-surface region with
decreas-ing additive molecular weight can be seen for any given bulk concentration of
end-modified material.
The molecular weight dependence exhibited in this set of variations can
be explained by the fact that the end-functionalized tail is the same size for
each molecular weight. Hence for higher molecular weights, the tail becomes
less effective in anchoring the longer chains to the surface. The blends remain
mixed to avoid the entropic penalty associated with inhomogeneities in the
concentration profile. For equal matrix and additive molecular weights, the
ratio of 0, to OS is approximately 3:2.
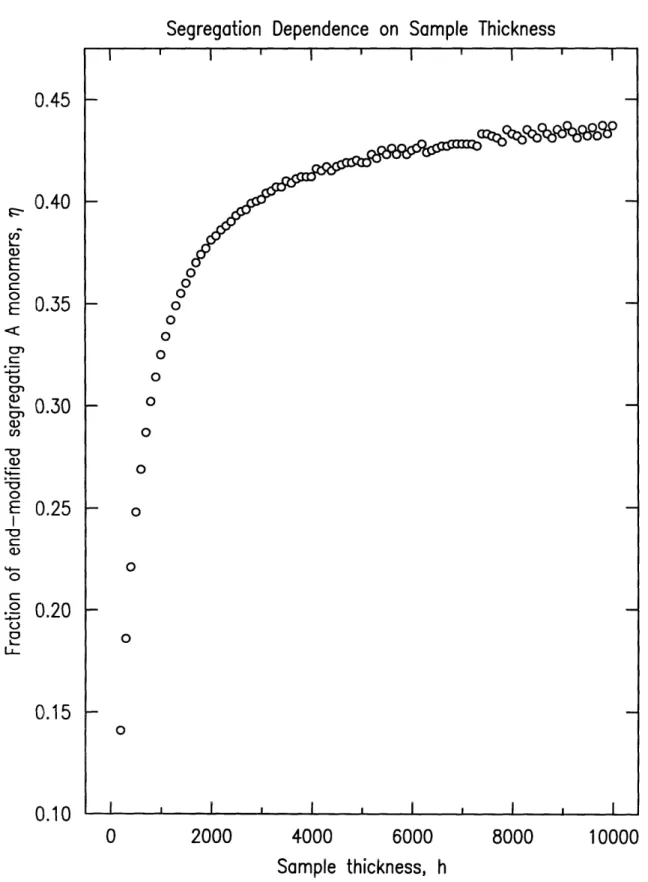
The last model variation carried out was a test of the degree of segregation as
a function of the sample's thickness, h, keeping the molecular weights constant
at N=65 and Nh=386. The bulk concentration of end-modified material also
remained fixed at = 0.05. The results of the sample thickness variation study
are shown in figure 3-4 for the thickness range 200 < h < 10, 000A. The
overall trend is for increasing
Vas the sample thickness increases, but the rate
of increase in r is continually slowing as h is increased. Between 0 and 1000h,
7; increases very rapidly, but asymptotes to approximately = 0.45 at larger
thicknesses.
The trends observed with film thickness variation can be explained as
fol-lows. For very thin films, any appreciable amount of additive segregation will
significantly deplete the concentration in the interior, unfavorable from the
standpoint of mixing entropy. For thicker samples the surface to volume ratio
decreases and an increase in the surface concentration is energetically
favor-able. The surface concentration is limited, however, by the deformation of the anchored chains, and hence 7r is seen to level off with increasing thickness.
3.3 Conclusions
Several predictions have been made using a phenomenological free energy
model developed to study the surface segregation of end-modified chains in thin film AB/A polymer blends. Increasing segregation was observed with
in-creasing molecular weight of the A matrix, dein-creasing molecular weight of the
AB additive and increasing film thickness. Experiments relating to these
pre-dictions are reported on in the remainder of this thesis. It should be pointed
out that computer modelling is intended here as a complement to
experimenta-tion, to give us a measure of the physical forces governing the thermodynamic
Segregation Dependence on Matrix Molecular Weight ' I o 3856 * 386 0 39 I I 0 0 0 0 0 o 0 o 0 O o 0 0 0 . . 0 . U . . o . . 0 . 0 . U . . . . 0 0 . . . . . I I 0 0.05 0.10 I 0.15 0.20
Bulk concentration of end-modified material,
Figure 3-2: Matrix molecular weight model variations, h=750A, N=65.
1.0 Ca .1_ c, E
0
O E C" a) Cn E I0
--0
L._ t,-0.8 0.6 0.4 0.2 0 I I I I I_
1 I I I ISegregation Dependence on Additive Molecular Weight ' I I I o 3856 * 650 0 65 . . . . . . . . . . . 0 . . . . . . . I 0 U 0 0 o 0 0 0 o 0 0 0.05 0 o
0o
0
0 o0o
0
0.10 0.15 0.20Bulk concentration of end-modified material,
Figure 3-3: Additive molecular weight model variations, h=750A, Nh=3856.
1.0 0.8 0.6 0.4 C,, ) E cn C O E C" Ci . ,
a
CI 0 0 O (. O --O .) 0.2 0 I I I I I I l I l I I ISegregation Dependence on Sample Thickness 2000 I - I I 4000 I 6000 I I 8000 Sample thickness, h
Figure 3-4: Sample thickness model variations, N=65, Nh=386, = .05.
I 0.45 0.40 C,_ E
t-o
0 E C: ci: a,) a,r
._ 0 O2 E~ lb i, 0.35 0.30 0.25 0.20 0 0 0 0 0 0 0 0 0 0 0 0 0 0 0.15 0.10 I 0 10000 I I I I I_
IChapter 4
Experimental Procedure
4.1 Synthesis of End-Functional Polystyrenes
4.1.1 General Description of Anionic Synthesis
The end-functionalized polystyrenes used for study in the present work were
synthesized via a chain-growth polymerization mechanism known as anionic
synthesis. The essence of this technique is the addition of electrophilic monomers, dispersed throughout a solvent, to a propagating anionic
nucle-ophile. Perhaps the most important feature of anionic synthesis is the absence
of an inherent termination process. As a result, anionic polymerization is well
suited for making end-functionalized polymers; the synthesis will remain
"liv-ing" until capped (or terminated) with the desired chemical end group [36]. Anionic synthesis can be ideally considered as consisting of three stages:
initi-ation, propaginiti-ation, and termination.
Organolithium compounds -
such as sec-butyllithium -
are often used
as initiators in anionic polymerization of the carbon-carbon double bond [37]. These compounds are both soluble in hydrocarbon solvents and dissociate
rapidly prior to the start of polymerization. Assuming initiator dissociation
is instantaneous and complete, initiation proceeds as shown in figure 4-1. The
Li+
H3CH2CH Li
CH3CH2CH Li
Figure 4-1: Initiation of deuterated styrene by sec-butyllithium
Bu Li* CD2 D Li+
Figure 4-2: Propagation of deuterated styrene
substituent which stabilizes the carbanion. The Li
+ion is attracted towards
the negatively charged polymer and maintains charge neutrality. The extent
of separation between the counterion and the propagating anion is determined
by the dielectric constant of the solvent; use of a polar solvent allows a greater
degree of separation between the oppositely charged ions.
Propagation, figure 4-2, is the second step of the polymerization. In an
ideal treatment, this stage of the synthesis commences once all the initiation
reactions have been completed. In fact, however, propagation of chains begins even as some initiator compounds are still dissociating; thus two phases of the
synthesis are occurring simultaneously. In the absence of impurities,
propaga-tion will continue until the supply of monomers is depleted, at which point the
propagating chains will remain viable and capable of adding more monomer if
introduced to the reactor.
Termination of the synthesis is often done by reacting the living anion with a
proton donor, usually an alcohol [38]. Another means of termination, however,
is the addition of a compound with a leaving group, such as chlorine. In these
experiments a chlorosilane is used to "cap" the propagating anionic chain, see figure 4-3.
A..
-.0-FH3 Li+ F(CF2CF2)3CH2CH2- Si -CI + I -CH3 TH3 I Si-CH2CH2(CF2CF2)3F + LiCI CH3
Figure 4-3: Termination of propagating deuterated styrene anion
High molecular weight polymers can be synthesized by adding small
quan-tities of initiator to a monomer rich solvent. Assuming initiation is fast, the
number-average degree of polymerization, Y, is determined by the ratio of :moles of monomer consumed to moles of polymer chains produced. Given
com-plete conversion of monomer and initiator, this is expressed simply as the initial
concentration of monomer divided by the initial concentration of initiator [M]o
-n [ IM] (4.1)
The polydispersity index (PDI), which measures the breadth of the molar mass
distribution, is equal to the ratio of the weight-average degree of polymerization
to the number-average degree of polymerization. Using 7n it can be shown [38]
that the PDI is also equal to
Mw/M = 1 + 1/. (4.2)
Bu-4.1.2 Synthetic Experimental Procedure
Styrene-d 8 monomer (Cambridge Isotope Laboratories) was stirred over
in-hibitor remover and calcium hydride (CaH
2) for one half hour to react with
protic impurities. 50 mL of HPLC grade, inhibitor-free tetrahydrofuran (ER Science, OmniSolv) were added via cannula transfer to a 250 mL oven-dried,round bottom flask which served as the synthesis reactor. Prior to transfer the
reactor was capped with a teflon-faced silicone septum and filled with argon
to provide an inert atmosphere for the reaction. The tetrahydrofuran in the
argon-filled reactor was then degassed using argon for 30 minutes to remove dissolved oxygen. Finally, after filtering excess inhibitor remover and CaH2
from the monomer, the flask was charged with 1 mL of the cleaned styrene-d 8
monomer.
The reactor was next cooled in a dry ice/acetone bath. Thermal
equilibra-tion was reached after several minutes when the bath ceased violent boiling.
Polymerization was then initiated by the addition of a 1.3M solution of
sec-butyllithium in cyclohexane (Aldrich Chemical) to the reactor with syringe via
septum. Various quantities of sec-butyllithium solution, from 0.01 mL to 1.2
]mL, were introduced in each run to obtain a range of molar masses. The
resulting solution turned yellow-orange upon initiation, indicating the
pres-ence of carbanions, and was stirred for 3 hours to ensure complete reaction.
The polymerization was functionally terminated with the addition of an
ex-cess of (tridecafluoro-1,1,2,2-tetrahydrooctyl)-1-dimethylchlorosilane (Petrarch
Silanes and Silicones) via syringe. The solution immediately turned clear.
Once terminated, the solution was brought to room temperature and stirred
for 15 minutes, during which time it became cloudy due to the precipitation of lithium chloride. The polymer solution was then precipitated into a 15-fold excess of methanol (ER Science, OmniSolv) and vacuum filtered. Soxhlet
ex-traction was performed for 12 hours using methanol to remove any impurities.
The resulting product was then dried for 12 hours under ambient pressure with
slight heating.
4.1.3 Polymer Characterization
Gel Permeation Chromatography
Gel permeation chromatography (GPC) was performed on a Waters Associates
GPCII Gel Permeation Chromatograph to determine molar mass distributions
for the polymers synthesized. Details concerning this technique can be found
in [38]. Chromatograms for the end-functionalized polystyrenes synthesized
in section 4.1.2 are displayed in appendix B. The method used for calculating
Mn and M, from the chromatograms is explained in [39]. Table 4.1 provides
a summary of expected and measured results concerning molar masses and
molecular weight distributions.
Table 4.1: GPC molar mass results
Sample
[M]o expected expected measured measured measured
[I]o
M
PDI M. M. PDI1 5.49 1175 1.18 4013 4920 1.23 2 27.45 3636 1.04 6343 7730 1.22 3 34.3 4403 1.03 7230 9144 1.26 4 137 15940 1.01 9293 13295 1.43
Differential Scanning Calorimetry
Differential scanning calorimetry (DSC) was conducted on a Perkin-Elmer
I)SC 7 to measure the glass transition temperatures of the synthesis
prod-ulcts. DSC is a thermal analysis technique which measures the difference in
power required to keep a sample and reference chamber heating at the same
rate. More information on this technique can be found in [40]. T values for
both heating and cooling curves, scanning at a rate of plus or minus 20
0C per
minute respectively, are given in tables 4.2 and 4.3. (This is the first time Tg
Table 4.2: DSC Tg measurement results
Description
Th(°C) T(°C)
4.0k dPS-TFE 77.58 76.06 6.3k dPS-TFE 89.41 84.23 7.2k dPS-TFE 93.24 87.45 9.3k dPS-TFE 97.20 90.57Table 4.3: DSC Tg
measurement results
Description* I Th(°C) T(°C) 6.3k PS-TFE 87.29 83.23 7.4k PS-TFE 94.19 88.65 12.7k PS-TFE 94.28 88.76 23k PS-TFE 99.61 94.43 39k PS-TFE 101.87 94.92 59k PS-TFE 102.09 95.03 94k PS-TFE 103.39 97.09
* synthesized
by D. Lee [41]values are being reported for the samples listed in table 4.3. Details concerning
the synthesis of these polymers can be found in [41].)
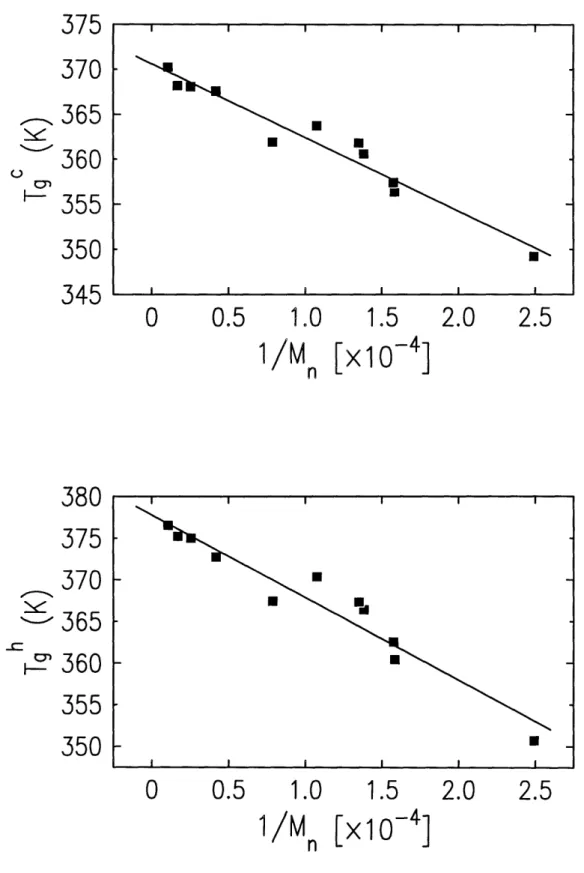
DSC results are plotted in figure 4-4 as Tg versus 1/M, for heating and
cooling curves. Bulk Tg's, as mentioned in section 2.2, scale inversely with
molecular weight
-
see equation 2.3. For polystyrene homopolymer (PS) the
limiting Tg value (i.e. Tg,,) is known to be 373K with kb = 114,400 [27].
Regression analysis of the DSC data reveals that limiting Tg values for the
end-labelled polymers are in excellent agreement with PS homopolymer - viz. T ,~ = 370.6K and Th,00 = 377.8K- with slopes (i.e. kb values) for both heating and cooling curves less than PS - 99,000 and 82,000 respectively. These
find-ings indicate that the thermal behavior of the end-functionalized polymers is
identical with PS for high molecular weights where the contributions from chain
375
370
365
~ 360355
350
345
380
375
370
365
2360
355
350
0
0.5
1.0
1.5
2.0
2.5
1/M [x10
-
4
]
I I I I I I I I0
0.5
1.0
1/Mn
1.5
[X10
- 4
]
2.0
2.5
Figure 4-4: Tg dependence on M. for end functionalized PS and dPS polymers. . _-I I I I I I 0-I I I I I I .
Du _ 20 UL
.
10
O5
c-a)2
C 1 2 510
4 2 510
5 2Molecular Weight
Figure 4-5: FTIR results: Chain end concentration versus molecular weight.
ends are negligible. The more gradual slopes indicate that at lower molecular
weights the functionalized chain end is altering the thermal properties.
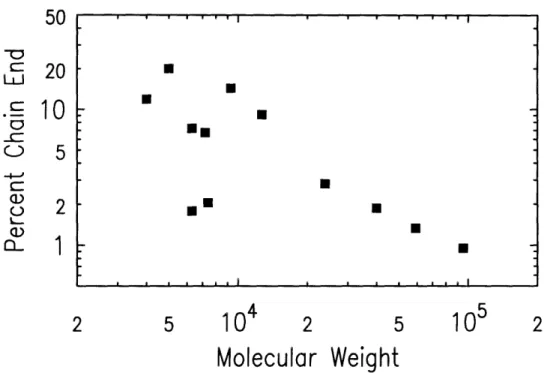
Fourier Transform Infrared Spectroscopy
Fourier transform infrared spectroscopy (FTIR) was performed on a Nicolet 510P FT-IR Spectrometer to determine the bulk concentration of functional-ized chain ends for the polymers synthesfunctional-ized in section 4.1.2 as well as the polymers from [41]. Details concerning this technique can be found in [42].
Bulk concentrations of chain ends were measured by examining the relative
strengths of two signals from the FTIR transmission spectra. To characterize
the functionalized chain ends, the signal strength of the aliphatic Si-CH
3group
at 1250 cm-l was used. Bulk concentrations of the end-functionalized polymers'styrene component were measured from the signal strengths of the asymmetric
stretching modes of the styrene's phenyl group; in protonated styrene these
signals fall near 1450 and 1490 cm
- 1, while in deuterated styrene they are
shifted to lower frequencies at 1330 and 1370 cm-1.
I..
.
..
I I
..
I
*.
*- ·
. ,
, , , l
a I
m i i a
,
.
I
Nuclear Magnetic Resonance
Nuclear magnetic resonance (NMR) was performed on a Bruker WM250 to
fur-ther quantify the bulk concentration of functionalized chain ends. Information
concerning this analytical technique can be found in [43, 38]. NMR is based on the fact that when a nucleus with non-zero spin is placed in a magnetic field there is a splitting of the quantized magnetic energy levels, or Zeeman levels. Transitions between energy levels can be induced by supplying a
res-onant radio frequency magnetic field in addition to a static magnetic field to
split the degenerate states. Protons, which have a spin of 1/2, will resonate
at slightly different frequencies depending on their chemical binding positions
within a molecule, and these shifts can in turn be used to characterize the
molecule's chemical composition. NMR spectra were taken on the 6.3k PS-TFE
and 7.2k dPS-TFE samples synthesized in house, and on a 500 PS-TFE sample
supplied by Professor J. DeSimone at the University of North Carolina. The
NMR spectra from these studies are presented in appendix C.
4.2 Investigative Techniques
4.2.1 X-ray Photoelectron Spectroscopy
X-ray photoelectron spectroscopy (XPS) measurements were performed on a
Perkin Elmer 5000 Series ESCA System to determine the surface concentration
of fluorinated chain ends. Extensive details regarding this technique can be
found in [44]. XPS is generally used to measure the chemical composition of samples within a region about 2 nm from the sample's surface. This technique involves subjecting samples to hard x-rays, with wavelengths of A -10A, and recording the kinetic energies of the ejected core, or photo-electrons. The energy levels of these electrons are characteristic of the atomic species from which
they originated, thus revealing uniquely the identity of the material. The low
are left behind by the ejected electrons. This may create an electric charge
potential resulting in the loss of some kinetic energy of the electrons [45],
thereby complicating the experimental analysis.
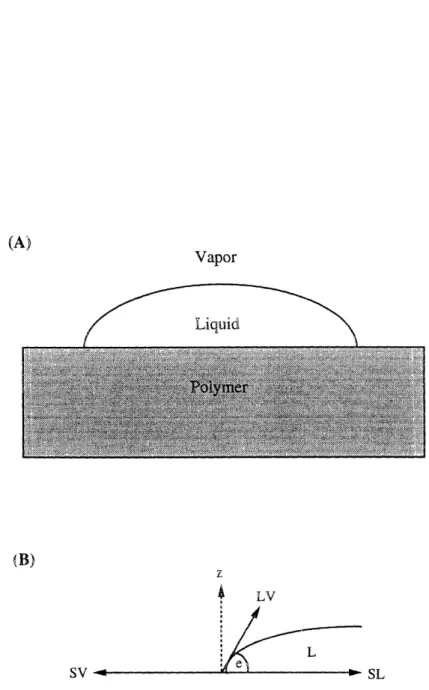
4.2.2 Contact Angle Measurements
Contact angle measurements were taken on a VCA2000 Video Contact Angle System by ASE, Inc. This method of measuring surface tension is based on the Young equation for contact-angle equilibrium [46]. For a liquid drop on an ideal
substrate, the relation between the contact angle and the various interfacial
tension components is given by
cos0
=- 7SV - SL(43)
YLV
'where L, V and S stand for liquid, vapor, and solid respectively, and 0 is
the equilibrium contact angle. The interfacial tension forces are represented
schematically in figure 4-6. Water was the testing liquid used, with -Lv=
7 2.
8dyne/cm.
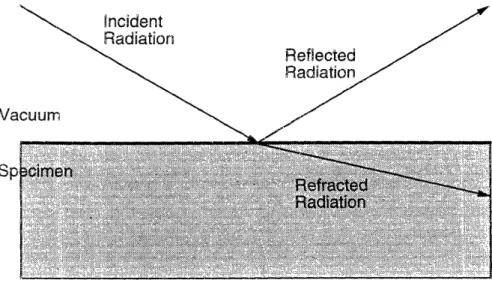
4.2.3 Neutron Reflectivity
Neutron reflectivity (NR) measurements were performed on the Grazing
An-gle Neutron Spectrometer (GANS) at Missouri University's Research Reactor
Facility (MURR) in Columbia, Missouri in collaboration with Dr. John Ankner.
Extensive details concerning this technique can be found in [47]; a brief
dis-cussion with information pertinent to the present work is given here. Specular
reflection of neutrons at a surface or interface depends on the difference in the
refractive indices of the two adjacent media. The refractive index for neutrons
is given by
(A) Vapor Liquid (B) z 4 LV L o #
Figure 4-6: (A) Example of droplet used for contact angle measurements. (B)
Schematic illustration of force balance in contact angle measurements.
sash A_
where A is the neutron wavelength, and b/V is the material's scattering length
density [48].
The NR technique involves measuring the reflected beam intensity as a function of the normal component of the neutron's momentum vector in a
vac-uum kz,o = 2 sin 9, where 0 is the incident angle between the neutron beam
and the specimen. In a homogeneous specimen the neutron momentum normal
to the surface is written as [49]:
kz,, = (kz, - 47r(b/V)l)/ 12 (4.5)
where (b/V)1 is the specimen's scattering length density. For k2,o < 4r(b/V)1,
kz,
1is imaginary; the neutrons propagate into the material only as an
evanes-cent wave, giving rise to total external reflection. For k20 > 47r(b/V)1 neutrons
are able to penetrate into the material and the intensity of the reflected wave's
amplitude is recorded as the reflectivity, R. The reflectivity for the simplest
case of a sharp interface between a sample and air, shown schematically in
figure 4-7, is given by the Fresnel expression [50]
k,,o - kz,1
R = Iro ,1 2 = ( kz
kz,1
)2 (4.6) which has a limiting form at high kz,o of R 7r2(b/V) 2k-4.Reflectivity calculations can quickly be extended to the multilayer case
-where a stack of thin slabs is present - by the following recursive scheme. The
reflectance of a sharp individual interface between layers i and i - 1 may be
denoted r_l,i and again is given by the Fresnel expression:
ki- - ki
rif - i c d 1 kc i'
Incident Radiation
Reflected
Radiation
Vacuumr\
Figure 4-7: Simple geometry for neutron reflectivity
layer i - 1, and layers i - 1 and i - 2, then this can be written as
'ri-2,i-
+ ri-l,i exp(2iki_ldi_l)
vi-2'i -1 + r-Zr_2,_li_,l,i exp(2iki_di-_l)
by imposing continuity conditions on the wavefunction and its derivative at
the
layer boundaries. This algorithm can be repeated indefinitely until the top
surface is reached, and constitutes the basis of a computer program used to
model reflectivity profiles. By approximating the profile of a real, continuous
sample with a series of slabs, the reflectivity may be calculated to any degree
of accuracy required for a given k range.
Scattering length density values for materials used in these experiments
are presented in table 4.4.
4.3 Sample Preparation
The end-functionalized polymers synthesized as described in section 4.1.2, and
in references 41 and [511, as well as varying molecular weight polystyrene
standards (Aldrich Chemical Company) were made into samples by first
dissolv-Table 4.4: Material constants used in reflectivity analysis.
density
(bN)
material (g/cm3) (x 10-6A-2) sec-Butl 0.769 -0.01 TFE 1.05 2.27 PS 1.0 1.43 dPS 1.08 6.1 Si 2.32 2.084 SiO2 2.20 3.05ing these polymers in toluene (Mallinckrodt AR). The polymer solutions were filtered using Millipore GVHP013 0.22pm filters to remove large impurities. Two categories of samples were then prepared: thin films of end-functionalized polymers for XPS, NR and contact angle measurements; and thin films of AB/A blends with end-functional PS and PS homopolymer for NR and contact angle
measurements.
Polished silicon wafers (Exsil) - for NR, 10 cm in diameter; for XPS and contact angle measurements, approximately 1 cm2 wafer sections - were
im-mersed for a 24 hour period in chromic-sulfuric acid solution (Fisher Chemicals) to remove any hydrocarbon impurities. Upon removal, the wafers were rinsed with deionized water (18.2 MQ-cm), and coated with 1,1,1,3,3,3 hexamethyl-disilazane (Aldrich Chemical) for surface treatment [52]. Treating the silicon
with this modification agent renders the surface very hydrophobic and inhibits
alewetting of the polymer solution upon spin casting. After approximately one
hour the wafers were again rinsed with deionized water, then immersed in
a deionized water bath for 20 minutes. This rinsing procedure was repeated
several times to remove excess disilazane, leaving a monolayer coating.
The sub-micron film thicknesses desired for samples was obtained by spin coating the filtered polymer solutions. A description of this technique can be found in [53]. Briefly, by varying the spin speed and concentration of the poly-mer solutions, sample thicknesses ranging from 1001 to 1500A were obtained.
Thickness measurements were made for selected samples using a Gaertner
Scientific Corporation L3W26C.488.830 Ellipsometer; additionally, thickness measurements were checked via NR. The final step in sample preparation was annealing, for which a NAPCO E Series Model 5831 Vacuum Oven was used. An evacuated oven at temperatures of 1100C and 1400C was used over time
pe-riods ranging from 15 minutes to several hours to allow the spin-coated samples