Publisher’s version / Version de l'éditeur:
Vous avez des questions? Nous pouvons vous aider. Pour communiquer directement avec un auteur, consultez la
première page de la revue dans laquelle son article a été publié afin de trouver ses coordonnées. Si vous n’arrivez pas à les repérer, communiquez avec nous à [email protected].
Questions? Contact the NRC Publications Archive team at
[email protected]. If you wish to email the authors directly, please see the first page of the publication for their contact information.
https://publications-cnrc.canada.ca/fra/droits
L’accès à ce site Web et l’utilisation de son contenu sont assujettis aux conditions présentées dans le site LISEZ CES CONDITIONS ATTENTIVEMENT AVANT D’UTILISER CE SITE WEB.
5th International Conference on Structural Health Monitoring of Intelligent and
other Civil Infrastructure (SHMII-5) [Proceedings], pp. 1-9, 2011-12-11
READ THESE TERMS AND CONDITIONS CAREFULLY BEFORE USING THIS WEBSITE.
https://nrc-publications.canada.ca/eng/copyright
NRC Publications Archive Record / Notice des Archives des publications du CNRC :
https://nrc-publications.canada.ca/eng/view/object/?id=368bf6b7-2364-42c1-a75f-c772312f13c5 https://publications-cnrc.canada.ca/fra/voir/objet/?id=368bf6b7-2364-42c1-a75f-c772312f13c5
NRC Publications Archive
Archives des publications du CNRC
This publication could be one of several versions: author’s original, accepted manuscript or the publisher’s version. / La version de cette publication peut être l’une des suivantes : la version prépublication de l’auteur, la version acceptée du manuscrit ou la version de l’éditeur.
Access and use of this website and the material on it are subject to the Terms and Conditions set forth at
Satellite sensing technology to monitor bridges and other civil
infrastructures
Satellite sensing technology to
monitor bridges and other civil
infrastructures
Cusson, D.; Ghuman, P.; McCardle, A.
NRCC-54507
A version of this document is published in
5th International Conference on Structural Health Monitoring of Intelligent and
other Civil Infrastructure (SHMII-5) (Cancun, Mexico, December-11-11), pp. 1-9
The material in this document is covered by the provisions of the Copyright Act, by Canadian laws, policies, regulations and international agreements. Such provisions serve to identify the information source and, in specific instances, to prohibit reproduction of materials without written permission. For more information visit http://laws.justice.gc.ca/en/showtdm/cs/C-42
Les renseignements dans ce document sont protégés par la Loi sur le droit d’auteur, par les lois, les politiques et les règlements du Canada et des accords internationaux. Ces dispositions permettent d’identifier la source de l’information et, dans certains cas, d’interdire la copie de documents sans permission écrite. Pour obtenir de plus amples renseignements : http://lois.justice.gc.ca/fr/showtdm/cs/C-42
Satellite Sensing Technology to Monitor Bridges
and Other Civil Infrastructures
Daniel Cusson
National Research Council, Canada
Parwant Ghuman
3v Geomatics Inc., Canada
Adrian McCardle
3v Geomatics Inc., Canada
The widespread deterioration and some recent collapses of highway bridges have
highlighted the importance of developing effective bridge monitoring strategies that
can help identify structural problems before they become critical and endanger
public safety. A typical major urban centre may possess several hundreds of bridges,
which makes it impractical to upgrade all these bridges with surface-mounted
sensors to monitor their structural performance. A two-step approach may be used,
in which potentially critical bridges are first identified through a screening process
by remote satellite-based monitoring, and then further investigated with
ground-based monitoring and detailed inspection. The capability of Canada’s
RADARSAT-2 advanced synthetic aperture radar (SAR) satellite is being investigated for use in
the first step of the proposed approach, which can help prioritize in-situ monitoring
and maintenance of critical bridges. Radar Interferometry (InSAR) is an advanced
processing technique applied to radar images of the earth’s surface that can detect
very small movements from ground features such as infrastructure systems,
including roadway and railway bridges and their major components. By applying
InSAR processing techniques to a series of radar images over the same region, it is
possible to detect movements of infrastructure systems on the ground in the
millimetre range, and therefore identify abnormal or excessive movement indicating
a potential problem that needs more detailed ground investigation. A major
advantage of this technology is that a single radar image, which can be obtained in
darkness and through clouds, can cover a major urban area of up to 100 km by 100
km, and therefore all bridges in the area could be monitored cost effectively.
Preliminary results from an application of this technology to the transportation
infrastructure in the Vancouver metropolitan area are also presented and discussed.
Corresponding author’s email:
[email protected]
- 2 -
Satellite Sensing Technology to Monitor Bridges
and Other Civil Infrastructures
Daniel Cusson1, Parwant Ghuman2, and Adrian McCardle2
1
National Research Council, Ottawa, Canada 2
3v Geomatics Inc., Vancouver, Canada
ABSTRACT: The widespread deterioration of urban bridges has highlighted the importance of developing effective bridge monitoring strategies to identify structural problems before they become critical to public safety. The capability of Canada’s RADARSAT-2 advanced synthetic aperture radar satellite is being investigated for use in an approach to help prioritize in-situ monitoring and maintenance of critical bridges. Radar Interferometry is an advanced processing technique applied to radar images of the earth’s surface that can detect very small ground movements. With this technique, it is possible to detect changes in the elevation of civil infrastructures (e.g. bridges and roads) in the millimetre range, and therefore identify excessive displacements requiring more detailed ground investigation. A major advantage of this technology is that a single radar image, which can be obtained in darkness and through clouds, can cover a major urban centre. Preliminary results from an application of this technology to the transportation infrastructure in the Vancouver metropolitan area are presented.
1 INTRODUCTION
1.1 State of Health of Canadian Bridges
Canadian cities and regions have substantial transportation infrastructure assets – bridges, roads, railways, and public walkways – that support our economy and quality of life. Most of this infrastructure was built between the 1950s and 1970s, and has gradually deteriorated over the decades due to limited investment in timely maintenance and repair. Inadequate upkeep of these public assets has accelerated the growing costs of repairs and replacements, which was estimated at $21.7 billion in November 2007 (Mirza 2007). These inflating costs are associated directly with the rehabilitation of fast deteriorating bridges and roads all over Canada. Aside from fiscal pressures, aging infrastructure poses significant risk to public safety and quality of life, particularly bridges. Although eroding public roads and consequent hazards are a source of disturbance to commuter traffic, fast-deteriorating highway bridges could present a threat to human life in the event of a collapse. Approximately 25% of today’s bridges and roads are considered deficient in terms of structural capacity and functionality (U.S. DOT et al. 2007). Bridges in Canada are subject to intense freeze/thaw cycles and serious corrosion-induced damage due to the use of de-icing salts on roads for safe winter travel. Since many of these structures were built several decades ago, a number of them do not comply with modern bridge design codes. Design flaws, poor construction, materials degradation, traffic increase,
environmental stresses, and heavier truckloads further accelerate deterioration and render these ageing bridges structurally and functionally deficient. Deteriorating bridges have become ubiquitous across Canada in several major urban centres.
Unfortunately, it sometimes takes a disastrous structural failure to draw attention to severity of the problem. In USA, the recent dramatic failure of the Mississippi River Bridge in Minneapolis has raised public and government awareness of the risk of relying only on periodic bridge inspections (e.g. every two years) to detect deficiencies that are continuously developing over time. However, bridge structures are designed to display ductile failure modes in case of collapse, and consequently most of them will display early warnings when the structure is under extreme loads, providing enough time for remedial actions. With this in mind, structural health monitoring (SHM) is ideal for detecting early warnings of possible failures or need for rehabilitation and strengthening.
1.2 Need for Remote Monitoring
The growing concern over the safety of civil infrastructure has spawned increased research to develop suitable monitoring technologies and strategies. The judicious use of SHM on critical bridges can contribute to addressing some of today’s challenges. For instance, a more accurate knowledge of the life cycle performance of a bridge network through SHM can provide more complete and timely information to decision makers for an improved management of highway bridges regarding their maintenance and rehabilitation. SHM can help re-assess and update traffic and environmental loads and associated safety factors used in bridge design, including the effects of climate change. Reliability-based service-life prediction models, such as the one developed by Lounis and Daigle (2008), can be calibrated and regularly updated with selected SHM data to improve the accuracy and validity of service life predictions (Cusson et al. 2011). Consequently, the safety, structural performance, and durability of major bridges can be optimized, and their risks of failure and life cycle costs can be minimized.
Even as in-situ monitoring technologies evolve and get integrated into modern sensor-packed “smart bridges”, thousands of other bridges throughout the nation will remain insufficiently inspected and inadequately serviced. In-situ sensors are appropriate for targeted monitoring of selected structures, but cannot be readily deployed on a large scale, due to the already limited budgets for bridge maintenance and rehabilitation. Complementary satellite-based monitoring data generated using radar imagery may offer a viable source of independent information products that may be used to remotely monitor the structural health of bridges, confirm conclusions drawn from in-situ sensor data, and feed decision-support models and tools for pre-emptive bridge rehabilitation. For these reasons, a collaborative project entitled RADARSAT-2 Structural Health Monitoring (R2SHM) was recently initiated to apply a mature remote sensing technology towards the large-scale monitoring of bridges in urban areas. R2SHM will supply bridge information products, combined with in-situ data, which can be used by bridge owners to help identify safety-critical structures and quantify the risk they pose to their users.
2 SAR INTERFEROMETRY FOR REMOTE MONITORING OF BRIDGES
The two key limitations of in-situ monitoring – i.e. the lack of spatial detail on a given bridge and the inability to instrument all bridge structures of a major urban centre – can be supplemented by remote satellite-based monitoring through regular radar imaging. The RADARSAT-2 satellite sensor has several advanced beam modes that are suitable for regular displacement monitoring of specific targets on bridges (e.g. slabs, trusses, towers, abutments, joints, barriers, posts). Although radar-monitoring technology is mature and capable of measuring millimetre-level target displacements, its temporal resolution is limited by the repeat pass period of the RADARSAT-2 satellite, which is 24 days. Consequently, there is a natural
- 4 -
synergy between the high temporal resolution of in-situ sensors and high spatial resolution and coverage of satellite-based radar images.
The creation of interference images (or interferograms) from pairs of finely co-registered synthetic aperture radar (SAR) images acquired using nearly identical viewing geometry spawned a host of applications that characterize the earth’s surface and its atmosphere. SAR is fundamentally a ranging measurement that generates images by bouncing microwaves from the Earth’s surface. Each pixel in an interferogram comprises a phase difference (0° to 360°) between two distinct SAR snapshots of a given resolution cell. The interferogram phase is cumulatively sensitive to all geometric and physical variables that affect the return path length of the microwaves from the satellite sensor to the earth’s surface during each of the two satellite passes. Hence, the phase is proportional to surface topography, ground displacement along the satellite line-of-sight, atmospheric pressure and water vapour, and soil moisture. SAR Interferometry (InSAR) used to measure surface displacement was first demonstrated by Gabriel et al. (1989). Since then, InSAR has been successfully used to measure displacements from landslides (Fruneau et al. 1996), earthquakes (Massonnet et al. 1993), volcanoes (Briole et
al. 1997), glaciers (Goldstein et al. 1993), metal mining (Rabus et al. 2009), oil/gas fields (Fielding et al. 1998), groundwater extraction (McCardle et al. 2009), and urban infrastructure (Rabus & Ghuman 2009).
In the previously cited publications, SAR Interferometry has been applied to diverse applications such as generating elevation maps of the earth, mapping of expansive and localized motion phenomena, and characterization of atmospheric water vapour. This is because SAR sensors capture path images that can be co-registered and interfered to yield a path difference that is sensitive to the imaging geometry and variations in physical parameters such as elevation, atmosphere, displacement, and soil moisture. Each pixel of an interferogram contains phase contributions from these physical variables, and the contrasting spatio-temporal statistical properties of the constituent signals can be utilized to isolate the desired component. Phase decontamination is the process of segregating the target signal by modeling and removing all other phase contributions (i.e. contaminants). For the purpose of bridge monitoring, displacement is the target signal and the main contaminants are atmosphere and elevation error. Local and expansive variations in atmospheric water vapour get imprinted on interferograms because microwaves have to travel through the atmosphere during imaging. Elevation errors occur because accurate vertical positions of bridge targets are unknown during the processing of SAR images.
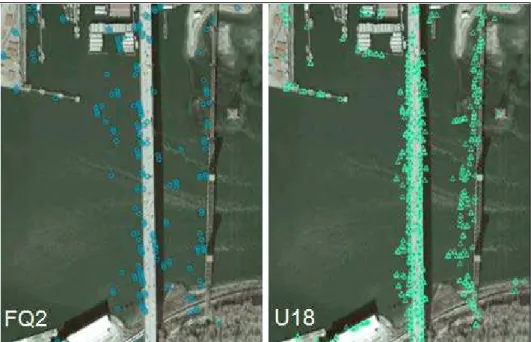
For example, Figure 1 illustrates Point Targets (PTs) identified on the Ironworkers Memorial Bridge in Vancouver. The higher point density in the image on the right is generated from 3 m resolution SAR imagery (Ultrafine-18 or U18) whereas the lower point density on the left is generated by using 8 m resolution images (Fine-Quad-2 or FQ2). The advantage of using lower resolution images in some applications is that they can cover larger ground areas than higher resolution images.
Figure 1. Point targets on the Ironworkers Memorial Bridge, Vancouver, Canada.
Some of the PTs – especially from the FQ2 dataset – appear to lie in water because of contamination from the aforementioned elevation errors manifesting as horizontal positioning inaccuracies. The displacement history at each point can be measured by modeling and removing the atmospheric and elevation phase contributions through the process of Point Target Interferometry (PTI), also commonly known as Persistent Scatterer Interferometry (PSI). In order to identify PTs and accurately apply PTI, a data stack comprising more than 15 overlapping SAR images is required. Phase denoising techniques are also applied, whereby multiple redundant measurements are generated, each with independent noise characteristics, and this over-defined set of observations is mathematically solved to suppress noise and emphasize the target displacement signal.
3 EARLY RESULTS OF REMOTE MONITORING OF CIVIL INFRASTRUCTURE ASSETS IN VANCOUVER, CANADA
The current focus of R2SHM is on deriving reliable displacement histories for PTs occurring over bridge structures in urban centres. The U18 and FQ2 stacks were used over the City of Vancouver to identify PTs on urban infrastructure assets, including bridges. The overall urban point densities were measured to be 444 points/km2 for the FQ2 stack and 3104 points/km2 for the U18 stack. For example, the total number of PTs identified over the five selected bridges in Vancouver (Granville, Burrard, Cambie, Lions Gate, and Ironworkers Memorial bridges) was 342 for the FQ2 stack and 2170 for the U18 stack. The sixfold denser point distribution achieved with the U18 stack is advantageous for measuring bridge displacements with greater spatial detail. Moreover, it enhances measurement accuracy because signal processing algorithms benefit from an increased density of PTs. Table 1 provides information on five Vancouver bridges and compares the number of PTs that were identified on each bridge with the FQ2 and U18 datasets.
Table 1. Information on selected satellite-monitored bridges in Vancouver, Canada. Bridge Name (year opened) Granville (1954) Burrard (1932) Cambie (1985) Lions Gate (1938) Ironworkers (1960)
- 6 - Location 49.272°N, 123.133°W 49.275°N, 123.137°W 49.272°N, 123.115°W 49.315°N, 123.138°W 49.296°N, 123.026°W Water crossing False Creek False Creek False Creek Burrard Inlet Burrard Inlet Type Cantilever/truss Steel truss Box girder Suspension Cantilever/truss
Length 732 m 850 m 1,100 m 1,517 m 1,292 m
Number of lanes 8 traffic lanes 6 traffic lanes + 2 sidewalks 6 traffic lanes + 1 sidewalk 3 traffic lanes + 1 sidewalk 6 traffic lanes + 1 sidewalk Peak height (GPS) 48 m 38 m 19 m 69 m 59 m FQ2 Nb. of PTs 47 39 57 125 74 U18 Nb. of PTs 419 165 300 737 549
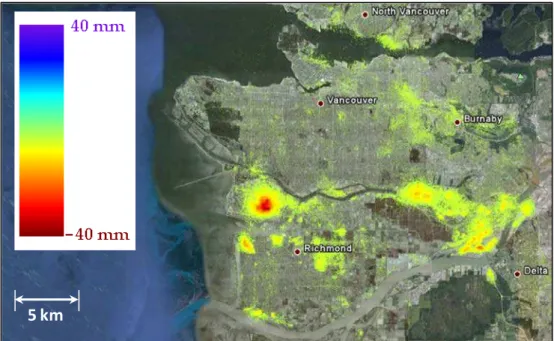
InSAR is capable of generating wide-area displacement maps that identify and quantify displacement basins occurring in the entire imaged region. Figure 2 illustrates the vertical (up-down) cumulative displacement map generated over the Greater Vancouver Area using the FQ2 dataset over a period of 3 years. The coloured displacement basins are quantified with respect to the legend (from -40 mm in red to +40 mm in blue), and Google Earth optical imagery has been used as a background. The most significant displacements were measured over Richmond and South-East Burnaby. With the largest negative displacements (-40 mm over 3 years), the Vancouver International Airport was a key motion hotspot.
Figure 2. FQ2 displacement data over the Greater Vancouver Area (Apr 2008 – Mar 2011).
In addition to spatial displacement mapping, PTI was also used to extract displacement histories at discrete targets on infrastructure installations such as rapid public transit lines (Figure 3), buildings (Figure 4), and bridges (Figure 5). Although some seasonal effects may be observed, the general trends show steadily increasing ground sinking down to 20 mm over two years only (U18 dataset). A detailed analysis of surrounding PTs is required to assess whether the whole infrastructure is sinking uniformly or only at some supports, which could be worrisome.
Figure 3. Displacement profile for a target on a rapid transit line.
Figure 4. Displacement profile for a target on a wastewater treatment plant.
Figure 5. Displacement profile for a target on a bridge approach slab.
Current work at 3v Geomatics Inc. is focusing on increasing the density of PTs on bridge structures through the development of new PT identification techniques that can pre-select high quality points, and reduce the high data volume requirements (> 15 SAR images) for detecting
- 8 -
PTs. In addition, target positioning correction methods are being developed by interpolating the horizontal position and modeling the vertical elevation error. Displacement results over bridge structures are currently contaminated by elevation errors since externally available elevation models do not account for bridges over water, i.e. the bridge is set to the same elevation as the underlying water body. Removal of elevation errors will not only improve the quality of displacement measurements, but also benefit visualization and interpretation, since PTs will be correctly positioned over corresponding physical structures in background optical imagery. 4 FORESEEN APPLICATIONS OF SATELLITE-BASED STRUCTURAL HEALTH
MONITORING OF TRANSPORTATION INFRASTRUCTURE 4.1 Improved bridge monitoring frequency
Typically, bridges are periodically monitored with different levels of scrutiny. For example, the City of Ottawa conducts three levels of inspections: (i) monthly visual inspections (conducted to identify obvious concerns such as vehicle impacts); (ii) annual general inspections; and (iii) mandatory biennial thorough inspections. Frequent displacement monitoring is only available for the very few bridges that are instrumented with surface or embedded sensors. With R2SHM, specific bridge targets can be monitored to identify and investigate targets with suspicious displacement on a monthly time-scale. As a result, timely identification of potential problems can help mitigate their impact on structural health and lower bridge rehabilitation costs.
4.2 Improved bridge integrity and serviceability
The goal of periodic InSAR displacement measurements is to establish a correlation with bridge serviceability and integrity issues. Bridge engineers are interested in monitoring subtle displacements that can be indicative of unexpected events. Motion can be detected along each of the three dimensions, for example: (i) vertical displacement from the settlement of a newly constructed bridge; (ii) longitudinal displacement from daily or seasonal thermal expansion/contraction; and (iii) transverse displacement from damaged bearings. The sensitivity of InSAR to horizontal displacements, however, depends on the relative angles between the satellite line-of-sight and the bridge longitudinal direction. As indicated in Table 1, hundreds of target points can be obtained on the same bridge structure. This also allows the evaluation of differential displacements along the length (or the width) of the bridge, which may result in excessive expansion joint opening or stress in the deck. In addition, a sudden change (acceleration/deceleration) in the temporal evolution of a bridge point target is of greater concern than steady displacement.
4.3 Overcoming bridge accessibility issues
Satellite-based monitoring has significant economic and logistical value towards monitoring of hazards in remote areas that often do not receive the required attention due to accessibility issues. InSAR could be useful for monitoring the watercourse around bridges in remote areas. For example, meandering rivers that change course along the Alaska Highway can overwhelm bridges and threatens their foundations. Another benefit in this case is the monitoring of bridges in remote areas with difficult access, severe weather conditions, and possibly infrequent onsite inspections. The use of R2SHM would complement and validate the limited onsite inspection data, while optimizing the inspection travels and related budget.
5 CONCLUSIONS
Based on the preliminary results of this on-going R2SHM project, these conclusions are drawn: • Synthetic aperture radar interferometry can be used to identify and monitor the changes in
• Satellite-based radar images can be taken over an entire urban area to monitor remotely hundreds of bridge structures simultaneously, though clouds and at night.
• Remote monitoring can identify bridge problems (e.g. mid-span deflection, foundation settlement, critical river level) and help prioritize in-situ bridge monitoring and inspection. • Remote monitoring (with high spatial density/low temporal density measurements) and
in-situ monitoring (with low spatial density/high temporal density measurements) can be used simultaneously to increase the validity and accuracy of the measured data and findings. • Foreseen benefits of remote monitoring include: monthly bridge displacement monitoring,
improved bridge serviceability and integrity, and fewer bridge accessibility issues in remote geographical areas and/or harsh and cold weather.
6 ACKNOWLEDGMENTS
The authors acknowledge the financial support of the Canadian Space Agency, and the guidance from Transport Canada and Federal Bridge Corporation Limited.
7 REFERENCES
Briole P, Massonnet D, and Delacourt C. 1997. Post-Eruptive Deformation Associated With the 1986-87 and 1989 Lava Flows of Etna Detected by Radar Interferometry, Geophysical Research Letters, 24(1): 37-40.
Cusson D, Lounis Z, and Daigle L. 2011. Durability Monitoring for Improved Service Life Predictions of Concrete Bridge Decks in Corrosive Environments, Computer-aided Civil and Infrastructure Engineering Journal, 26, 18 p. Fielding E, Blom R, and Goldstein R. 1998. Rapid Subsidence Over Oil Fields Measured by SAR Interferometry,
Geophysical Research Letters, 25(17): 3215-3218.
Fruneau B, Achache J, and Delacourt C. 1996. Observation and Modelling of the Saint-Etienne-de-Tinée Landslide Using SAR Interferometry, Tectonophysics, 265(3,4): 181-190.
Gabriel AK, Goldstein RM, and Zebker H. 1989. Mapping Small Elevation Changes Over Large Areas: Differential Radar Interferometry, Journal of Geophysical Research, 94(B7): 9183-9191.
Goldstein R, Engelhardt H, Kamb B, and Frolich R. 1993. Satellite Radar Interferometry for Monitoring Ice Sheet Motion: Application to an Antarctic Ice Stream, Science, 262: 1525-1530.
Lounis Z, and Daigle L. 2008. Reliability-Based Decision Support Tool for Life Cycle Design and Management of Highway Bridge Decks, Annual Conference of the Transportation Association of Canada, Toronto, 19 p.
Massonnet D, Rossi M, Carmona C, Adragna F, Peltzer G, Feigl K, and Rabaute T. 1993. The Displacement of the Landers Earthquake Mapped by Radar Interferometry, Nature, 364: 138-142.
McCardle A, McCardle J, and Ramos F. 2009. Large Scale Deformation Monitoring and Atmospheric Removal in Mexico City, Fringe 2009 Workshop, Frascati, Italy.
Mirza S. 2007. Danger Ahead: The Coming Collapse of Canada’s Municipal Infrastructure, Available from
http://www.fcm.ca//CMFiles/mdeficit1OPT-792008-3425.pdf, Accessed June 18, 2011.
Rabus, B, and Ghuman, P. 2009. A Simple Robust Two-Scale Phase Component Inversion Scheme for Persistent Scatterer Interferometry (Dual-Scale PSI), Canadian Journal of Remote Sensing, 35(4): 399- 410.
Rabus B, Ghuman P, Nadeau C, Eberhardt E, Woo K, Severin J, Stead D, Styles T, and Gao F. 2009. Application of InSAR to Constrain 3-D Numerical Modelling of Complex Discontinuous Pit Slope Deformations, International Symposium on Rock Slope Stability in Open Pit Mining.
U.S. DOT, FHWA, FTA. 2007. The 2006 Status of the Nation’s Highway Bridges and Transit: Conditions & Performance, Report to Congress.