Publisher’s version / Version de l'éditeur:
Leukemia Research, 20, August 8, pp. 649-655, 1996-08
READ THESE TERMS AND CONDITIONS CAREFULLY BEFORE USING THIS WEBSITE.
https://nrc-publications.canada.ca/eng/copyright
Vous avez des questions? Nous pouvons vous aider. Pour communiquer directement avec un auteur, consultez la
première page de la revue dans laquelle son article a été publié afin de trouver ses coordonnées. Si vous n’arrivez pas à les repérer, communiquez avec nous à PublicationsArchive-ArchivesPublications@nrc-cnrc.gc.ca.
Questions? Contact the NRC Publications Archive team at
PublicationsArchive-ArchivesPublications@nrc-cnrc.gc.ca. If you wish to email the authors directly, please see the first page of the publication for their contact information.
NRC Publications Archive
Archives des publications du CNRC
This publication could be one of several versions: author’s original, accepted manuscript or the publisher’s version. / La version de cette publication peut être l’une des suivantes : la version prépublication de l’auteur, la version acceptée du manuscrit ou la version de l’éditeur.
For the publisher’s version, please access the DOI link below./ Pour consulter la version de l’éditeur, utilisez le lien DOI ci-dessous.
https://doi.org/10.1016/0145-2126(96)00019-7
Access and use of this website and the material on it are subject to the Terms and Conditions set forth at
Study of chronic lymphocytic leukemia cells by FT-IR spectroscopy and
cluster analysis
Schultz, Christian P.; Liu, Kan-Zhi; Johnston, James B.; Mantsch, Henry H.
https://publications-cnrc.canada.ca/fra/droits
L’accès à ce site Web et l’utilisation de son contenu sont assujettis aux conditions présentées dans le site LISEZ CES CONDITIONS ATTENTIVEMENT AVANT D’UTILISER CE SITE WEB.
NRC Publications Record / Notice d'Archives des publications de CNRC:
https://nrc-publications.canada.ca/eng/view/object/?id=ed05b69f-f63c-4e6a-a077-25b97a2781e5 https://publications-cnrc.canada.ca/fra/voir/objet/?id=ed05b69f-f63c-4e6a-a077-25b97a2781e5
Pergamon
PII: SO1452126(96)00019-7
Leukemia Research Vol. 20, No. 8, pp. 649-655, 1996. Copyright 0 1996 Elsevier Science Ltd. All rights reserved _
Printed in &at Britain 0145-2126196 $15.00 + 0.00
STUDY OF CHRONIC
LYMPHOCYTIC
LEUKEMIA
CELLS BY FT-IR
SPECTROSCOPY
AND CLUSTER
ANALYSIS
Christian P. Schultz*, Kan-zhi Liu*, James B. Johnston? and Henry H. Man&h*
*Institute for Biodiagnostics, National Research Council Canada, R3B lY6 Winnipeg, Manitoba; and tManitoba Institute of Cell Biology, Manitoba Cancer Treatment and Research Foundation, R3E OV9
Winnipeg, Manitoba, Canada
(Received 17 November 199.5. Revision accepted 10 February 1996)
Abstract-The peripheral mononuclear cells from 23 normal individuals and the purified B cells from 38 patients with chronic lymphocytic leukemia (CLL) were examined by Fourier transform infrared (FT-IR) spectroscopy. Differences were observed between the CLL and normal cells at the DNA, protein and lipid levels, with CLL cells having greater DNA and lower lipid contents than normal cells. In addition, the spectral character of the CLL and normal cells varied, demonstrating that there were also qualitative differences in the DNA and lipids. Statistical analysis, based on hierarchical clustering, separated normal from CLL cells completely and classified them into two subgroups for normal cells, while the CLL cells could be divided into three subgroups that were distinct from the normal cells. These differences were based on the lipid and DNA content and the overall spectral character of the cells. Copyright 0 1996 Elsevier Science Ltd.
Key words: FT-IR spectroscopy, chronic lymphocytic leukemia, cluster analysis.
Introduction
Chronic lymphocytic leukemia (CLL) is characterized by the accumulation of non-proliferating mature-looking lymphocytes in the peripheral blood and, with disease progression, there is lymphadenopathy, splenomegaly and replacement of the marrow by leukemic cells [l]. The tumor cells are usually CD5+ B cells, and the lymphoid cells appear to be frozen within the normal path of differentiation. This feature may be partly due to an intrinsic defect in the leukemic cells, as cytogenetic abnormalities are present in 56-65% of cases [l, 21. Typically, this is a disease of accumulation rather than proliferation, and bcl-2 is overexpressed in most patients, possibly as a result of DNA hypomethylation, causing a reduction in spontaneous apoptosis [3,4]. However, the leukemic cell populations are not homo- geneous and there is variation in the cells of an individual in morphology [l], buoyant density [5], immunoglobulin content [6] and chromosomal content
PI*
Fourier transform infrared (FI’-IR) spectroscopy has become a powerful tool for the analysis of cell components, such as membranes [7], proteins [8] and Abbreviations: FT-IR, Fourier transform infrared spectro- scopy; CLL, chronic lymphocytic leukemia.
nucleic acids [9], as well as for complex biological materials, such as tissues [ 10-131, body fluids [14,15] or cell cultures [16]. An initial infrared study by Polli and Semenza [ 171 demonstrated no spectroscopic differ- ences between the DNA isolated from normal and leukemic human leukocytes. However, Benedetti et aZ. [l&20] subsequently did observe differences in the infrared spectra obtained from isolated normal and CLL cells as well as from their pure nuclei [21]. Their approach, based on the group frequency concept, was motivated by the search for marker bands characteristic for leukemia. Differences were indeed found between the spectra of these cells and the authors identified two infrared marker bands, at 966 and 530 cm-‘, which were taken to be specific for lymphoid leukemia. In addition, they showed that the ratio between two integrated spectral areas (A1080 cm-l/A1540 cm-‘) could be used to separate normal from leukemic cells
P91*
In the present study, we have taken a different approach towards the analysis of the infrared spectra of normal peripheral mononuclear and CLL cells. Rather than relying on individual marker bands in the infrared spectra of leukemic cells, we have resorted to pattern recognition algorithms that make use of the fingerprint- like characteristics of the infrared spectrum. The spectral data were subjected to multivariate statistical methods, 649
6.50 C. P. Schultz et al. in particular cluster and factor analysis, which separated
the spectra into different classes. These results demon- strate differences between the leukemic and normal cells and also provide evidence for the presence of several different subclones in the leukemic cell population.
Materials and Methods Patient population and isolation of cells
All patients were followed at the Manitoba Cancer Treatment and Research Foundation and none had received therapy within 4 weeks of their CLL cells being examined. The minimum lymphocyte count was 3O,OOO/pl, ensuring that contamination with normal B cells was minimal. Peripheral mononuclear cells were obtained from 23 normal individuals and from 38 patients with CLL using a Ficoll-Hypaque gradient [22]. For the patients with CLL, monocytes were removed using CD33 antibodies coupled to magnetic beads (Dynabeads) and T cells were depleted using sheep red cell rosetting [22]. The CLL cells in all cases were CD19, CD20 and CD5 positive.
Sample preparation
To prevent cell aggregation, the mononuclear cells were maintained in RPM1 1640 with 10% fetal calf serum at 8”C, and prior to spectroscopy the cells were washed and resuspended in 0.9% NaCl. Five microliters of the suspensions (3 x lo6 cells) were deposited on IR- transparent BaF2-windows and dried down as thin circular disk films with a diameter of 2-3 mm. The films were kept in a desiccator under a mild vacuum for 3-5 min. The BaF2-window was covered with a second BaF*-window to stabilize the humidity of the films. The quality of each preparation was checked by infrared microscopy of small sample areas (50 mm). This methodology gave good homogeneous films, free of contaminative chemicals.
Infrared spectra and cluster analysis
For subject samples, three spectra, each taken from different films, were obtained against a blank back- ground. The infrared spectra were recorded on a FTS-60 FT-IR instrument (Biorad, Cambridge, MA, U.S.A.), equipped with a nitrogen-cooled mercury cadmium telluride detector. For each spectrum, 256 interfero- grams were co-added at a nominal resolution of 8 cm-’ with an encoding interval of one wavenumber and then apodized with a triangular smoothing function before Fourier transformation. Band narrowing using the method of Fourier self-deconvolution was performed with smoothing parameters (k value) of 1.6 and 16 cm-l for band halfwidths [8]. For cluster analysis, the spectra were first normalized to the integrated spectral area between 900 and 1800 cm-‘, and then converted into
Wavenumber I cm”
Fig. 1. Typical infrared spectra of normal (control) lympho- cytes (A) and malignant transformed leukemic cells (B). Areas marked I, II and III represent lipid, protein and nucleic acid
regions, respectively.
first derivatives using the Savitzky/Golay algorithm with a 9 points window. The Ward’s minimum variance method was used for cluster analysis and Euclidean distances as distance measure [23].
Results
Infrared spectra of normal mononuclear and CLL cells Representative infrared spectra of normal mono- nuclear and CLL cells are shown in Fig. 1 and demonstrate complex mixtures of typical cell compo- nents: lipids/membranes (range I), proteins (range II) and nucleic acids/saccharides (range III). Identical spectra were observed for isolated cells from the same CLL patient when these cells were allowed to sit at 4°C for up to 24 h, confirming the reproducibility of this test. As previously demonstrated by Benedetti and co- workers, significant differences were observed between spectra from normal and malignant cells [18-211. A comparison of the marker bands at 2850 and 2920 cm-’ in range I showed a higher membrane lipid content in normal cells compared with that in CLL cells. This contrasts with observations in other tumor tissues, where there is generally a higher amount of lipid than in the normal cellular counterpart [13, 16,24-261. Differences were also observed in the protein composition of these cell types. The amide 1 band (in range II) had a stronger absorption in the normal mononuclear cells than in the spectra of leukemic cells, and the maximum of this band was located at 1656 f 2 cm-’ in normal cells and at 1652+2 cm-’ in the CLL cells. Finally, strong differences were apparent in region III, which in lymphocytes reflects mainly DNA structures, and this was most striking for the marker band at 966 cm-’ [ 18,211.
Study of chronic lymphocytic leukemia cells 651
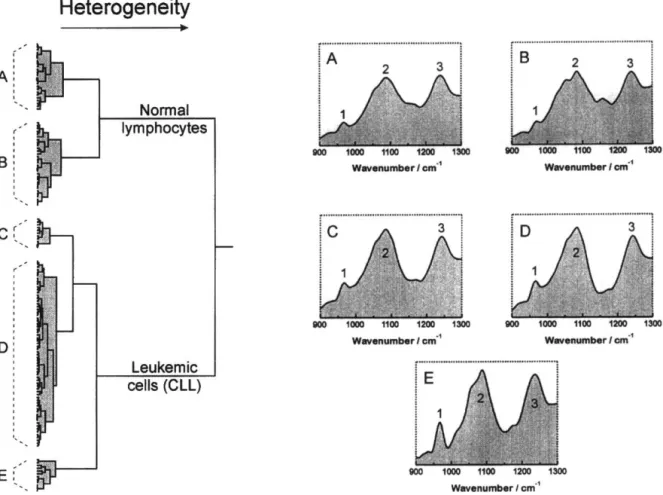
Heterogeneity
w
E (1’ ,.i, .P- Normal lymphocytes Leukemic cells (CLL) Wavenumber I cme’ Wavenumber I cm-’ . . . .._..._... Wavenumber I cme’ Wavenumber I cm-’ Wavenumber I cm-’Fig. 2. Dendrogram representation of normal lymphocytes (23 individuals) and chronic lymphocytic leukemic cells (38 patients) created by cluster analysis of first derivative spectra between 900 and 1300 cm-’ after area normalization. The five panels A, B, C,
D and E show the mean spectra of each subcluster.
Cluster analysis
The spectroscopic differences between normal and CLL cells were used as a basis for cluster analysis, as this technique has previously been used to differentiate between the infrared spectra of a variety of pathogenic bacteria [23]. Figure 2 shows such a cluster analysis based on 177 spectra of normal mononuclear and leukemic cells, obtained from the 23 normal donors and 38 patients with CLL. The spectral range between 900 and 1300cm-’ was chosen for classification because it primarily reflects differences in the phosphate and sugar moieties of the DNA structures.
The dendrogram shows two major clusters, clearly separating the spectra of normal and leukemic cells. In addition, both main clusters were further divided into subclusters. For convenience, we have used the arbitrary labels A and B for the normal cells and C, D and E for the leukemic cells to mark the subclusters. The five subclusters had a different mean spectral characteristic, as illustrated in panels A, B, C, D and E. Based on the information contained in the 900-1300 cm-’ region of the infrared spectrum, cluster analysis clearly separated
the normal from the leukemic cells. Interestingly, the CLL cells were not a homogeneous group, but could be separated into three different subclusters. The majority of the CLL cells were in subcluster D, while smaller numbers were contained in subclusters C and E.
The spectral features marked 1, 2 and 3 are well- known DNA bands. Band 1 is thought to originate from a C-C/C-O stretching vibration involving the character- istic deoxyribose and phosphate moiety of the DNA backbone [9]. Band 2, centered around 1087 cm-‘, and band 3, centered around 1240 cm-‘, originate, respec- tively, from the symmetric and asymmetric POZ- stretching vibration of phosphate groups that are part of the DNA backbone [9]. The normal cells could be separated into two subclusters, A and B, with their mean spectral characteristics demonstrating a lower DNA content than that found in subclusters C, D and E seen in the CLL cells. The spectral subtype characteristics revealed that the main difference between the subclus- ters C, D and E in the CLL cells was an increasing amount of DNA. Subclusters C and D were part of a relatively homogeneous group of spectra reflecting a
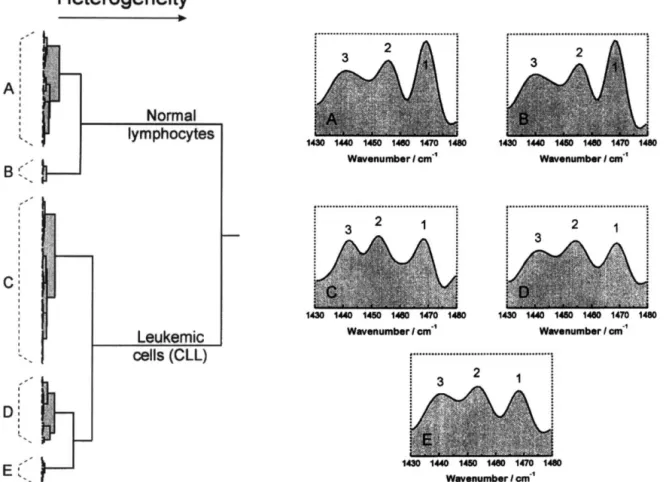
652 C. P. Schultz et al. B (1’ .I lymphocytes Leukemic cells (CLL) Wavenumber I cm-’ Wavenumber I cm-’ Wavenumber I cd Wavenumber I cm”
Fig. 3. Dendrogram representation of normal lymphocytes (23 individuals) and chronic lymphocytic leukemic cells (38 patients) created by cluster analysis of first derivative spectra between 1430 and 1480 cm - ’ after area normalization. The five panels A, B, C,
D and E show the mean spectra of each subcluster.
similar DNA content, whereas subcluster E showed a spectral contour indicating that this fraction of CLL cells had a very high DNA content (particularly band 1).
The same cluster analysis was then performed, based on a very small spectral range, between 1430 and 1480 cm- ’ (see Fig. 3). Again, the normal mononuclear cells fall into one cluster and the leukemic cells are clearly separated in a second cluster; yet the subclassi- fications are slightly different from those in Fig. 2. While it shows the same number of subclusters obtained previously, two for normal and three for leukemic cells, the individual representations (the weight within the clusters) are slightly different. In the dendrogram in Fig. 3, the majority of CLL cells are located in the major subcluster C (arbitrarily labelled), while smaller num- bers fall into subclusters D and E. For the panels in Fig. 3, the mean spectral representations in insets C, D and E are shown as inversed second derivatives, which enhance the differences among the subclusters. The spectral features marked 1, 2 and 3 are well-known methyl and methylene bands, highly characteristic for lipids in the membranes and other lipid structures. Band
1, located at 1468 cm-‘, originates from the CHa bending vibration of lipid acyl chains, while band 2, centered around 1455 cm-‘, arises from the asymmetric CHs deformation vibration of methyl groups [7]. Band 3, centered around 1440 cm-‘, is a specific methylene group vibration in fatty acids and amino acids. The spectral subtype characteristics of the various subclus- ters thus demonstrate changes in the amount of lipid CHs and CH2 groups and/or their environment.
The spectra of normal cells fall into one cluster (subcluster A) with only a few being separated into a minor second subcluster B. The selected spectral region contained absorptions of methylene groups, sensitive for lipids in the membrane environment of cells (band l), which dominated the spectra of normal lymphocytes. The differences between normal and leukemic cells in this particular spectral region suggest that in addition to the enrichment in DNA, a second major biochemical change in leukemic cells is a modification in their membrane environment. Normal mononuclear cells appeared to be lipid rich while the leukemic cells were lipid depleted.
Study of chronic lymphocytic leukemia cells 653 I 800 , I I 1000 1200 1400 1600 1800 Wavenumber / cm”
Fig. 4. Infrared spectra of normal lymphocytes (A) and chronic lymphocytic leukemic cells (B) after band narrowing by Fourier self-deconvolution (see Materials and Methods). The shaded areas in B indicate regions related to changes in nucleic
acid absorptions.
The molecular nature of infrared marker bands
Potential differences between infrared spectra can be better visualized after the application of resolution enhancement methodologies, such as Fourier self- deconvolution or derivation. Figure 4 compares the resolution-enhanced spectra of normal mononuclear cells (trace A) with those of CLL cells (trace B) over the entire range between 800 and 1800 cm-‘.
(1) Structural differences were seen in the protein absorption region between 1500 and 1700 cm-‘, and the spectra showed that in leukemic cells the distribution of secondary structure elements was changed in favor of more p-structures (see strong band at 1638 cm-’ in B), while the c1- helical content was decreased (see strong band at 1656 cm-’ in A).
(2) The overall lipid content in leukemic cells was reduced as attested by the lower intensity of the 1468 cm- ’ CH2 deformation band of lipid methylene groups, also seen for the 2850 cm-’ lipid methylene stretching vibration in Fig. 1. A synergistic behavior was observed for the ester lipid band at 1742 cm-‘, which also decreased in intensity in the spectra of leukemic cells, suggesting that major differ- ences exist between the membranes of the two cell types.
(3) The spectra of leukemic cells show character- istic carboxylate bands (at 1397 and 1575 cm-‘), which indicate that the number of carboxylate-containing molecules has in- creased in these cells.
(4) The major difference between spectra of normal and leukemic cells, however, consisted of increased absorptions of phosphate groups in the latter. The greyed area in Fig. 4B empha- sizes these spectral differences and illustrates that the integrated intensity in leukemic cells has increased by almost a factor of two. Every phosphate-containing macromolecule, such as nucleic acid, lipid or phosphorylated protein, may contribute to this intensity, along with small phosphate-containing metabolites, such as phosphoglycerate or free nucleotides. Further- more, differences in the band shape between the spectra of leukemic cells can be related to changes in conformation and/or the distribution of phosphorylated compounds.
(5) Finally, in all spectra of leukemic cells one finds a band at 1714 cm-‘, which is absent or less prominent in the spectra of normal cells. It is well known that base pairing of DNA introduces an infrared band at 1717 cm-’ that is sensitive for DNA double strand conforma- tion [9]. This additional structure observed in all spectra of leukemic cells provides evidence for a greater amount of pure cell DNA, in good agreement with the well-known fact that in leukemic cells chromosomes can be wrongly modified and/or expressed in more copies [l- 31.
Discussion
The results of this study have shown that CLL cells have unique spectra, and can be readily differentiated from normal mononuclear cells, based on qualitative and quantitative differences in DNA, protein and lipid. Consistent with the findings of Benedetti et al. [18-211 in cells and isolated nuclei, this study demonstrates that CLL cells have a higher phosphate content, which appears to be primarily related to an increased DNA content. In addition, there are spectral alterations in the overall contour of these bands, suggesting structural/ conformational changes in the DNA. The increase in the DNA content in leukemic cells is probably related to chromosomal abnormalities that occur in 56-65% of these patients; trisomy 12 occurs in 18% of cases whereas 14q+ and 13q+ occur in 13% and 10% of cases, respectively [ 1,2]. The presence of cytogenetic abnorm- alities is important prognostically, with patients having multiple abnormalities or trisomy 12 doing more poorly than those with normal karyotypes or 13q+, while the presence of 14q+ by itself is of little prognostic value [2,27]. It will be of interest to determine whether the infrared spectra are predictive of the cytogenetic
654 C. P. Schultz et al. abnormalities in CLL and can thus be used as a
prognostic measure.
It was also demonstrated that CLL cells have a lower lipid content than normal peripheral mononuclear cells, and this is due to a reduction in methylene and ester groups (in fatty acids, see [7]). This situation contrasts with other tumors, which are usually found to have a higher lipid content than normal cells (for tissues and cell lines see [13, 16, 25,261). As lipids are primarily located in cell membranes, these findings suggest that there are alterations in the membrane structure and/or composition of CLL cells, which may explain the membrane fragility and the presence of ‘smudge cells’ in peripheral smears of these patients [l]. Speculatively, the altered lipid content and membrane fragility of these cells may be related to the age of these long-lived leukemic cells. This possibility is supported by missing infrared absorptions at 1121 and 1020 cm- I, typical for RNA [21,24], which indicate a low level of biosynthetic activity in CLL cells, being essential for continuous membrane regeneration.
The cluster analysis studies demonstrated that the normal peripheral mononuclear cells could be separated into two subclusters, which differed in both DNA and lipid content. It would appear most likely that this grouping was related to variations between donors in the proportion and degree of activation of the lymphocytes and monocytes, due to the lowered overall DNA/cell ratio in monocytes. In contrast, the purified CLL cells could be separated into one of three subclusters, which differed from normal cells and from each other in DNA and lipid content. It is possible that these populations varied cytogenetically and this would explain differ- ences in their DNA content [27]. In addition, there is wide variation in the cellular morphology of CLL cells and the different populations may also represent cells of different size, which would be reflected in the varying lipid content caused by the varying amount of cytoplas- matic compounds. In one patient who was followed for over 9 months, there was a gradual increase in his leukemic cell count and concomitantly the infrared spectra of his CLL cells fell into different subclusters. Initially, his cell spectra were in the subcluster with lower DNA content, but after 9 months they were in the subcluster with high to intermediate DNA content, suggesting that there had been the emergence of a new leukemic clone. This concept is supported by cytoge- netic and molecular studies, indicating heterogeneity in the leukemic cells of an individual CLL patient [3- 6, 271. For example, it has been demonstrated that multiple chromosomal abnormalities and clones may exist within an individual patient and that new cytogenetic abnormalities may develop over time [28, 291. In addition, it has been shown that p53 [30] and retinoblastoma [31] gene mutations and increased
expression of bcl-2 [3] or mdm-2 [32] affect only a fraction of cells within the entire leukemic cell population. As the emergence of these new subclones usually heralds the development of more aggressive and resistant disease, the detection of multiple subclones by spectroscopy may have important prognostic ramifica- tions [28,30].
In summary, the results of this study demonstrate that infrared spectroscopy provides a simple and useful tool for the study of the biochemical and molecular structure of CLL cells and can be used to differentiate CLL cells from peripheral mononuclear cells. In addition, the results suggest that there are multiple subclones of leukemic cells within a CLL population, which differ in DNA and lipid content. Further studies are required to determine whether the variation in DNA content in CLL cells can be related to cytogenetic abnormalities, whether spectroscopy can be used to follow the development of these subclones in an individual patient, and whether any of the spectroscopic abnormalities observed in CLL have prognostic significance.
Acknowledgements-We gratefully acknowledge the skilful technical assistance of Linda Verburg and Kristine Lee from the Manitoba Cancer Treatment and Research Foundation.
References
1. O’Brien S., Giglio A. de1 & Keating M. (1995) Advances in the biology and treatment of B-cell chronic lymphocytic leukemia. Blood 85, 307.
2. Juliusson G. & Gahrton G. (1993) Chromosomal abnorm- alities in B-cell chronic lymphocytic leukemia. In Chronic Lymphocytic Leukemia: Scientific Advances and Clinical Developments (Cheson B.D., Ed.), p. 83. Marcel Dekker,
New York.
3. Schena M., Larsson L.-G., Gottardi D., Gaidano G., Carlsson M., Nilsson K. & Caligaris-Cappio F. (1992) Growth and differentiation-associated expression of bcl-2 in B-chronic lymphocytic leukemia cells. Blood 79, 2981. 4. Hanada M., Delia D., Aiello A., Stadtmauer E. & Reed J.
C. (1993) Bcl-2 gene hypomethylation and high-level expression in B-cell chronic lymphocytic leukemia. Blood 82, 1820.
5. Aman P., Gordon J., Mellstedt H., Biberfeld P. & Klein G. (1988) Buoyant density characterization of neoplastic cell populations in patients with chronic B-lymphocytic leukemia. Eur. J. Haematol. 40, 142.
6. Greg E., Hamblin T., Smith J. & Stevenson F. (1988) Heterogeneity in neoplastic cell populations in chronic lymphocytic leukemia defined by immunglobulin expres- sion and secretion in vitro. Leukemia Res. 12, 123. 7. Mantsch H. H. & McElhaney R. N. (1991) Phospholipid
phase transitions in model and biological membranes as studied by infrared spectroscopy. Chem. Phys. Lipids 57, 213.
8. Surewicz W. K. & Mantsch H. H. (1988) New insight into protein secondary structure from resolution enhanced infrared spectra. Biochim. Biophys. Acta 952, 115. 9. Taillandier E. & Liquier F. (1992) Infrared spectroscopy of
Study of chronic lymphocytic leukemia cells 655 10. Rigas B., Morgallo S., Goldman I. S. & Wong P. T. T.
(1990) Human colorectal cancers display abnormal Fourier transform infrared spectra. Proc. Nut1 Acad. Sci. 87, 8140. 11. Choo L. P., Jackson M., Halliday W. C. & Mantsch H. H. (1993) Infrared spectroscopic characterisation of multiple sclerosis plaques in the human central nervous system. Biochim. Biophys. Acta 1182, 333.
12. Fabian H., Choo L. P., Szendrei G. I., Jackson M., Halliday W. C., Otvos L. & Mantsch H. H. (1993) Infrared spectroscopic characterisation of Alzheimer plaques. Appl. Spectrosc. 47, 1513.
13. Wong P. T. T., Goldstein S. M., Grekin R. C., Godwin T. A., Pivik C. & Rigas B. (1993) Distinct infrared spectro- scopic patterns of human basal cell carcinoma of the skin. Cancer Rex 53, 762.
14. Eysel H. H., Jackson M., Mantsch H. H. & Thomson G. T. D. (1993) Carbon dioxide clathrates: an IR spectroscopic marker for arthritis? Appl. Spectrosc. 47, 1519.
15. Shaw R. A., Kotowich S., Mantsch H. H. & Leroux M. (1996) Quantitation of protein, creatinine, and urea in urine by near-infrared spectroscopy. Clin. Biochem. 29, 11. 16. Fabian H., Jackson M., Murphy L., Watson P. H., Fichtner
I. & Mantsch H. H. (1995) A comparative infrared spectroscopic study of human breast tumours and breast tumour cell xenografts. Biospectroscopy 1, 37.
17. Polli E. & Semenza G. (1955) Deoxyribonucleic acids from normal and leukaemic human leucocyte. R.C. Inst. Lomb. Sci. Lett. (Rend. Sci.) 89, 160.
18. Benedetti E., Papineschi F., Vergamini P., Consolini R. & Spremolla G. (1984) Analytical infrared spectral differ- ences between human normal and leukaemic cells (CLL)-I. Leukemia Res. 8, 483.
19. Benedetti E., Palatresi M. P., Vergamini P., Papineschi F. & Spremolla G. (1985) New possibilities of research in chronic lymphatic leukemia by means of Fourier trans- form-infrared spectroscopy-II. Leukemia Rex 9, 1001. 20. Spremolla G., Benedetti E., Vergamini P., Andreucci M. C.
& Macchia P. (1988) An investigation of acute lympho- blastic leukemia (ALL) in children by means of infrared spectroscopy. Part IV. Haematologica 73, 21.
21. Benedetti E., Palatresi M. P., Vergamini P., Papineschi F., Andreucci M. C. & Spremolla G. (1986) Infrared char- acterization of nuclei isolated from normal and leukemic (B-CLL) lymphocytes: Part III. Appl. Spectrosc. 40, 39. 22. Johnston J. B., Verburg L., Shore T., Williams M., Israels
L. G. & Begleiter A. (1994) Combination therapy with
nucleoside analogs and alkylating agents. Leukemia 8, Suppl, 140.
23. Naumann D., Helm D. & Labischinski H. (1991) Microbiological characterizations by FT-IR spectroscopy. Nature 351, 81.
24. Wong P. T. T., Papavassiliou E. D. & Rigas B. (1991) Phosphodiester stretching bands in infrared spectra of human tissues and cultured cells. Appl. Spectrosc. 45, 1563.
25. Mantsch H. H. & Jackson M. (1995) Molecular spectro- scopy in biodiagnostics (from Hippocrates to Herschel and beyond). J. Mol. Struct. 347, 187.
26. Benedetti E., Teodori L., Trinca M. L., Vergamini P., Salvati F., Mauro F. & Spremolla G. (1990) A new approach to the study of human solid tumor cells by means of FT-IR microspectroscopy. Appl. Spectrosc. 44, 1276. 27. Juliusson G., Oscier D. G., Fitchett M., Ross F. M.,
Stockdill G., Mackie M. J., Parker A. C., Castoldi G. L., Cuneo A., Knuutila S., Elonen E. & Gahrton G. (1990) Prognostic subgroups in B-cell chronic lymphocytic leukemia defined by specific chromosome abnormalities. New Engl. J. Med. 323, 720.
28. Kay N. E., Ranhei E. A. & Peterson L. C. (1995) Tumor suppressor genes and clonal evolution in B-CLL. Leuk. Lymph. 18, 41.
29. Peterson L. C., Lindquist L. L., Church S. & Kay N. E. (1992) Frequent clonal abnormalities of chromosome band 13q14 in B-cell chronic lymphocytic leukemia: multiple clones, subclones, and nonclonal alterations in 82 midwest patients. Genes Chromosom. Cancer 4, 273.
30. Dohner H., Fischer K., Bentz M., Hansen K., Benner A., Cabot G., Diehl D., Schlenk R., Coy J., Stilgenbauer S., Volkmann M., Galle P. R., Poustka A., Hunstein W. & Lichter P. (1995) p53 gene deletion predicts for poor survival and non-response therapy with purine analogs in chronic B-cell leukemias. Blood 85, 1580.
31. Stilgenbauer S., Dohner H., Bulgay-Morschel M., Weitz S., Bentz M. & Lieter P. (1993) High frequency of monoallelic retinoblastoma gene deletion in B-cell chronic lymphocytic leukemia related by interphase cytogenetics. Blood 81, 2118.
32. Watanabe T., Hotta T., Ichikawa A., Kinoshita T., Hirokazu N., Uchida T., Murate T. & Saito H. (1994) The mdm-2 oncogene overexpression in chronic lympho- cytic leukemia and low-grade lymphoma of B-cell origin. Blood 84, 3158.