HAL Id: hal-02651393
https://hal.inrae.fr/hal-02651393
Submitted on 26 May 2021
HAL is a multi-disciplinary open access
archive for the deposit and dissemination of
sci-entific research documents, whether they are
pub-lished or not. The documents may come from
teaching and research institutions in France or
abroad, or from public or private research centers.
L’archive ouverte pluridisciplinaire HAL, est
destinée au dépôt et à la diffusion de documents
scientifiques de niveau recherche, publiés ou non,
émanant des établissements d’enseignement et de
recherche français ou étrangers, des laboratoires
publics ou privés.
in a dose-dependent manner
Cécile Gladine, N.C. Roy, Jean-Paul Rigaudière, Brigitte Laillet, Georges da
Silva Carvalho Leite, Charlotte Joly, Estelle Pujos-Guillot, Béatrice Morio,
Christine Feillet Coudray, Warren C. Mcnabb, et al.
To cite this version:
Cécile Gladine, N.C. Roy, Jean-Paul Rigaudière, Brigitte Laillet, Georges da Silva Carvalho Leite, et
al.. Increasing intake of long-chain n-3 PUFA enhances lipoperoxidation and modulates hepatic gene
expression in a dose-dependent manner. British Journal of Nutrition, Cambridge University Press
(CUP), 2012, 107, pp.1254-1273. �10.1017/S0007114511004259�. �hal-02651393�
Increasing intake of long-chain
n-3 PUFA enhances lipoperoxidation
and modulates hepatic gene expression in a dose-dependent manner
Ce´cile Gladine
1,2*, Nicole C. Roy
3,4,5, Jean-Paul Rigaudie`re
1,2, Brigitte Laillet
1,2, Georges Da Silva
1,2,
Charlotte Joly
1,2,6, Estelle Pujos-Guillot
1,2,6, Be´atrice Morio
1,2, Christine Feillet-Coudray
7,
Warren C. McNabb
3,4,5, Jean-Michel Chardigny
1,2and Blandine Comte
1,21INRA, UMR 1019, UNH, CRNH Auvergne, Clermont-Ferrand, F-63122 St Gene`s Champanelle, France
2Unite´ de Nutrition Humaine, Clermont Universite´, Universite´ d’Auvergne, Clermont-Ferrand, France
3Food Nutrition Genomics Team, Agri-Foods and Health Section, AgResearch Grasslands, Palmerston North 4442, New Zealand
4Nutrigenomics, New Zealand
5Riddet Institute, Massey University, Palmerston North 4442, New Zealand
6INRA, UMR 1019, Plateforme d’Exploration du Me´tabolisme, Clermont-Ferrand, France
7INRA, UMR 866, Dynamique Musculaire et Me´tabolisme, Montpellier, France
(Submitted 22 March 2011 – Final revision received 29 June 2011 – Accepted 30 June 2011 – First published online 14 September 2011)
Abstract
Long-chain (LC) n-3 PUFA have a broad range of biological properties that can be achieved at the gene expression level. This has been well described in liver, where LC n-3 PUFA modulate the expression of genes related to lipid metabolism. However, the complexity of biological pathway modulations and the nature of bioactive molecules are still under investigation. The present study aimed to investigate the dose – response effects of LC n-3 PUFA on the production of peroxidised metabolites, as potential bioactive molecules, and on global gene expression in liver. Hypercholesterolaemic rabbits received by daily oral administration (7 weeks) either oleic acid-rich oil or a mixture of oils providing 0·1, 0·5 or 1 % (groups 1, 2 and 3 respectively) of energy as DHA. Levels of specific peroxidised metabolites, namely 4-hydroxyhexenal (4-HHE) – protein adducts, issued from LC n-3 PUFA were measured by GC/MS/MS in liver in parallel to transcription profiling. The intake of LC n-3 PUFA increased, in a dose-dependent manner, the hepatic production of 4-HHE. At the highest dose, LC n-3 PUFA provoked an accumulation of TAG in liver, which can be directly linked to increased mRNA levels of lipoprotein hepatic receptors (LDL-receptor and VLDL-receptor). In groups 1 and 2, the mRNA levels of microsomal TAG transfer protein decreased, suggesting a possible new mechanism to reduce VLDL secretion. These modulations of genes related to lipoprotein metabolism were independent of PPARa signalling but were probably linked to the activation of the farnesol X receptor pathway by LC n-3 PUFA and/or their metabolites such as HHE.
Key words:n-3 PUFA: Lipoperoxidation: Microarray analysis: Liver: Gene expression
A plethora of data from epidemiological and experimental studies indicates that consumption of long-chain (LC) n-3 PUFA favourably modulates multiple biological processes involved in CVD, cancers, immune diseases, diabetes, brain
health and hepatic steatosis(1). Among the mechanisms
pro-posed to explain the effects of LC n-3 PUFA, the most often reported include the metabolic interconversion into bioactive eicosanoids and/or docosanoids or the alteration of membrane self-organising lipid raft domains. More recently, LC n-3 PUFA
have been identified as powerful gene expression modulators, notably in the liver where they are associated with the modulation of several genes related to lipid and lipoprotein
metabolism, explaining their hypolipidaemic effects(2,3).
The effects of LC n-3 PUFA on gene transcription were thought primarily to be mediated by a single subfamily of orphan nuclear receptors: the PPAR. However, it is now becoming evident that LC n-3 PUFA can affect the expression of several different genes either via direct interactions or
* Corresponding author: C. Gladine, fax þ 33 4 73 62 47 55, email [email protected]
Abbreviations: 4-HHE, 4-hydroxyhexenal; 4-HNE, 4-hydroxynonenal; CCL4, chemokine (C – C motif) ligand 4; cRNA, complementary RNA; CXCL3, chemokine (C – X – C motif) ligand 3; ERK, extracellular signal-regulated kinase; FAME, fatty acid methyl esters; FC, fold change; FXR, farnesol X receptor; GO, Gene Ontology; IKK, IkB kinase; IPA, ingenuity pathways analysis; KLKB1, kallikrein B, plasma (Fletcher factor) 1; LC, long chain; LDLR, LDL receptor; MTTP, microsomal TAG transfer protein; SERPINA1, serpin peptidase inhibitor, clade A (a1 antiproteinase, antitrypsin), member 1; SERPIND1, serpin peptidase inhibitor, clade D (heparin cofactor), member 1; TBARS, thiobarbituric acid-reactive substances; VLDLR, VLDL receptor.
qThe Authors 2011
British
Journal
of
Nutrition
https://www.cambridge.org/core . IP address: 78.202.154.114 , on 26 May 2021 at 12:29:08, subject to the Cambridge Core terms of use, available at
https://www.cambridge.org/core/terms
.
indirectly through additional transcription factors including hepatic nuclear factor 4a, retinoid X receptor a, sterol regulat-ory element-binding protein-1c, liver X receptors a and b,
far-nesol X receptor (FXR) and NF-kB(4). This made the
uncovering of biological pathways underlying the effects of LC n-3 PUFA much more complex than initially thought.
Metabolism of LC n-3 PUFA can influence the nature of the bioactive compounds responsible for the modulation of gene expression. Indeed, LC n-3 PUFA are not only enzymatically metabolised into eicosanoids but they are also very prone to non-enzymatic oxidation, leading to the formation of a variety
of peroxidised metabolites(5). This reaction, known as lipid
peroxidation, is particularly intense in oxidative stress con-ditions, making peroxidated metabolites potential key modu-lators of gene expression. Hydroxyalkenals are a family of aldehydes produced in abundance during peroxidation of PUFA. They comprise 4-hydroxynonenal (4-HNE) issued from n-6 PUFA and 4-hydroxyhexenal (4-HHE) generated
from n-3 PUFA and, more specifically, DHA (20 : 6n-3)(6)
which is the abundant n-3 PUFA in most tissues. Hydroxyalk-enals, notably 4-HNE which has been identified and studied much more extensively and earlier than 4-HHE, are not only highly reactive molecules that covalently bind proteins, lipids and DNA but they are also known as signal molecules
in cells(7). This makes them interesting targets to focus on
when investigating the effects of LC n-3 PUFA and their metab-olites on the modulation of gene expression.
In this context, we hypothesised that increasing intake of LC n-3 PUFA could, in a dose-dependent manner, enhance the production of 4-HHE and differentially influence the expression of genes in the liver as a central organ of lipid metabolism and oxidative stress. In order to investigate these relationships, we conducted a dose – response supplemen-tation trial in hypercholesterolaemic rabbits. The choice of this model was dictated by the need to induce a pathological condition (i.e. hypercholesterolaemia and steatosis) known to
induce metabolic disturbance and inflammation(8), which can
be modulated by LC n-3 PUFA. Moreover, this animal model presents several advantages, among which the rapidity of the induction of hypercholesterolaemia, a lipid metabolism close to what is observed in humans, and the absence of genetic modifications making easier the understanding of gene expression modulations. The choice of an overall gene expression analysis was dictated by the need to study a complex biological system influenced by many factors including the metabolism of LC n-3 PUFA. This also gives the opportunity to generate new insights about the
nutrige-nomic effects of LC n-3 PUFA in the context of
hypercholesterolaemia.
Materials and methods Animals and diets
New Zealand White male rabbits (Charles River Laboratories, L’Arbresle, France) of 12 weeks of age (mean weight ¼ 1874
(SEM 138) g) were used in the present study. They were
individually housed and maintained under conventional
conditions with a temperature of 228C and a 12 h light – 12 h dark cycle (07.00 – 19.00 hours). After 3 weeks of adaptation, rabbits were allocated to four experimental groups (i.e. con-trol; LC n-3 PUFA-dose 1 or group 1; LC n-3 PUFA-dose 2 or group 2; LC n-3 PUFA-dose 3 or group 3) according to their weights and plasma cholesterol concentrations in order to obtain homogeneous groups on these two criteria. Then, animals were fed daily for 7 weeks with 100 g of a choles-terol-enriched diet (Table 1) providing 0·5 g cholesterol/d per rabbit. At the same time 5 d/week, rabbits received 2 ml of either oleic acid-rich sunflower oil (Lesieur, Asnie`res-sur-Seine, France; control, n 6) or a mix of oleic acid-rich sun-flower oil and purified tuna oil (Tuna oil 25DHA, Qualitysil-ver; Polaris, Pleuven, France) providing 0·1 % (LC n-3 PUFA-dose 1 or group 1, n 8), 0·5 % (LC n-3 PUFA-PUFA-dose 2 or group 2, n 8) or 1 % (LC n-3 PUFA-dose 3 or group 3, n 7) of energy as DHA (22 : 6n-3). The first dose (dose 1) has been chosen to mimic the nutritional recommendation for DHA in the
human diet(9), whereas doses 2 and 3 are supra-nutritional,
comparable with what is often used in intervention studies. Oil mixtures were prepared in advance in glass bottles
sealed under N2 and stored at 48C in the dark until use to
prevent fatty acid peroxidation. Animals were weighed once per week and food intake was recorded five times per week. There were no statistical differences between the groups for these two parameters (data not shown). All animals were maintained and handled according to the rec-ommendations of the Institutional Ethics Committee of the INRA, in accordance with decree no. 87-848.
Sample collection
After 7 weeks of the diet, overnight fasted rabbits were anaesthetised with pentobarbital (30 mg/kg, intravenously). Blood was collected from the marginal ear vein in tubes containing EDTA (3 mm, pH 8·2) and butylated hydroxyto-luene (0·44 mg/ml fresh blood). Plasma was recovered by centrifugation (2700 g, 10 min, 48C) and rapidly distributed
into 1·5 ml microtubes, flushed with N2 and frozen in
liquid N2. Liver was rapidly removed, rinsed with 0·9 %
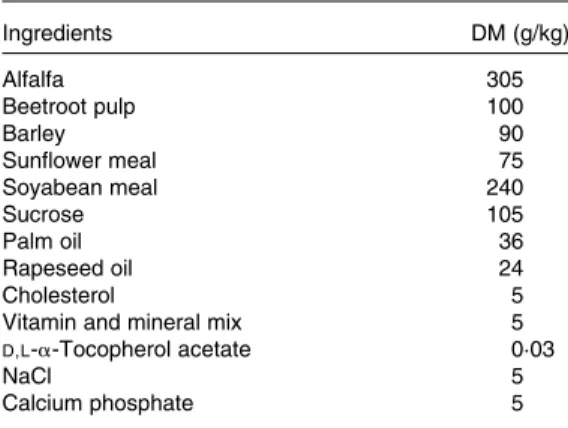
Table 1. Composition of the cholesterol-enriched diet given to New Zealand White rabbits during the 7-week experiment Ingredients DM (g/kg) Alfalfa 305 Beetroot pulp 100 Barley 90 Sunflower meal 75 Soyabean meal 240 Sucrose 105 Palm oil 36 Rapeseed oil 24 Cholesterol 5
Vitamin and mineral mix 5
D,L-a-Tocopherol acetate 0·03 NaCl 5 Calcium phosphate 5
British
Journal
of
Nutrition
https://www.cambridge.org/core . IP address: 78.202.154.114 , on 26 May 2021 at 12:29:08, subject to the Cambridge Core terms of use, available at
https://www.cambridge.org/core/terms
.
NaCl and a sample (approximately 5 g) was collected from
the left lobe, frozen in liquid N2 and stored at 2 808C
until further analysis.
Fatty acid composition of liver phospholipids
Total lipids were extracted from liver samples, as described
by Folch et al.(10), and subsequently separated into neutral
and polar lipids by solid-phase extraction (C18 SPE cartridge; Macherey-Nagel, Hoerdt, France). The solid phase extraction cartridges were washed with chloroform (4 ml) to elute neutral
lipids followed by 8 ml methanol to elute polar lipids(11).
Phospholipids were evaporated to dryness under a gentle
stream of N2and dissolved in methanol and toluene (4:1, v/v)
for methylation. Phospholipid fatty acid methyl esters (FAME) were obtained after trans-esterification with sodium methox-ide in methanol (Sigma-Aldrich, St Louis, MO, USA) followed by acid trans-esterification with boron trifluoride in methanol
(14 %; Sigma-Aldrich)(12).
GC analysis of FAME was performed using a gas chromato-graph GC Trace (Thermo Fischer Scientific, Courtaboeuf, France), equipped with a fused silica CP-Sil 88 capillary column (100 % cyanopropyl-polysiloxane, 100 m, 0·25 mm in inner diameter, 0·20 mm in film thickness; Varian S.A, Les Ulis, France), a programmed temperature vaporisation injector (2508C) and a flame-ionisation detector. The sample (1 ml) was injected in the splitless mode. The oven temperature pro-gramme ran between 70 and 2258C in four separate steps. He gas was used as a carrier, with a constant pressure (264 kPa). The identities of sample methyl esters were deter-mined by comparing their relative retention times with those of external well-known FAME standards (Supelcoe 37 Com-ponent Fatty Acid Methyl Esters Mix and Menhaden Oil; Sigma Aldrich, St Quentin Fallavier, France). Other standard FAME mixtures were obtained from Nu-Chek-Prep (Elysian, MN, USA).
Plasma lipid profiles
Plasma samples were analysed for their contents in total cholesterol, HDL-cholesterol, TAG and apoB using a Konelab 20 analyser (Thermo Electron SA, Cergy-Pontoise, France). LDL-cholesterol concentration was calculated by the Friede-wald equation as follows:
LDL-cholesterol ðmg=lÞ ¼ total cholesterol 2 HDL-cholesterol 2 ðTAG=5Þ:
TAG and cholesterol concentration in liver
Liver samples (200 mg) were homogenised in a saline solution (500 ml) with a Polytron homogeniser PT-MR2100 (Kinerma-tica AG, Littau/Luzern, Switzerland) and lipids were extracted by chloroform – methanol (2:1, v/v) with overnight agitation. The chloroform phase was recovered after centrifugation and evaporated under dry air. Lipids (including TAG)
were then saponified with 0·5 mM-KOH – ethanol at 708C
for 30 min followed by the addition of 0·15 mM-MgSO4 to
neutralise the mixture. After centrifugation (2000 g, 5 min), glycerol from TAG in the supernatant was estimated by an enzymatic assay (TG PAP 150 kits; Bio-Merieux, Marcy-l’Etoile, France). Cholesterol in the lipid residue was dissolved in isopropanol and measured enzymatically (Cholesterol RTUTM; Bio-Merieux).
Glutathione system
Liver contents of reduced glutathione and glutathione disul-phide (oxidised glutathione) were measured according to
the method of Griffith(13). The enzymatic activities of
gluta-thione peroxidase, glutagluta-thione reductase and glutagluta-thione-S- glutathione-S-transferase were assessed as already described by Flohe &
Gunzler(14), Carlberg & Mannervik(15) and Habig et al.(16),
respectively.
Lipoperoxidation biomarkers
Concentrations of thiobarbituric acid-reactive substances (TBARS), as indices of global lipid peroxidation, were measured in liver homogenates according to the method of
Sunderman et al.(17). Moreover, to determine the specific
per-oxidation of n-6 and n-3 PUFA, we measured the hepatic con-centrations of thioether protein adducts with HNE (4-HNE-P) and HHE (4-HHE-P), respectively. Because of the high reactiv-ity of hydroxyalkenals, the measurement of protein adducts is a more reliable lipoperoxidation biomarker. These adducts were assessed by GC/MS. Sample preparation was done
according to the method described by Asselin et al.(18). Briefly,
100 mg of liver tissue were mixed with 1 ml of cold buffer (pH
7·0) containing 39 mM-HEPES, 0·4 mM-EDTA and 0·9 mM
-buty-lated hydroxytoluene and immediately treated with 1·14 mM
-NaB2H4to reduce aldehydes into their chemically stable2
H-labelled alcohol derivatives. Then, proteins were precipitated with saturated sulfosalicylic acid (0·2 ml). After centrifugation,
the protein pellet was resuspended into 8 mM-guanidine buffer
(0·5 ml), 0·25 nmol of the labelled internal standard
[2H11](TBDMS) were added, and an incubation with Raney
nickel (approximately 2 g) was performed (overnight, 558C) in order to cleave the thioether linkages and reduce the C – C bonds. Free saturated derivatives were then extracted three times with ethyl acetate. The extract was evaporated
under a gentle stream of N2and treated with 75 ml
N-methyl-N-(t-butyldimethylsylyl)-trifluoroacetamide
1,4-dihydroxyno-nene (DHN) for 2 h at 808C for derivatisation. Samples were analysed using a triple quadrupole mass spectrometer Quattro Micro (Waters Corporation, Manchester, UK) coupled with a GC Agilent 6890N system (Agilent Technologies, Palo Alto, CA, USA), operating in the positive chemical ionisation mode using isobutane as the reagent gas. Injections (1 ml) were made at 2508C in the split mode (1/20). The carrier gas was high-purity He at a constant flow rate of 0·7 ml/min. Chro-matographic separation was performed using an HP-5MS Agi-lent Technologies capillary column (50 m £ 0·2 mm in inner diameter £ 0·33 mm in phase thickness; Agilent Technologies) under the following conditions: 1708C for 1 min, increased by
British
Journal
of
Nutrition
https://www.cambridge.org/core . IP address: 78.202.154.114 , on 26 May 2021 at 12:29:08, subject to the Cambridge Core terms of use, available at
https://www.cambridge.org/core/terms
.
108C/min until 2208C, 28C/min until 2358C, 58C/min until 2508C and then by 308C/min until 3008C. At the end of each run, temperature was kept at 3008C for 5 min to purify the column. MS parameters were optimised using the stan-dard solutions. Maximum sensitivity was obtained for an ion-source temperature set at 1208C, an electron energy at 90 eV and an emission current at 300 mA.
Quantification was achieved by measuring product ions (multiple reaction monitoring) from the fragmentation of the
protonated [M þ H]þmolecules. Collision energy potentials
were then adjusted to optimise the signal for the most abundant
product (daughter) ions: m/z 390 . 258 for [2H]DHN (reduced
4-HNE), m/z 348 . 216 for [2H] 1,4-dihydroxyhexene (reduced
4-HHE) and m/z 400 . 268 for the internal standard [2H11]DHN
using argon as collision gas. Quantification was performed using calibration curves with external standards. Quantities of 4-HNE- and 4-HHE-P adducts that are reported in the present study represent averages of duplicate sample injections.
RNA isolation
Total RNA from liver tissue was isolated using the Norgen RNA Purification kit (Norgen Bioteck Corporation, Thorold, ON, Canada), according to the manufacturer’s instruction. RNA was quantified with a Nanodrop ND-1000 spectrophoto-meter (NanoDrop Technologies, Wilmington, DE, USA), and RNA integrity assessed with a RNA 6000 Nano Labchip kit using the Agilent 2100 Bioanalyzer (Agilent Technologies, Santa Clara, CA, USA). Only total RNA with an optical density 260/280 ratio . 1·8, an optical density 260/230 ratio . 1·7 and a RNA integrity number . 8 was used for microarray hybridisation.
Microarrays
RNA samples were labelled using the Agilent Quick-Amp Labelling kit (5190-0424; Agilent Technologies, Wilmington, DE, USA), according to the manufacturer’s instructions. Briefly, 500 ng of purified total RNA from each sample were amplified and reverse-transcribed in vitro to complementary DNA using the T7-polymerase, which was subsequently labelled with either cyanine 3-CTP or cyanine 5-CTP dyes (5188-1170-P; Agilent Technologies). Nanodrop ND-1000 was used to monitor the yield of amplification and dye incor-poration; all samples had a yield . 825 ng complementary RNA (cRNA) and a specific activity . 8·0 pmol Cy3 or Cy5 per mg cRNA. The fluorescently labelled cRNA was hybridised using the Agilent gene expression hybridisation kit (5188-5242-A; Agilent Technologies) following the manufacturer’s instructions. Briefly, 825 ng cyanine 3-labelled, linearly ampli-fied cRNA were mixed with 825 ng cyanine 5-labelled, linearly amplified cRNA. The mix was loaded onto the Agilent Rabbit Gene Expression Microarrays (4 £ 44k; Agilent Technologies) following a loop design and hybridisation proceeded in a hybridisation oven set to 658C for 17 h. Then, the slides were washed in solutions I, II and III (Agilent Technologies) and air-dried.
Slides were scanned immediately after washing using the Agilent DNA Microarray Scanner (G2565AA/G2565BA; Agilent Technologies), at photomultiplier tube voltages red and green. Spot identification and quantification were performed using Agilent Feature Extraction Software 7.0 (Agilent Technologies). The complete formatted dataset is deposited as Gene Expression Omnibus accession GSE27621, which can be accessed at http://www.ncbi.nlm.nih.gov/geo/.
Analysis of microarray data
Statistical analyses were performed using linear models for microarray analysis (Limma) from the Bioconductor
project(19). Quality of the microarray data was assessed on
diagnostic plots (box plots and density plots) and spatial images generated from the raw (non-processed) data. All twelve arrays passed these strict criteria and were included in the analyses. Intensity ratio values for all microarray spots were normalised using a global loess smoothing procedure to remove the effect of systematic variation in the microarrays and no background correction was necessary due to
homo-geneous hybridisation(20). The following three experimental
comparisons were performed: (1) control v. group 1, (2) control v. group 2 and (3) control v. group 3. For each experi-mental comparison, a candidate list of differentially expressed probe sets was generated by calculating a moderated t statistic for each probe set using the Limma package. The Limma library implements an empirical Bayes approach to assign differential gene expression. Probe sets that satisfied the criterion of $ 1·2-fold change (FC) with a moderated P, 0·05 were considered to be significantly different. This FC was chosen because previous studies have shown that the use of a level $ 1·6 can underestimate the number of genes that
are differentially regulated by a dietary treatment(21,22).
Ingenuity Pathways Analysis (IPA; Ingenuity Systems, Inc., Redwood City, CA, USA; www.ingenuity.com) was used to relate changes in gene expression levels to functional changes. The full dataset from the microarray analysis (including Entrez gene identification and gene expression values) was uploaded into IPA. The IPA library of canonical pathways identified those pathways that were most significant to the dataset. Genes differentially expressed and associated with the top 10 canonical pathways in the Ingenuity Pathways Knowledge Base are presented in the present paper. The significance of the association between a dataset and a specific canonical pathway was estimated in two ways: (1) the proportion of genes in the dataset included in the canonical pathway and (2) Fisher’s exact test is used to calculate a P value deter-mining the probability of the association between the dataset and the canonical pathway.
A complementary analysis was performed using EASE (software version 2.0; National Institutes of Health, Bethesda, MD, USA) to identify enriched biological themes within gene lists using Gene Ontology (GO) category over-representation
analysis(23). The same dataset as the one uploaded in IPA was
used. An EASE score (adjusted Fisher’s exact test for statistical significance) was calculated for the likelihood of over-representation of hierarchical categories based on biological
British
Journal
of
Nutrition
https://www.cambridge.org/core . IP address: 78.202.154.114 , on 26 May 2021 at 12:29:08, subject to the Cambridge Core terms of use, available at
https://www.cambridge.org/core/terms
.
processes, molecular functions and cellular components using the GO public database. Gene categories with an EASE score , 0·05 were considered to be significantly over-represented.
Statistics
Statistical analyses of fatty acid composition, lipoperoxidation parameters and liver glutathione level parameters were performed using GraphPad InStat version 3.06 (GraphPad Software, San Diego, CA, USA; www.graphpad.com). Data are presented as means with their standard errors (n 6 – 8) and followed a Gaussian distribution (Kolmogorov – Smirnov test), and differences between standard deviations (Bartlett’s test) were not significant except for TBARS, TC:HDL-choles-terol, SFA and n-3 PUFA, which were then analysed using a non-parametric test (Kruskal – Wallis test). All other data were analysed using a one-way ANOVA, and all significant differences among means at the level of P, 0·05 were tested with Tukey – Kramer’s post hoc analysis. Differences were considered as a trend when 0·05 , P, 0·1.
Results
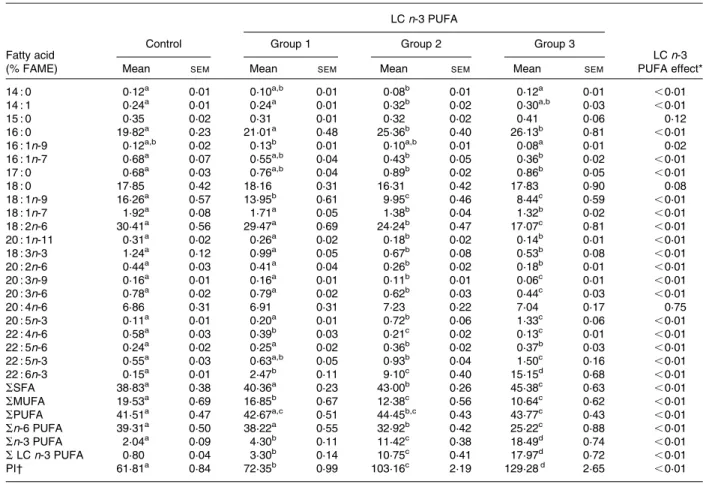
Effects of long-chain n-3 PUFA on fatty acid composition of liver phospholipids
Fatty acid composition of liver phospholipids was measured to assess the incorporation of dietary LC n-3 PUFA. Table 2 shows that the proportion of LC n-3 PUFA (i.e. EPA (20 : 5n-3), docosapentaenoic acid (DPA) (22 : 5n-3) and DHA (22 : 6n-3)) in the liver of rabbits, given the tuna oil sup-plements, was substantially increased in a dose-dependent manner in comparison with the control group (4 £ , 13 £ and 22 £ , P, 0·01 in groups 1, 2 and 3, respectively). All the dietary treatments raised the DHA contents, reaching 15 % of total fatty acids in group 3 and 100 times higher than the levels in the control group (P, 0·01). The incorpor-ation of LC n-3 PUFA was positively correlated with the
perox-idisability index (r20·81, P, 0·001), which was twice higher in
group 3 than in the control group (P, 0·0001). Whatever the dose of LC n-3 PUFA, arachidonic acid (20 : 4n-6) concen-tration was unchanged but linoleic acid (18 : 2n-6) proportion decreased by 3, 20 and 44 % in groups 1, 2 and 3, respectively
Table 2. Fatty acid composition (relative percentage of fatty acid methyl ester) of liver phospholipids from rabbits fed daily for 7 weeks either oleic sunflower oil (control) or a mixture of oils providing 0·1 % (group 1), 0·5 % (group 2) or 1 % (group 3) of daily energy intake as DHA (Mean values with their standard errors, six to eight animals per group)
LC n-3 PUFA
Fatty acid (% FAME)
Control Group 1 Group 2 Group 3
LC n-3 PUFA effect*
Mean SEM Mean SEM Mean SEM Mean SEM
14 : 0 0·12a 0·01 0·10a,b 0·01 0·08b 0·01 0·12a 0·01 ,0·01 14 : 1 0·24a 0·01 0·24a 0·01 0·32b 0·02 0·30a,b 0·03 ,0·01 15 : 0 0·35 0·02 0·31 0·01 0·32 0·02 0·41 0·06 0·12 16 : 0 19·82a 0·23 21·01a 0·48 25·36b 0·40 26·13b 0·81 ,0·01 16 : 1n-9 0·12a,b 0·02 0·13b 0·01 0·10a,b 0·01 0·08a 0·01 0·02 16 : 1n-7 0·68a 0·07 0·55a,b 0·04 0·43b 0·05 0·36b 0·02 ,0·01 17 : 0 0·68a 0·03 0·76a,b 0·04 0·89b 0·02 0·86b 0·05 ,0·01 18 : 0 17·85 0·42 18·16 0·31 16·31 0·42 17·83 0·90 0·08 18 : 1n-9 16·26a 0·57 13·95b 0·61 9·95c 0·46 8·44c 0·59 ,0·01 18 : 1n-7 1·92a 0·08 1·71a 0·05 1·38b 0·04 1·32b 0·02 ,0·01 18 : 2n-6 30·41a 0·56 29·47a 0·69 24·24b 0·47 17·07c 0·81 ,0·01 20 : 1n-11 0·31a 0·02 0·26a 0·02 0·18b 0·02 0·14b 0·01 ,0·01 18 : 3n-3 1·24a 0·12 0·99a 0·05 0·67b 0·08 0·53b 0·08 ,0·01 20 : 2n-6 0·44a 0·03 0·41a 0·04 0·26b 0·02 0·18b 0·01 ,0·01 20 : 3n-9 0·16a 0·01 0·16a 0·01 0·11b 0·01 0·06c 0·01 ,0·01 20 : 3n-6 0·78a 0·02 0·79a 0·02 0·62b 0·03 0·44c 0·03 ,0·01 20 : 4n-6 6·86 0·31 6·91 0·31 7·23 0·22 7·04 0·17 0·75 20 : 5n-3 0·11a 0·01 0·20a 0·01 0·72b 0·06 1·33c 0·06 ,0·01 22 : 4n-6 0·58a 0·03 0·39b 0·03 0·21c 0·02 0·13c 0·01 ,0·01 22 : 5n-6 0·24a 0·02 0·25a 0·02 0·36b 0·02 0·37b 0·03 ,0·01 22 : 5n-3 0·55a 0·03 0·63a,b 0·05 0·93b 0·04 1·50c 0·16 ,0·01 22 : 6n-3 0·15a 0·01 2·47b 0·11 9·10c 0·40 15·15d 0·68 ,0·01 SSFA 38·83a 0·38 40·36a 0·23 43·00b 0·26 45·38c 0·63 ,0·01 SMUFA 19·53a 0·69 16·85b 0·67 12·38c 0·56 10·64c 0·62 ,0·01 SPUFA 41·51a 0·47 42·67a,c 0·51 44·45b,c 0·43 43·77c 0·43 ,0·01 Sn-6 PUFA 39·31a 0·50 38·22a 0·55 32·92b 0·42 25·22c 0·88 ,0·01 Sn-3 PUFA 2·04a 0·09 4·30b 0·11 11·42c 0·38 18·49d 0·74 ,0·01 SLC n-3 PUFA 0·80 0·04 3·30b 0·14 10·75c 0·41 17·97d 0·72 ,0·01 PI† 61·81a 0·84 72·35b 0·99 103·16c 2·19 129·28d 2·65 ,0·01
LC, long-chain; FAME, fatty acid methyl esters; PI, peroxidisability index.
a,b,c,dMean values with unlike superscript letters were significantly different (P, 0·05).
* Data were analysed using a one-way ANOVA, and all significant differences among means at the level of P, 0·05 were tested with the Tukey– Kramer post hoc analysis.
† PI ¼ (% dienoic £ 1) þ (% trienoic £ 2) þ (% tetraenoic £ 3) þ (% pentaenoic £ 4) þ (% hexaenoic £ 5).
British
Journal
of
Nutrition
https://www.cambridge.org/core . IP address: 78.202.154.114 , on 26 May 2021 at 12:29:08, subject to the Cambridge Core terms of use, available at
https://www.cambridge.org/core/terms
.
(P, 0·01), when compared with the control condition. More generally, the progressive incorporation of LC n-3 PUFA in liver phospholipids (17 % of total FAME in group 3 v. control) induced a similar reduction of the incorporation of n-6 PUFA (2 14 % of total FAME in group 3 v. control). The concen-trations of most other fatty acids were significantly changed by the LC n-3 PUFA supplementations but to a lesser extent.
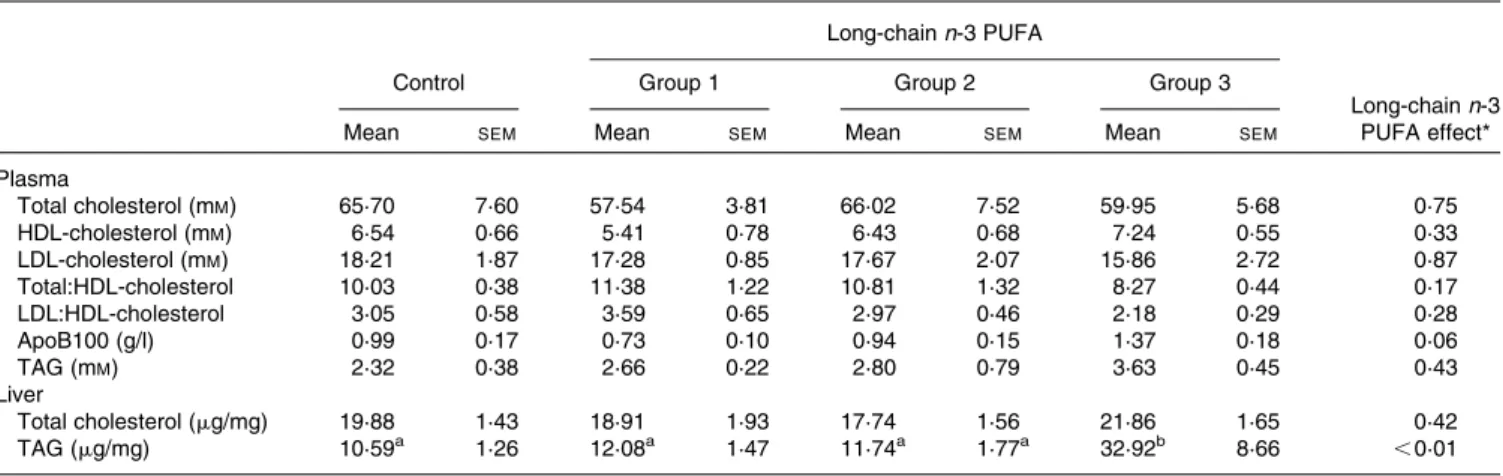
Effects of long-chain n-3 PUFA on plasma and liver lipids and apoB100
Plasma and liver lipid profiles were determined to investigate the effects of LC n-3 PUFA on cholesterol and TAG meta-bolism. Table 3 shows that the concentrations of plasma biomarkers were unchanged by none of the LC n-3 PUFA doses. In liver, total cholesterol was not modified by LC n-3 PUFA supplementation but there was a strong increase in
TAG with dose 3 (3 £ in comparison with the control,
P, 0·01). This effect on TAG accumulation in liver was not dose-dependent but occurred only with the highest dose of LC n-3 PUFA.
Effect of long-chain n-3 PUFA on liver glutathione metabolism
Glutathione, one the main endogenous and intracellular antioxidant, and biomarkers of its metabolism were quantified in the liver in order to estimate the antioxidant status of rabbits and the effects of LC n-3 PUFA. None of the different parameters analysed was significantly affected by LC n-3 PUFA, as shown in Table 4. However, the data show that group 3 tended to have a distinct profile in comparison with the other groups. In contrast to groups 1 and 2, when comparing group 3 with the control, reduced glutathione con-centration was 12 % lower while oxidised glutathione 27 % higher, leading to a 36 % higher reduced glutathione:oxidised glutathione ratio (NS).
Effect of long-chain n-3 PUFA on liver lipid peroxidation Several biomarkers of lipid peroxidation were measured to assess the dose – response effects of LC n-3 PUFA supple-mentations on the endogenous production of peroxi-dised metabolites (Fig. 1). As expected with regard to the
Table 3. Concentration of total cholesterol, HDL-cholesterol, LDL-cholesterol, apoB100 and TAG from rabbits fed either oleic sunflower oil (control) or a mixture of oils providing 0·1 % (group 1), 0·5 % (group 2) or 1 % (group 3) of daily energy intake as DHA
(Mean values with their standard errors, six to eight animals per group)
Long-chain n-3 PUFA
Control Group 1 Group 2 Group 3
Long-chain n-3 PUFA effect*
Mean SEM Mean SEM Mean SEM Mean SEM
Plasma Total cholesterol (mM) 65·70 7·60 57·54 3·81 66·02 7·52 59·95 5·68 0·75 HDL-cholesterol (mM) 6·54 0·66 5·41 0·78 6·43 0·68 7·24 0·55 0·33 LDL-cholesterol (mM) 18·21 1·87 17·28 0·85 17·67 2·07 15·86 2·72 0·87 Total:HDL-cholesterol 10·03 0·38 11·38 1·22 10·81 1·32 8·27 0·44 0·17 LDL:HDL-cholesterol 3·05 0·58 3·59 0·65 2·97 0·46 2·18 0·29 0·28 ApoB100 (g/l) 0·99 0·17 0·73 0·10 0·94 0·15 1·37 0·18 0·06 TAG (mM) 2·32 0·38 2·66 0·22 2·80 0·79 3·63 0·45 0·43 Liver Total cholesterol (mg/mg) 19·88 1·43 18·91 1·93 17·74 1·56 21·86 1·65 0·42 TAG (mg/mg) 10·59a 1·26 12·08a 1·47 11·74a 1·77a 32·92b 8·66 ,0·01
* Data were analysed using a one-way ANOVA, and all significant differences among means at the level of P, 0·05 were tested with the Tukey– Kramer post hoc analysis.
Table 4. Liver concentration of reduced (GSH) and oxidised (GSSG) glutathione (nmol/g fresh tissue) and activities (U/g protein) of glutathione peroxi-dase (GPX), glutathione reductase (GR) and glutathione-S-transferase (GST) from rabbits fed daily either oleic sunflower oil (control) or a mixture of oleic sunflower oil and a DHA-enriched tuna oil providing 0·1 % (group 1), 0·5 % (group 2) or 1 % (group 3) of daily energy intake as DHA
(Mean values with their standard errors, six to eight animals per group)
Long-chain n-3 PUFA
Control Group 1 Group 2 Group 3
Long-chain n-3 PUFA effect*
Mean SEM Mean SEM Mean SEM Mean SEM
GSH (nmol/g) 6455 343 7013 252 6917 404 5676 402 0·13 GSSG (nmol/g) 44·4 6·5 42·6 4·9 39·7 3·1 56·6 6·2 0·25 Redox potential (mV)† 2202·68 2·89 2205·17 1·89 2205·30 1·48 2195·81 2·47 0·05 GPX (mU/mg protein) 3179 164 3080 158 3094 111 2545 216 0·13 GR (mU/mg protein) 101·5 3·9 103·3 5·8 101·6 4·1 99·2 2·5 0·97 GST (mU/mg protein) 3926 388 4698·76 363 4128 316 3502 252 0·19
* Data were analysed using a one-way ANOVA, and all significant differences among means at the level of P, 0·05 were tested with the Tukey– Kramer post hoc analysis. † Redox potential (Ehc), referring to the half-cell reduction potential of the GSSG/2GSH couple, was calculated using the Nernst equation (258C, pH 7·0)(60).
British
Journal
of
Nutrition
https://www.cambridge.org/core . IP address: 78.202.154.114 , on 26 May 2021 at 12:29:08, subject to the Cambridge Core terms of use, available at
https://www.cambridge.org/core/terms
.
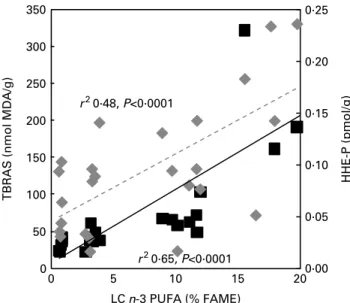
peroxidisability index determined in liver phospholipids (Table 2), lipid peroxidation was substantially increased in a dose-dependent manner in the liver of rabbits given the tuna oil supplements (Fig. 2). TBARS concentration rose by
38, 119 and 632 % in groups 1, 2 and 3, respectively. This dose – response relationship was confirmed by the positive correlation between LC n-3 PUFA incorporation into liver
phospholipids and the levels of TBARS (r2 0·65, P, 0·0001;
Fig. 2). The analysis of specific metabolites produced from n-6 and n-3 PUFA peroxidation, namely 4-HNE-P and 4-HHE-P, was also performed. Because of the high reactivity of these molecules as free, we chose to quantify the alde-hyde – protein adducts. Fig. 1(B) and (C) shows that lipid peroxidation was mainly associated with n-3 PUFA. Indeed, 4-HHE-P hepatic levels increased by 16, 84 and 227 % in groups 1, 2 and 3, respectively (P¼ 0·003), whereas con-centrations of 4-HNE-P were unchanged. In the control group, HNE-P levels were almost ten times higher than P levels and despite the substantial increase in 4-HHE-P levels of group 3, they still remain twice lower than 4-HNE-P levels. Moreover, linear regression presented in Fig. 2 shows that the hepatic contents of LC n-3 PUFA phos-pholipids were positively correlated with those of 4-HHE-P
(r2 0·48, P¼ 0·001), suggesting again a dose-dependent
response; however, only group 3 was significantly different from the control group. Overall, Figs. 1 and 2 show that diet-ary LC n-3 PUFA led to a raised level of lipoperoxidation, essentially due to n-3 PUFA peroxidation without significant modification of n-6 PUFA peroxidation. Finally, the positive correlations existing between dietary LC n-3 PUFA and their
incorporation into liver phospholipids (r2 0·97, data not
shown), and LC n-3 PUFA incorporation into liver phospholi-pids and the production of TBARS and 4-HHE-P, both confirm the dose-dependent relationships between the intake of LC n-3 PUFA and liver lipoperoxidation.
0·00 0·50 1·00 1·50 2·00 2·50 3·00 (A) (B) (C) TBARS (nmol MD A/g) a a,b b c 0·00 0·50 1·00 1·50 2·00 2·50 3·00 3·50 4·00 4·50
Control Group 1 Group 2 Group 3 Control Group 1 Group 2 Group 3
4-HNE-P (nmol/g) a a a a 0·00 0·50 1·00 1·50 2·00 2·50
Control Group 1 Group 2 Group 3
4-HHE-P (nmol/g)
a
a
a
b
Fig. 1. Dose – response effects of dietary long-chain n-3 PUFA on lipoper-oxidation measured as (A) thiobarbituric acid-reactive substances (TBARS), a general biomarker of lipoperoxidation, and thioether aldehyde – protein adducts, namely (B) 4-hydroxynonenal – protein (4-HNE-P) and (C) 4-hydro-xyhexenal – protein (4-HHE-P), by-products issued specifically from per-oxidation of n-6 PUFA and n-3 PUFA, respectively. Values are means (six to eight animals per group), with standard errors represented by vertical bars. Data were analysed using a one-way ANOVA, and all significant differences among means at the level of P, 0·05 were tested with the Tukey – Kramer post hoc analysis.a,b,cMean values with unlike letters were significantly different (P, 0·05). MDA, malondialdehyde.
0·00 0·05 0·10 0·15 0·20 0·25 0 50 100 150 200 250 300 350 0 5 10 15 20
TBRAS (nmol MDA/g)
LCn-3 PUFA (% FAME)
HHE-P (pmol/g)
r2 0·48, P<0·0001
r2 0·65, P<0·0001
Fig. 2. Correlations between long-chain (LC) n-3 PUFA incorporation into liver phospholipids and lipoperoxidation biomarkers. Correlation coeffi-cients between a set of data correspond to the Pearson coefficient (r) and were calculated using GraphPad InStat version 3.06 (GraphPad Software, San Diego, CA, USA; www.graphpad.com). TBARS, thiobarbituric acid-reactive substances; MDA, malondialdehyde; FAME, fatty acid methyl esters; HHE-P, hydroxyhexenal–protein.
British
Journal
of
Nutrition
https://www.cambridge.org/core . IP address: 78.202.154.114 , on 26 May 2021 at 12:29:08, subject to the Cambridge Core terms of use, available at
https://www.cambridge.org/core/terms
.
Effects of long-chain n-3 PUFA on liver gene expression Global gene expression changes in the liver of rabbits fed the three different doses of LC n-3 PUFA were compared with control rabbits. The microarray analyses revealed 314, 387 and 370 genes differently expressed (FC $ 1·2, P, 0·05) in groups 1, 2 and 3, respectively. As shown in the Venn diagram (Fig. 3), thirty-eight genes were common between the three groups. Most genes had increased levels of expression with LC n-3 PUFA except with dose 3 where mRNA levels of hepa-tic genes were mostly reduced. The uploading of datasets into IPA reveals that more than 80 % of genes differentially expressed were eligible for network generation and most of them were also associated with pathways and functions.
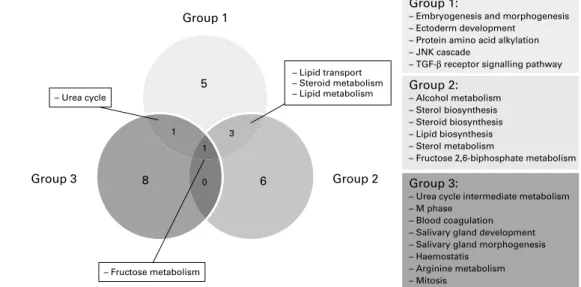
Differentially expressed genes were classified into GO categories. The top ten GO classifications for biological pro-cesses for the three groups are represented in Fig. 4. As shown in the overlapping circles, groups 1 and 2 shared almost half of the identified biological processes and most of them were associated with lipid metabolism: lipid transport,
steroid metabolism, lipid metabolism, sterol biosynthesis, steroid biosynthesis, lipid biosynthesis and sterol metabolism. Group 3 is differentiated by the low number of biological processes in common with groups 1 and 2 and the absence of links with lipid metabolism. The most over-represented biological processes in group 3 are related to urea meta-bolism and blood coagulation.
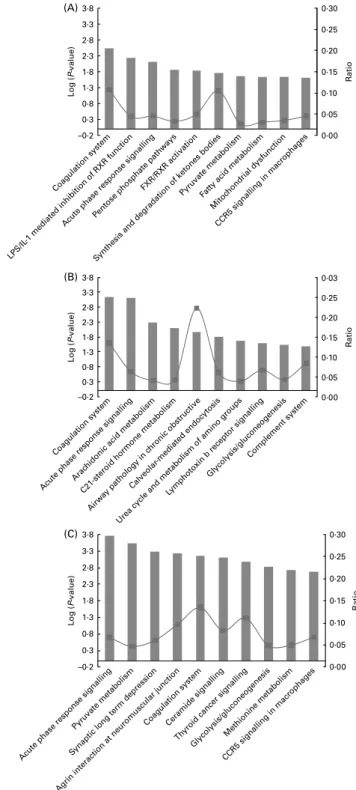
The top ten metabolic and signalling pathways showing significant changes in gene expression levels for the three experimental groups are reported in Fig. 5 and Table 5. Pathways related to inflammation and coagulation were over-represented in all groups, whereas lipid metabolism pathways were only associated with groups 1 and 2. Path-ways related to energy metabolism were also well represented in all groups.
Effects of long-chain n-3 PUFA on inflammation. The
‘acute-phase response signalling’ pathway is one of the most significant pathways associated with datasets. It is also one of the top three pathways in the three groups. Interestingly, the association of this pathway to the dataset increases with the dose of LC n-3 PUFA. Among the twenty-three genes differently expressed, three were common between the three groups. These included the serine peptidase inhibitors serpin peptidase inhibitor, clade A (a1 antiproteinase, anti-trypsin), member 1 (SERPINA1) and serpin peptidase inhibi-tor, clade D (heparin cofactor), member 1 (SERPIND1) genes as well as the suppressor of cytokine signalling. Some of the genes, whose abundance was significantly modulated, include gene-encoding proteins involved in signal transduction such as v-Ki-ras2 Kirsten rat sarcoma viral oncogene homologue, mitogen-activated protein kinase kinase 4 and Neuroblastoma RAS viral (v-ras) oncogene homologue. Other molecules were specific to either group 1, 2 or 3. In group 1, the expression level of protease inhibitor and cytokine transporter a2-macro-globulin genes was lowered in comparison with the control group. The abundance of several genes was specifically changed in group 2. Among them, the reduced expression Group 3 165 up-regulated 205 down-regulated Group 1 161 up-regulated 153 down-regulated Group 2 263 up-regulated 124 down-regulated 236 239 160 51 65 38 45
Fig. 3. Venn diagram of significantly differentially expressed genes in groups 1, 2 and 3, providing 0·1, 0·5 and 1 % of daily energy intake as DHA, respectively. Group 3 Group 1 5 6 8 1 – Urea cycle 1 0 3 Group 2 Group 3:
– Urea cycle intermediate metabolism – M phase
– Blood coagulation – Salivary gland development – Salivary gland morphogenesis – Haemostatis – Arginine metabolism – Mitosis Group 2: – Alcohol metabolism – Sterol biosynthesis – Steroid biosynthesis – Lipid biosynthesis – Sterol metabolism
– Fructose 2,6-biphosphate metabolism Group 1:
– Embryogenesis and morphogenesis – Ectoderm development
– Protein amino acid alkylation – JNK cascade
– TGF-β receptor signalling pathway – Lipid transport
– Steroid metabolism – Lipid metabolism
– Fructose metabolism
Fig. 4. Venn diagram depicting the top ten Gene Ontology (GO) classifications for biological processes and indicating the specificities and the commonalities (overlapping circles) between the three groups. JNK, c-Jun NH2-terminal kinase; TGF-b, transforming growth factor-b.
British
Journal
of
Nutrition
https://www.cambridge.org/core . IP address: 78.202.154.114 , on 26 May 2021 at 12:29:08, subject to the Cambridge Core terms of use, available at
https://www.cambridge.org/core/terms
.
levels of the TNF receptor TNF receptor superfamily, member 11b gene and the increased expression levels of ApoA2 and kallikrein B, plasma (Fletcher factor) 1 (KLKB1) genes are directly linked to the inflammatory response. Other genes significantly modulated in group 2 were associated with the
regulation of gene transcription such as v-fos FBJ murine osteosarcoma viral oncogene homologue and nuclear factor of kappa light polypeptide gene enhancer in B-cells inhibitor, a, a member of the IkB family, whose abundance was increased. In group 3, the expression levels of the gene coding for the major inflammatory protein C-reactive protein were substantially lowered and the transcription factor Jun oncogene was up-regulated.
Among the top ten pathways of groups 1, 2 and 3, other pathways were linked to inflammation such as ‘CCR5 sig-nalling in macrophages’, airway pathology in chronic obstruc-tive disease’, ‘calveolar-mediated endocytosis’, ‘lymphotoxin b-receptor signalling’, ‘thyroid cancer signalling’ and ‘comp-lement system’. They were mainly associated with group 2 and contain genes directly related to inflammation such as the chemokine ligands chemokine (C – X – C motif) ligand 3 (CXCL3) and chemokine (C – C motif) ligand 4 (CCL4), the interleukin IL-8, the integrins integrin, a D, integrin, a V (vitronectin receptor, a polypeptide, antigen CD51) and integ-rin, b 5, and the TNF-associated factor TNF receptor-associated factor 3. Moreover, the top first networks generated from the overall datasets of groups 1, 2 and 3 were all charac-terised by a common main central node: the NFkB complex, a major transcription factor involved in inflammation.
Effect of long long-chain n-3 PUFA on coagulation. The ‘coagulation system’ was the second common pathway between the three groups. The serine protease inhibitors SERPINA1 and SERPIND1, also found in the ‘acute-phase response signalling’ pathway, were the only genes in common between groups 1, 2 and 3. These serine protease inhibitors, together with serpin peptidase inhibitor, clade C (antithrombin), member 1 (FC ¼ 2 1·30 in group 3), are all involved in the inhibition of the F2A factor (thrombin). In group 2, the mRNA levels of two coagulation factors were significantly increased: the coagulation factor III, also known as the tissue factor, and KLKB1, also known as the Fletcher factor, both of which are involved in the initiation of coagulation. In group 3, these factors were unchanged but the subunit B of the coagulation factor XIII was significantly down-regulated (FC ¼ 2 1·55).
Effects of long long-chain n-3 PUFA on lipid metabolism. Among all the pathways significantly modulated by LC n-3 PUFA, three were directly in relation to the metabolism of lipids. These include ‘fatty acid metabolism’ (top 8 pathway for group 1), ‘arachidonic acid metabolism’ (top 3 pathway for group 2) and ‘FXR/retinoid X receptor activation’ (top 5 pathway for group 2). In the ‘fatty acid metabolism’ pathway, there were significant changes in several genes coding for the enzymes such as acetyl-CoA acetyltransferase 2, acyl-CoA oxidase 2, acyl-CoA synthetases such as acyl-CoA synthetase long-chain family member 3, and hydroxyacyl-CoA dehydro-genase. The ‘arachidonic acid metabolism’ pathway was mainly modulated in group 2. Basically, in group 2, there was an inhibition of the arachidonate metabolism via the reduced mRNA levels of unspecified mono-oxygenases (cytochrome P450, family 2, subfamily C, polypeptide 18 and cytochrome P450, family 4, subfamily B, polypeptide 1) and PG synthase PG E synthase 3 genes. LC n-3 PUFA-dose 2 also induced the expression of the detoxification
0·00 0·05 0·10 0·15 0·20 0·25 0·30 –0·2 0·3 0·8 1·3 1·8 2·3 2·8 3·3 3·8 (A) L og ( P-value) –0·2 0·3 0·8 1·3 1·8 2·3 2·8 3·3 3·8 (B) (C) L og ( P-value) –0·2 0·3 0·8 1·3 1·8 2·3 2·8 3·3 3·8 L og ( P-value) R atio 0·00 0·05 0·10 0·15 0·20 0·25 0·03 R atio 0·00 0·05 0·10 0·15 0·20 0·25 0·30 R atio Coagulation system LPS/IL
-1 mediated inhibition of RXR function Acute phase response signalling
Pentose phosphate pathw ays
FXR/RXR acti vation
Synthesis and degradation of k etones bodies Pyruvate metabolismFatty acid metabolism
Mitoc
hondrial dysfunction
CCR5 signalling in macrophages
Coagulation system Arac
hidonic acid metabolism Acute phase response signallingC21-steroid hormone metabolism
Airw ay pathology in c hronic obstructi ve Calveolar -mediated endocytosis
Urea cycle and metabolism of amino groups Lymphoto
xin b receptor signalling Glycolysis/gluconeogenesis
Complement system
Pyruvate metabolism Synaptic long term depression
Agrin interaction at neuromuscular junction Coagulation systemCeramide signalling
Thyroid cancer signalling Glycolysis/gluconeogenesis
Methionine metabolism CCR5 signalling in macrophages Acute phase response signalling
Fig. 5. Top ten canonical pathways significantly modulated in (A) group 1, (B) group 2 and (C) group 3. ‘Ratio’ indicates the number of molecules in a given pathway that meet cut-off criteria, divided by the total number of mol-ecules that make up that pathway. P value is calculated using the right-tailed Fisher’s exact test. LPS, lipopolysaccharide; RXR, retinoid X receptor; FXR, farnesol X receptor.
British
Journal
of
Nutrition
https://www.cambridge.org/core . IP address: 78.202.154.114 , on 26 May 2021 at 12:29:08, subject to the Cambridge Core terms of use, available at
https://www.cambridge.org/core/terms
.
Entrez gene ID
Control v. group
1 Control v. group 2 Control v. group 3
Gene symbol Gene description FC P FC P FC P
Acute-phase response signalling
A2M a2-Macroglobulin 2 21·44 0·027
AKT2 v-akt murine thymoma viral oncogene homologue 2 208 1·29 0·042
ApoA2 apoA-II 336 1·99 0·038
C9 Complement component 9 735 21·45 0·046 21·73 0·011
CRP (includes EG:1401) C-reactive protein, pentraxin-related 1401 22·31 0·026
FOS v-fos FBJ murine osteosarcoma viral oncogene homologue 2353 2·48 0·017
HPX Haemopexin 3263 21·6 0·015
HRG Histidine-rich glycoprotein 3273 1·41 0·041
JUN Jun oncogene 3725 1·35 0·020
KLKB1 Kallikrein B, plasma (Fletcher factor) 1 3818 1·68 0·004
KRAS v-Ki-ras2 Kirsten rat sarcoma viral oncogene homologue 3845 1·44 0·040 1·45 0·030
MAP2K4 Mitogen-activated protein kinase kinase 4 6416 21·23 0·040 21·24 0·028
MBL2 Mannose-binding lectin (protein C) 2, soluble (opsonic defect) 4153 21·51 0·038 21·45 0·036 NFKBIA Nuclear factor of kappa light polypeptide gene enhancer in B-cells
inhibitor, a
4792 1·35 0·020
NRAS Neuroblastoma RAS viral (v-ras) oncogene homologue 4893 1·20 0·020 1·34 0·001
SERPINA1 Serpin peptidase inhibitor, clade A (a1 antiproteinase, antitrypsin), member 1
5265 21·25 0·037 21·24 0·026 21·57 ,0·001
SERPIND1 Serpin peptidase inhibitor, clade D (heparin cofactor), member 1 3053 21·49 0·001 21·42 0·001 21·31 0·012 SERPINF1 Serpin peptidase inhibitor. clade F (a2 antiplasmin, pigment
epithelium-derived factor), member 1
5176 21·53 0·023
SERPINF2 Serpin peptidase inhibitor, clade F (a2 antiplasmin, pigment epithelium-derived factor), member 2
5345 21·24 0·039
SOCS5 Suppressor of cytokine signalling 5 9655 21·42 0·046
SOCS6 Suppressor of cytokine signalling 6 9306 1·12 0·029 1·14 0·007 1·26 ,0·001
TNFRSF11B TNF receptor superfamily, member 11b 4982 21·43 0·022
TTR Transthyretin 7276 21·34 0·019
Agrin interactions at neuromuscular junction
ACTB Actin, b 60 1·47 0·038
ACTC1 Actin, a, cardiac muscle 1 70 21·43 0·048
ERBB2 v-erb-b2 erythroblastic leukaemia viral oncogene homologue 2, neuro/glioblastoma-derived oncogene homologue (avian)
2064 1·24 0·005 1·15 0·023 1·26 0·021
JUN Jun oncogene 3725 1·35 0·020
KRAS v-Ki-ras2 Kirsten rat sarcoma viral oncogene homologue 3845 1·44 0·040 1·45 0·030
MAP2K4 Mitogen-activated protein kinase kinase 4 6416 21·23 0·040 21·24 0·028
NRAS Neuroblastoma RAS viral (v-ras) oncogene homologue 4893 1·20 0·020 1·34 ,0·001
Airway pathology in chronic obstructive pulmonary disease
CXCL3 Chemokine (C – X – C motif) ligand 3 2921 2·61 0·011
IL-8 3576 3·88 0·036
Arachidonic acid metabolism
ACSS2 Acyl-CoA synthetase short-chain family member 2 55902 1·46 0·022
CBR3 Carbonyl reductase 3 874 1·66 0·031
CYP2C18 Cytochrome P450, family 2, subfamily C, polypeptide 18 1562 21·69 0·005
CYP2C9 Cytochrome P450, family 2, subfamily C, polypeptide 9 1559 21·74 0·045
CYP4B1 Cytochrome P450, family 4, subfamily B, polypeptide 1 1580 22·25 0·018 22·04 0·048
CYP51A1 Cytochrome P450, family 51, subfamily A, polypeptide 1 1595 1·27 0·009
PUF A and hepatic gene expression 1263 Downloaded from https://www.cambridge.org/core . IP address: 78.202.154.114 , on 26 May 2021 at 12:29:08
, subject to the Cambridge Core terms of use, available at
https://www.cambridge.org/core/terms
.
Entrez gene ID
Control v. group 1
Control v. group 2 Control v. group 3
Gene symbol Gene description FC P FC P FC P
DHRS4 Dehydrogenase/reductase (SDR family) member 4 10901 21·57 0·028 21·58 0·023
GPX3 Glutathione peroxidase 3 (plasma) 2878 22·08 0·014
GPX4 Glutathione peroxidase 4 (phospholipid hydroperoxidase) 2879 1·36 0·035
GRN Granulin 2896 1·37 0·038
MGST3 Microsomal glutathione-S-transferase 3 4259 21·24 0·037
PLA2G4A Phospholipase A2, group IVA (cytosolic, calcium-dependent) 5321 21·22 0·009
PLOD1 Procollagen-lysine 1, 2-oxoglutarate 5-dioxygenase 1 5351 1·28 0·039
PNPLA3 Patatin-like phospholipase domain containing 3 80339 1·35 0·014 1·35 0·021
PTGES3 (includes EG:10728) Prostaglandin E synthase 3 (cytosolic) 10728 21·25 0·025
C21-steroid hormone metabolism
HSD11B1 Hydroxysteroid (11-b) dehydrogenase 1 3290 21·47 0·015 21·37 0·019
HSD17B2 Hydroxysteroid (17-b) dehydrogenase 2 3294 21·23 0·037
NSDHL NAD(P)-dependent steroid dehydrogenase-like 50814 1·35 0·007
Caveolar-mediated endocytosis
ACTB Actin, b 60 1·47 0·038
ACTC1 Actin, a, cardiac muscle 1 70 21·43 0·048
FLNC Filamin C, g (actin-binding protein 280) 2318 21·30 0·013
HLA-C MHC, class I, C 3107 1·86 0·037
ITGAD Integrin, a D 3681 1·80 0·039 1·69 0·033
ITGAV Integrin, a V (vitronectin receptor, a polypeptide, antigen CD51) 3685 2·27 0·004
ITGB5 Integrin, b 5 3693 1·89 0·026
PRKCA Protein kinase Ca 5578 21·22 0·006
CCR5 signalling in macrophages
CCL4 Chemokine (C – C motif) ligand 4 6351 1·73 0·024
CD247 CD247 molecule 919 21·21 0·041 21·29 0·009
CD3D CD3d molecule, delta (CD3 – TCR complex) 915 21·41 0·049
FOS v-fos FBJ murine osteosarcoma viral oncogene homologue 2353 2·48 0·017
GNAI1 Guanine nucleotide-binding protein (G protein), a-inhibiting activity polypeptide 1
2770 1·26 0·049
GNAI3 Guanine nucleotide-binding protein (G protein), a-inhibiting activity polypeptide 3
2773 1·30 0·006 1·31 0·006
Ceramide signalling
AKT2 v-akt murine thymoma viral oncogene homologue 2 208 1·29 0·042
FOS v-fos FBJ murine osteosarcoma viral oncogene homologue 2353 2·48 0·017
JUN Jun oncogene 3725 1·35 0·020
KRAS v-Ki-ras2 Kirsten rat sarcoma viral oncogene homologue 3845 1·44 0·040 1·45 0·030
MAP2K4 Mitogen-activated protein kinase kinase 4 6416 21·23 0·040 21·24 0·028
NRAS Neuroblastoma RAS viral (v-ras) oncogene homologue 4893 1·20 0·020 1·34 0·008
PPP2R2A Protein phosphatase 2 (formerly 2A), regulatory subunit B, a isoform 5520 1·32 0·012
PPP2R2B Protein phosphatase 2 (formerly 2A), regulatory subunit B, b isoform 5521 1·44 0·018
PPP2R3A (includes EG:5523) Protein phosphatase 2 (formerly 2A), regulatory subunit B00, a 5523 1·21 0·035 PPP2R5A Protein phosphatase 2, regulatory subunit B0, a isoform 5525 21·26 0·019 21·20 0·033
TNFRSF11B TNF receptor superfamily, member 11b 4982 21·43 0·022
Coagulation system
A2M a-2-Macroglobulin 2 21·44 0·027
F13B Coagulation factor XIII, B polypeptide 2165 21·55 0·007
F3 Coagulation factor III (thromboplastin, tissue factor) 2152 1·86 0·017
C. Gladine et al. Downloaded from https://www.cambridge.org/core . IP address: 78.202.154.114 , on 26 May 2021 at 12:29:08
, subject to the Cambridge Core terms of use, available at
https://www.cambridge.org/core/terms
.
Entrez gene ID
Control v. group 1
Control v. group 2 Control v. group 3
Gene symbol Gene description FC P FC P FC P
KLKB1 Kallikrein B, plasma (Fletcher factor) 1 3818 1·68 0·004
KNG1 (includes EG:3827) Kininogen 1 3827 21·23 0·017 21·44 0·008
SERPINA1 Serpin peptidase inhibitor, clade A (a-1 antiproteinase, antitrypsin), member 1
5265 21·25 0·037 21·24 0·026 21·57 ,0·001
SERPINC1 Serpin peptidase inhibitor, clade C (antithrombin), member 1 462 21·30 0·002
SERPIND1 Serpin peptidase inhibitor, clade D (heparin cofactor), member 1 3053 21·49 0·001 21·42 0·001 21·31 0·012 SERPINF2 Serpin peptidase inhibitor, clade F (a-2 antiplasmin, pigment
epithelium-derived factor), member 2
5345 21·24 0·039
Complement system
C1QA Complement component 1, q subcomponent, A chain 712 1·39 0·046
C3AR1 Complement component 3a receptor 1 719 21·25 0·017
C9 Complement component 9 735 21·45 0·046 21·73 0·011
MBL2 Mannose-binding lectin (protein C) 2, soluble (opsonic defect) 4153 21·51 0·038 21·45 0·036 Fatty acid metabolism
ACAT2 Acetyl-coenzyme A acetyltransferase 2 39 21·30 0·045 21·42 0·010
ACOX2 Acyl-coenzyme A oxidase 2, branched chain 8309 21·57 0·033
ACSL1 Acyl-CoA synthetase long-chain family member 1 2180 21·28 0·041
ACSL3 Acyl-CoA synthetase long-chain family member 3 2181 1·57 0·011 1·66 0·009
ACSL5 Acyl-CoA synthetase long-chain family member 5 51703 21·36 0·019
CYP2C18 Cytochrome P450, family 2, subfamily C, polypeptide 18 1562 21·69 0·005
CYP2C9 Cytochrome P450, family 2, subfamily C, polypeptide 9 1559 21·74 0·045
CYP4B1 Cytochrome P450, family 4, subfamily B, polypeptide 1 1580 22·25 0·018 22·04 0·048
CYP51A1 Cytochrome P450, family 51, subfamily A, polypeptide 1 1595 1·27 0·009
DHRS9 Dehydrogenase/reductase (SDR family) member 9 10170 21·77 0·002
HADH Hydroxyacyl-Coenzyme A dehydrogenase 3033 21·26 0·037
HADHB Hydroxyacyl-Coenzyme A dehydrogenase/3-ketoacyl-Coenzyme A thiolase/enoyl-Coenzyme A hydratase (trifunctional protein), b subunit
3032 21·28 0·019
FXR/RXR activation
ABCB4 ATP-binding cassette, sub-family B (MDR/TAP), member 4 5244 1·74 0·031
AKT2 v-akt murine thymoma viral oncogene homologue 2 208 1·29 0·042
CYP8B1 Cytochrome P450, family 8, subfamily B, polypeptide 1 1582 21·51 0·048
FBP1 Fructose-1,6-bisphosphatase 1 2203 21·44 0·016 21·37 0·003
MAP2K4 Mitogen-activated protein kinase kinase 4 6416 21·23 0·040 21·24 0·028
MTTP Microsomal TAG transfer protein 4547 21·52 0·033 21·40 0·046
SULT2A1 Sulfotransferase family, cytosolic, 2A, dehydroepiandrosterone-preferring, member 1
6822 21·52 0·001
UGT2B4 UDP glucuronosyltransferase 2 family, polypeptide B4 7363 1·41 0·046
VLDLR VLDL receptor 7436 1·65 0·008 1·61 0·006 2·93 ,0·001
Glycolysis/gluconeogenesis
ACSL1 Acyl-CoA synthetase long-chain family member 1 2180 21·28 0·041
ACSL3 Acyl-CoA synthetase long-chain family member 3 2181 1·57 0·011 1·66 0·009
ACSS2 Acyl-CoA synthetase short-chain family member 2 55902 1·46 0·022
ACYP2 Acylphosphatase 2, muscle type 98 1·20 0·036
ALDOA Aldolase A, fructose-bisphosphate 226 21·24 0·043
ALDOB Aldolase B, fructose-bisphosphate 229 21·51 0·035
ALDOC Aldolase C, fructose-bisphosphate 230 21·14 0·040 21·21 0·008
PUF A and hepatic gene expression 1265 Downloaded from https://www.cambridge.org/core . IP address: 78.202.154.114 , on 26 May 2021 at 12:29:08
, subject to the Cambridge Core terms of use, available at
https://www.cambridge.org/core/terms
.
Entrez gene ID
Control v. group 1
Control v. group 2 Control v. group 3
Gene symbol Gene description FC P FC P FC P
DHRS9 Dehydrogenase/reductase (SDR family) member 9 10170 21·77 0·002
DLAT Dihydrolipoamide S-acetyltransferase 1737 1·19 0·041 1·22 0·023 1·18 0·040
FBP1 Fructose-1,6-bisphosphatase 1 2203 21·44 0·002 21·37 0·003
FBP2 Fructose-1,6-bisphosphatase 2 8789 21·46 0·004 21·32 0·018
LDHB Lactate dehydrogenase B 3945 1·95 0·030
PGAM1 Phosphoglycerate mutase 1 (brain) 5223 21·25 0·032
RWDD2A RWD domain containing 2A 112611 1·22 0·031
LPS/IL-1-mediated inhibition of RXR function
ACOX2 Acyl-Coenzyme A oxidase 2, branched chain 8309 21·57 0·033
ACSL1 Acyl-CoA synthetase long-chain family member 1 2180 21·28 0·041
ACSL3 Acyl-CoA synthetase long-chain family member 3 2181 1·57 0·011 1·66 0·009
ACSL5 Acyl-CoA synthetase long-chain family member 5 51703 21·36 0·019
CAT Catalase 847 21·58 0·049
CYP2C9 Cytochrome P450, family 2, subfamily C, polypeptide 9 1559 21·74 0·045
GSTM5 Glutathione S-transferase mu 5 2949 21·50 0·043
HMGCS2 3-Hydroxy-3-methylglutaryl-Coenzyme A synthase 2 (mitochondrial) 3158 21·39 0·040
JUN Jun oncogene 3725 1·35 0·020
MAP2K4 Mitogen-activated protein kinase kinase 4 6416 21·23 0·040 21·24 0·028
MGST1 Microsomal glutathione S-transferase 1 4257 21·38 0·041
MGST3 Microsomal glutathione S-transferase 3 4259 21·24 0·039
SULT2A1 Sulfotransferase family, cytosolic, 2A, dehydroepiandrosterone-preferring, member 1
6822 21·52 0·001
Lymphotoxin-b receptor signalling
AKT2 v-akt murine thymoma viral oncogene homologue 2 208 1·29 0·042
CASP3 Caspase 3, apoptosis-related cysteine peptidase 836 1·67 0·020 1·69 0·007 1·61 0·023
NFKBIA Nuclear factor of kappa light polypeptide gene enhancer in B-cells inhibitor, a
4792 1·35 0·020
TRAF3 TNF receptor-associated factor 3 7187 1·21 0·023
Methionine metabolism
AGXT2L2 Alanine-glyoxylate aminotransferase 2-like 2 85007 21·20 0·046 21·24 0·011
AHCY S-Adenosylhomocysteine hydrolase 191 21·50 0·033 21·56 0·031
BHMT Betaine-homocysteine methyltransferase 635 21·94 0·010 21·73 0·014 22·02 0·006
CTH Cystathionase (cystathionine g-lyase) 1491 23·72 0·001
MAT2A Methionine adenosyltransferase II, a 4144 21·24 0·017
Mitochondrial dysfunction
AIFM1 Apoptosis-inducing factor, mitochondrion-associated, 1 9131 1·24 0·023
CASP3 Caspase 3, apoptosis-related cysteine peptidase 836 1·67 0·020 1·69 0·007 1·61 0·023
CAT Catalase 847 21·58 0·049
COX6C Cytochrome c oxidase subunit VIc 1345 1·15 0·039 1·24 0·023
COX7B2 (includes EG:170712) Cytochrome c oxidase subunit VIIb2 170712 21·29 0·046
GPX4 Glutathione peroxidase 4 (phospholipid hydroperoxidase) 2879 1·36 0·035
MAP2K4 Mitogen-activated protein kinase kinase 4 6416 21·23 0·040 21·24 0·028
NCSTN Nicastrin 23385 1·18 0·015 1·25 0·002
NDUFA4 NADH dehydrogenase (ubiquinone) 1 a subcomplex, 4, 9 kDa 4697 1·26 0·030 1·16 0·004
UQCRC1 Ubiquinol-cytochrome c reductase core protein I 7384 21·97 0·025 21·90 0·017
UQCRC2 Ubiquinol-cytochrome c reductase core protein II 7385 21·28 0·001 21·15 0·046
C. Gladine et al. Downloaded from https://www.cambridge.org/core . IP address: 78.202.154.114 , on 26 May 2021 at 12:29:08
, subject to the Cambridge Core terms of use, available at
https://www.cambridge.org/core/terms
.
Entrez gene ID
Control v. group 1
Control v. group 2 Control v. group 3
Gene symbol Gene description FC P FC P FC P
Pentose phosphate pathway
ALDOA Aldolase A, fructose-bisphosphate 226 21·24 0·043
ALDOB Aldolase B, fructose-bisphosphate 229 21·51 0·035
ALDOC Aldolase C, fructose-bisphosphate 230 21·14 0·040 21·21 0·008
FBP1 Fructose-1,6-bisphosphatase 1 2203 21·44 0·002 21·37 0·003
FBP2 Fructose-1,6-bisphosphatase 2 8789 21·46 0·004 21·32 0·018
Pyruvate metabolism
ACAT2 Acetyl-Coenzyme A acetyltransferase 2 39 21·30 0·049 21·42 0·010
ACOT12 Acyl-CoA thioesterase 12 134526 21·38 0·018
ACSL1 Acyl-CoA synthetase long-chain family member 1 2180 21·28 0·041
ACSL3 Acyl-CoA synthetase long-chain family member 3 2181 1·57 0·011 1·66 0·009
ACSS2 Acyl-CoA synthetase short-chain family member 2 55902 1·46 0·019
ACYP2 Acylphosphatase 2, muscle type 98 1·20 0·036
DLAT Dihydrolipoamide S-acetyltransferase 1737 1·19 0·041 1·22 0·023 1·18 0·040
GLO1 Glyoxalase I 2739 21·37 0·004 21·32 0·006
GRHPR Glyoxylate reductase/hydroxypyruvate reductase 9380 21·19 0·045 21·28 0·005
HADHB Hydroxyacyl-Coenzyme A dehydrogenase/3-ketoacyl-Coenzyme A thiolase/enoyl-Coenzyme A hydratase (trifunctional protein), b subunit
3032 21·28 0·019
LDHB Lactate dehydrogenase B 3945 1·95 0·030
MDH1 Malate dehydrogenase 1, NAD (soluble) 4190 21·21 0·014
RWDD2A RWD domain containing 2A 112611 1·22 0·031
Synaptic long-term depression
GNAI1 Guanine nucleotide-binding protein (G protein), a inhibiting activity polypeptide 1a
2770 1·26 0·049
GNAI3 Guanine nucleotide-binding protein (G protein), a inhibiting activity polypeptide 3
2773 1·31 0·006 1·31 0·006
GRN Granulin 2896 1·37 0·038
GUCY2C Guanylate cyclase 2C (heat-stable enterotoxin receptor) 2984 1·48 0·008 1·56 0·007
KRAS v-Ki-ras2 Kirsten rat sarcoma viral oncogene homologue 3845 1·44 0·040 1·45 0·030
NRAS Neuroblastoma RAS viral (v-ras) oncogene homologue 4893 1·20 0·020 1·34 ,0·001
PLA2G4A Phospholipase A2, group IVA (cytosolic, calcium-dependent) 5321 21·22 0·009
PNPLA3 Patatin-like phospholipase domain containing 3 80339 1·35 0·014 1·35 0·020
PPP2R2A Protein phosphatase 2 (formerly 2A), regulatory subunit B, a isoform 5520 1·32 0·012
PPP2R2B Protein phosphatase 2 (formerly 2A), regulatory subunit B, b isoform 5521 1·44 0·018
PPP2R3A (includes EG:5523) Protein phosphatase 2 (formerly 2A), regulatory subunit B00, a 5523 1·21 0·035
PPP2R5A Protein phosphatase 2, regulatory subunit B0, a isoform 5525 21·26 0·019 21·20 0·033
PRKCA Protein kinase C, a 5578 21·22 0·006
Synthesis and degradation of ketone bodies
ACAT2 Acetyl-Coenzyme A acetyltransferase 2 39 21·30 0·045 21·42 0·010
HADHB Hydroxyacyl-Coenzyme A dehydrogenase/3-ketoacyl-Coenzyme A thiolase/enoyl-Coenzyme A hydratase (trifunctional protein), bsubunit
3032 21·28 0·019
HMGCS2 3-Hydroxy-3-methylglutaryl-Coenzyme A synthase 2 (mitochondrial) 3158 21·39 0·040 Thyroid cancer signalling
BDNF Brain-derived neurotrophic factor 627 1·32 0·019 1·36 0·008
CCND1 Cyclin D1 595 21·59 0·047 PUF A and hepatic gene expression 1267 Downloaded from https://www.cambridge.org/core . IP address: 78.202.154.114 , on 26 May 2021 at 12:29:08
, subject to the Cambridge Core terms of use, available at
https://www.cambridge.org/core/terms
.
enzyme glutathione peroxidase 4 gene, which is involved in the metabolism of lipid peroxides. This increase in expression level was not associated with an increase in glutathione per-oxidase activity (Table 4). The ‘FXR/retinoid X receptor activation’ pathway was the main signalling pathway linked with lipid metabolism altered by LC n-3 PUFA. Among the genes whose abundance was significantly changed by LC n-3 PUFA, the microsomal TAG transfer protein (MTTP) and the lipoprotein receptor VLDLR are of interest because of their crucial role in lipoprotein metabolism. Their expression level was differently modulated with the three doses of LC n-3 PUFA. Indeed, MTTP mRNA level was decreased with doses 1 and 2 but not with dose 3. On the contrary, the abundance of the VLDLR gene was raised in a dose-dependent manner, leading to a FC of almost 3 in group 3.
Effects of long long-chain n-3 PUFA on energy metabolism. Several of the top ten pathways in groups 1, 2, and 3 were associated with energy metabolism. These include ‘synthesis and degradation of ketone bodies’ with the down-regulation of 3-hydroxy-3-methylglutaryl-CoA synthase, ‘pyruvate meta-bolism’ and ‘glycolysis/gluconeogenesis’.
Specific effects of LC n-3 PUFA-dose 3. As shown in Figs. 1
and 2, group 3 was associated with a significantly increased lipid peroxidation level. As peroxidised metabolites produced from LC n-3 PUFA are potential modulators of gene expression, we focused our analysis on genes that were specifically and substantially changed (i.e. FC . 1·5) in group 3 (Table 6). Among the thirty-four genes differentially expressed at a FC . 1·5 or , 2 1·5, ten genes had increased expression levels. Among them, two molecules were once again central in the metabolism of lipoprotein and cholesterol. These include the LDL-receptor (LDLR) that contributes to the uptake of circulating LDL and subsequently to hepatic meta-bolism of cholesterol. The abundance of the insulin-induced gene 1 was also increased in group 3. This gene encodes an endoplasmic reticulum membrane protein that plays a critical role in regulating cholesterol concentration in cells. Indeed, insulin-induced gene 1 binds to the sterol-sensing domains of sterol regulatory element-binding protein and 3-hydroxy-3-methylglutaryl-CoA reductase and is essential for the sterol-mediating trafficking of the two proteins. It is also inter-esting to note the increased abundance of the gene coding for ubiquitin-conjugating enzyme (ubiquitin-conjugating enzyme E2T) involved in the proteasome-dependent proteolysis. In group 3, twenty-four genes had decreased levels. These include a serine protease inhibitor (serpin peptidase inhibitor. clade F (a2 antiplasmin, pigment epithelium-derived factor), member 1) and the coagulation factor XIII genes already described. Other genes altered such as haemopexin, gluta-thione peroxidase 3 or the metallogluta-thioneins (metallogluta-thionein 3, Metallothionein 2A, Metallothionein 1X) are directly linked to oxidative stress.
Discussion
The biological effects of LC n-3 PUFA can be mediated in part by their actions at the gene expression level but the complex-ity of altered biological pathways and the nature of the
Table 5 . Continued Entrez gene ID Control v . group 1 Control v . group 2 Control v . g roup 3 Gene symbol Gene description FC P FC P FC P CXCL10 Chemokine (C – X – C motif) ligand 1 0 3627 2 ·46 0 ·026 KLK2 Kallikrein-related p eptidase 2 3817 2 3 ·05 , 0 ·001 2 2 ·52 0 ·017 KRAS v-Ki-ras2 Kirsten rat sarcoma viral o ncogene homologue 3845 1 ·44 0·040 1 ·45 0 ·030 NRAS Neuroblastoma RAS viral (v-ras) oncogene homologue 4893 1 ·20 0·020 1 ·34 , 0 ·001 RXRG Retinoid X receptor, g 6258 2 1·20 0·021 Urea cycle and metabolism of amino groups ARG2 Arginase, type II 384 2 1 ·23 0 ·041 2 1 ·31 0 ·019 ASS1 Argininosuccinate synthetase 1 445 2 1 ·27 0 ·033 CAT Catalase 847 2 1·58 0·049 CPS1 Carbamoyl-phosphate synthetase 1, mitochondrial 1373 2 1·42 0·027 2 1 ·65 0 ·003 GATM Glycine amidinotransferase ( L -arginine:glycine a midinotransferase) 2628 2 1 ·81 0 ·046 OAT Ornithine aminotransferase (gyrate atrophy) 4942 2 1 ·49 0 ·041 2 1 ·96 0 ·009 ID, iden tification; FC, fo ld change; SDR, short-chai n dehydroge nase/reductas e; TCR, T-cell recep tor; FXR, farnesol X rece ptor; RXR, re tinoid X rec eptor; MDR, multidrug re s istance; TAP, transp orter associated with antig en presen-tation; RWD, ring fi n ger a n d W D repeat domain; LPS, lipopolysacch aride.
British
Journal
of
Nutrition
https://www.cambridge.org/core . IP address: 78.202.154.114 , on 26 May 2021 at 12:29:08, subject to the Cambridge Core terms of use, available at
https://www.cambridge.org/core/terms
.