HAL Id: tel-03220153
https://tel.archives-ouvertes.fr/tel-03220153
Submitted on 7 May 2021HAL is a multi-disciplinary open access archive for the deposit and dissemination of sci-entific research documents, whether they are pub-lished or not. The documents may come from teaching and research institutions in France or abroad, or from public or private research centers.
L’archive ouverte pluridisciplinaire HAL, est destinée au dépôt et à la diffusion de documents scientifiques de niveau recherche, publiés ou non, émanant des établissements d’enseignement et de recherche français ou étrangers, des laboratoires publics ou privés.
Towards chemometric methodologies on hyperspectral
imaging for low dose compound detection : application
on Raman microscopy
Mathieu Boiret
To cite this version:
Mathieu Boiret. Towards chemometric methodologies on hyperspectral imaging for low dose compound detection : application on Raman microscopy. Analytical chemistry. Université Montpellier, 2015. English. �NNT : 2015MONTS291�. �tel-03220153�
Délivré par l’Université de Montpellier II
Préparée au sein de l’école doctorale Sciences des procédés
– Sciences des Aliments
Et de l’unité de recherche ITAP
Spécialité : Génie des procédés
Présentée par Mathieu Boiret
Soutenue le 10 décembre 2015 devant le jury composé de Mr. Jocelyn CHANUSSOT, Professeur, INP Grenoble Rapporteur Mr. Ludovic DUPONCHEL, Professeur, LASIR Lille Rapporteur Mr. Jean-Michel ROGER, ICPEF, IRSTEA Montpellier Directeur Mme Nathalie GORRETTA, IR, IRSTEA Montpellier Encadrante Mr. Serge RUDAZ, Professeur, Université de Genève Examinateur Mme Anna de JUAN, Professeur, Université de Barcelone Invitée Mr. Douglas RUTLEDGE, Professeur, AgroParisTech, Paris Invité Mr. Yves-Michel GINOT, Technologie SERVIER, Orléans Invité
TOWARDS CHEMOMETRIC METHODOLOGIES ON
HYPERSPECTRAL IMAGING FOR LOW DOSE
COMPOUND DETECTION:
« He who knows all the answers
has not been asked all the questions »
Remerciements
Ces travaux ont été financés par une convention de recherche entre l’Institut National de Recherche en Sciences et Technologies pour l’Environnement et l’Agriculture (IRSTEA) et Technologie SERVIER.
Je suis très reconnaissant envers ma hiérarchie, qui m’a donné la chance de vivre cette aventure très enrichissante en parallèle de mes activités au sein de Technologie SERVIER. Ainsi, j’adresse mes remerciements les plus sincères à Patrick Genissel, Directeur de la recherche et biopharmacie (SERVIER), Patrick Wuthrich, Directeur du pôle d’expertise de développement pharmaceutique (SERVIER) et Yves-Michel Ginot, Directeur de la division analytique sur le centre de développement pharmaceutique (SERVIER), pour la confiance qu’ils ont su me donner afin que je puisse relever ce défi.
La direction de cette thèse a été assurée par Jean-Michel Roger, coencadrée par Nathalie Gorretta. Je les remercie tous les deux pour leur pédagogie, leur confiance et pour tous ces moments partagés. Je vous suis très reconnaissant de ces trois années passées à vos côtés.
Je tiens à remercier Ludovic Duponchel et Jocelyn Chanussot d’avoir accepté d’être les relecteurs et évaluateurs de ce manuscrit. Merci également à Serge Rudaz, d’avoir accepté d’intégrer mon jury de thèse. Je remercie très sincèrement Anna de Juan et Douglas Rutledge, membres de mon comité de thèse et invités du jury. Nos collaborations durant ces 3 années ont été pour moi très enrichissantes. Vos remarques et conseils ont été de vraies valeurs ajoutées pour assurer la qualité des travaux et articles. Merci infiniment pour votre temps et votre disponibilité.
Ce travail a été réalisé au sein du département Spectroscopie et Chimiométrie, sur le site SERVIER de développement pharmaceutique d’Orléans. J’ai une pensée pour les membres de cette équipe dynamique (Sylvie, Marc, Frank et Yoann) que j’ai la chance de côtoyer au quotidien et qui a su s’adapter à mes disponibilités parfois limitées. Je ne peux m’empêcher d’avoir une pensée toute particulière pour Loïc Meunier, avec qui l’aventure de ce département a commencé.
J’ai bien évidemment une pensée pour mes parents, qui sont de parfaits exemples de force et de courage face à toutes épreuves, ainsi que pour mes frères à qui j’expliquerai bien volontiers le
fond de ces travaux le moment venu. Il est certain que sans eux, rien de tout cela n’aurait été possible.
Enfin un grand merci à Lesly, qui a su me soutenir et me conseiller dans de nombreuses situations. Merci pour ta patience, ton soutien, pour ce que tu m’apportes depuis le début et pour ce que tu vas m’apporter dans quelques semaines !
Publications and communications
Papers in international peer-reviewed journals
Following articles directly result from this thesis and are referenced in the manuscript as:
Art. I Boiret, M., Rutledge, D. N., Gorretta, N., Ginot Y.M., Roger, J.M. (2014). Application of independent component analysis on Raman images of a pharmaceutical drug product: Pure spectra determination and spatial distribution of constituents. Journal of Pharmaceutical and Biomedical Analysis, Vol. 90, 78-84. DOI: 10.1016/j.jpba.2013.11.025
Art. II Boiret, M., de Juan, A., Gorretta, N., Ginot Y.M., Roger, J.M. (2015). Distribution of a low dose compound within pharmaceutical tablet by using multivariate curve resolution on Raman hyperspectral images. Journal of Pharmaceutical and Biomedical Analysis, Vol. 103, 35-43. DOI: 10.1016/j.jpba.2014.10.024
Art. III Boiret, M., de Juan, A., Gorretta, N., Ginot Y.M., Roger, J.M. (2015). Setting local rank constraints by orthogonal projections for image resolution analysis: application to the determination of a low dose compound. Analytica Chimica Acta, vol. 892, 49-58. DOI: 10.1016/j.aca.2015.08.031
Art. IV Boiret, M., Gorretta, N., Ginot Y.M., Roger, J.M. (2015). An iterative approach for compound detection in an unknown pharmaceutical drug product: Application on Raman microscopy. Submitted in Journal of Pharmaceutical and Biomedical Analysis
Other articles:
Art. V Boiret, M., Rutledge, D. N., Gorretta, N., Ginot Y.M., Roger, J.M. (2014). Raman microscopy and Chemometric tools for counterfeit detection of pharmaceutical tablets. Spectra Analyse, Vol. 298, 74-80.
Oral communications
Boiret, M., Rutledge, D. N., Gorretta, N., Ginot Y.M., Roger, J.M., Applications of Raman hyperspectral imaging in the pharmaceutical field. Invited speaker in “Chimiométrie 2013”, 2013, Brest, France.
Boiret, M., Imagerie chimique par spectroscopies Raman et proche infrarouge : Applications pour l’industrie pharmaceutique, in “4ème journée de l’expertise chimique à
Lyon”, 2015, Lyon, France.
Boiret, M., Rutledge, D. N., de Juan, A., Gorretta, N., Roger, J.M., Use of Chemometric tools on Raman hyperspectral images for low dose constituent distribution in tablets, in “EuroAnalysis”, 2015, Bordeaux, France.
Content
Remerciements ... iii
Publications and communications ... v
Content ... vii
List of figures ... xiii
List of tables ... xvii
Abbreviations and notations ... xviii
Chapter I: General introduction ... 1
1. Introduction ... 2
2. Outline of the thesis ... 3
Chapter II: The use of Raman spectroscopy in the pharmaceutical environment: theory and applications ... 5
1. Raman spectroscopy... 6
1.1. Theoretical aspects ... 6
1.2. Raman chemical imaging ... 9
1.3. Applications in the pharmaceutical environment ... 10
2.1. Data pre-processing ... 12
2.1.1. Spike correction ... 12
2.1.2. Baseline correction ... 13
2.1.3. Normalisation ... 14
2.1.4. Derivatives ... 15
2.2. Multivariate data analysis ... 16
2.2.1. Principal component analysis ... 16
2.2.2. Independent component analysis ... 17
2.2.3. Multivariate curve resolution-Alternating least squares ... 18
3. Identification of a low dose compound ... 19
3.1. Definition of a low dose compound ... 19
3.2. The sampling aspect ... 20
3.3. Data analysis aspect ... 22
3.4. Contributions of the thesis ... 23
Chapter III: Use of blind source separation approach for pure spectra determination and spatial distribution of constituents ... 25
1. Introduction ... 28
2. Materials and methods ... 30
2.1. Samples ... 30
2.2. Raman imaging system ... 30
2.3. Pre-processing ... 30
2.4. Independent Component Analysis (ICA) ... 31
3. Results & discussion ... 32
3.1. Selection of number of independent components ... 32
3.2. Distribution of API ... 33
4. Conclusions ... 42
Chapter IV: Use of multivariate curve resolution for identification of a low dose compound ... 48
1. Introduction ... 51
2. Materials and Methods ... 53
2.1. Samples ... 53
2.2. Raman imaging system ... 53
2.3. Pre-processing ... 54
2.4. Multivariate Curve Resolution-Alternating Least Squares (MCR-ALS) ... 54
3. Results and discussion ... 56
3.1. Exploratory analysis ... 56
3.2. MCR-ALS ... 59
3.2.1. Non-negativity and local rank constraints ... 59
3.2.2. Effect of PCA filtering on MCR-ALS results ... 62
3.2.3. Pure spectrum augmented matrix ... 66
Chapter V: An alternative method for presence/absence maps determination by
orthogonal projections ... 72
1. Introduction ... 75
2. Theory ... 77
2.1. Notations ... 77
2.2. Pretreatment using orthogonal projections ... 77
2.3. Multivariate curve resolution-alternating least squares (MCR-ALS) ... 78
2.4. Proposed approach to determine presence/absence maps of compounds to set local rank constraints ... 79
3. Materials and methods ... 82
3.1. Raman microscopy ... 82
3.2. Samples ... 82
3.2.1. Simulated data ... 82
3.2.2. Real dataset ... 85
4. Results and discussion ... 85
4.1. Principal component analysis (PCA) on pure images ... 85
4.2. Proposed approach on simulated data ... 86
4.3. Proposed approach on real dataset ... 90
5. Conclusions ... 93
Chapter VI: An iterative approach for compound detection in an unknown formulation . 95 1. Introduction ... 97
2.2. Samples ... 100
2.3. Raman imaging system ... 100
2.4. Spectral library ... 100
2.5. Proposed approach ... 101
2.5.1. Spectral distances ... 102
2.5.2. Identification of the pure compound ... 103
2.5.3. Orthogonal projection ... 104
2.5.4. Overview of the iterative approach ... 105
3. Results and discussion ... 106
3.1. Identification of the tablet compounds ... 106
3.2. Multivariate curve resolution-alternating least squares ... 114
4. Conclusions ... 116
Chapter VII: Conclusions and future work ... 118
1. Introduction ... 119
2. Main contributions ... 119
2.1. A flashback to the beginning of this work ... 119
2.2. Applications of a blind source separation methodology ... 121
2.3. Applications of multivariate curve resolution ... 122
2.4. Alternative method for presence/absence map estimations ... 123
2.5. Compound detection in an unknown formulation ... 123
General conclusion ... 127
Résumé en français ... a
1. Contexte et objectifs ... a 2. Matériel et méthodes ... d 2.1. Instrumentation et échantillons ... d
2.2. Analyse des données ... d
3. Contributions ... e 4. Résultats ... f 4.1. Utilisation de la séparation de source aveugle pour la détermination de spectres purs et l’étude de la distribution spatiale des composés ... f
4.2. Utilisation de résolution multivariée de courbes pour l’identification d’un constituant faiblement dosé ... h
4.3. Proposition d’une méthode pour la mise au point des cartographies
d’absence/présence de composés ... k
4.4. Approche itérative pour la détection des composés d’une formulation inconnue ... m
List of figures
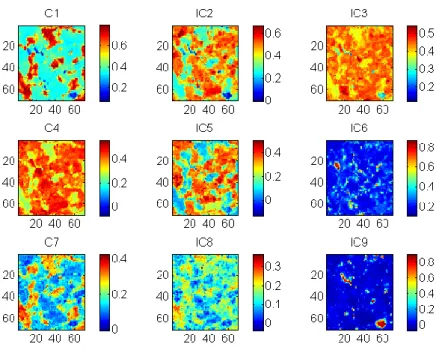
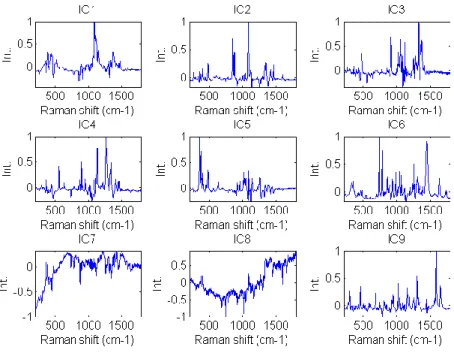
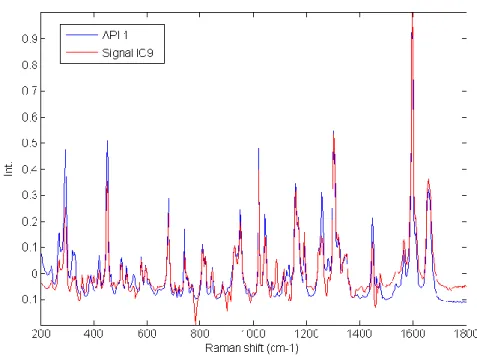
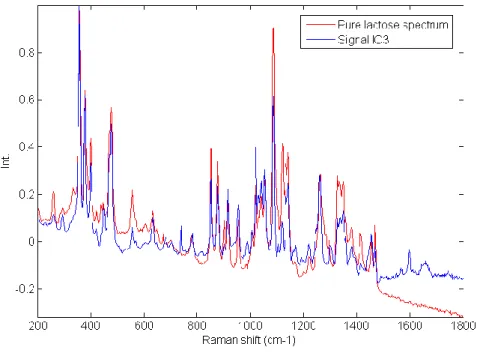
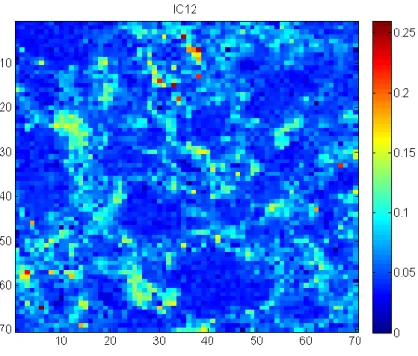
Figure II-1 Description of the Raman scattering ... 8 Figure II-2 Generation of hyperspectral data cube ... 9 Figure II-3 Application of spike correction on a lactose spectrum ... 13 Figure II-4 Application of baseline correction using Asymmetric Least Squares on 25 spectra of microcrystalline cellulose ... 14 Figure II-5 Application of SNV correction on 25 spectra of Amlodipine... 15 Figure II-6 Example of derivative correction on 25 spectra of aspartame ... 16 Figure II-7 – Probability of finding at least one spectrum of a 0.5% w/w low dose compound .... 21 Figure III-1 Graphical representation of the tested approach ... 26 Figure III-2 Lowest correlation between signals obtained using ICA_by_blocks. The lowest correlation obtained using the ICA_by_blocks approach significantly decreases after 9 ICs, which was considered as the optimal number of component for the decomposition of the dataset ... 33 Figure III-3 Proportions coefficients (A) of each IC. Images correspond to the proportions coefficients (A) of a 9 ICs model. A red color corresponds to a high value whereas a blue color corresponds to a low value. ... 34 Figure III-4 Signals, S, of the ICA model. These signals correspond to the calculated signals (S) of a 9 ICs model. ... 35 Figure III-5 Pure spectra of the drug product constituents. In blue API 1, in green API 2, in black lactose, in red avicel and in magenta the magnesium stearate. Relative intensities were used as the spectra were split for a better observation. ... 36 Figure III-6 Calculated signal of independent component 9 superposed on the spectrum of API 1. Comparison between API 1 spectrum and IC9 signal. The correlation between the two signals is equal to 0.92. ... 37
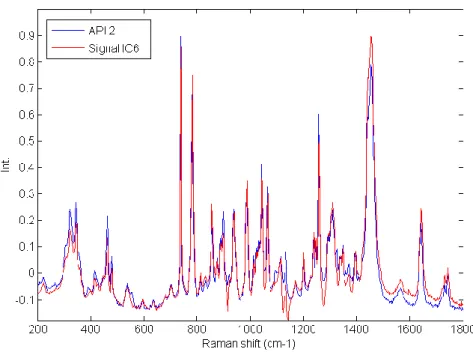
Figure III-7 Calculated signal of independent component 6 superposed on the spectrum of API 2. Comparison between API 2 spectrum and IC6 signal. The correlation between the two signals is equal to 0.96. ... 38 Figure III-8 Calculated signal of independent component 2, 3, 4, 5 plotted with the spectrum of Lactose. Comparison between lactose spectrum and IC2, IC3, IC4 and IC5 signals. The correlations between the signals are respectively equal to 0.44, 0.23, 0.25 and 0.47. The pure spectrum of lactose and the four calculated independent components are displayed. The pure spectrum was decomposed into four components. ... 39 Figure III-9 IC3 signal from a 5 components ICA model superposed on the spectrum of lactose. Comparison between lactose spectrum and IC3 signal from a 5 components ICA model. The correlation between the two signals is equal to 0.90. ... 40 Figure III-10 IC12 superposed on the magnesium stearate spectrum from a 15 component ICA model. Comparison between magnesium stearate spectrum and IC12 signal from a 15 components ICA model. The correlation between the two signals is equal to 0.87. ... 41 Figure III-11 Distribution of IC12 (magnesium stearate) from a 15 component ICA model. This component is highly correlated to magnesium stearate. ... 42 Figure III-12 Article V: Application of independent component analysis on counterfeit samples47 Figure IV-1 General scheme of the tested approaches in Chapter IV ... 50 Figure IV-2 Preprocessed Raman spectra (AsLS and first derivative) ... 57 Figure IV-3 PCA scores: five first components associated with their explained variances. Different distributions and agglomerates were highlighted. PC1 and PC5 were linked to the lactose variability, while PC2, PC3 and PC4 were respectively linked to the distributions of API1, avicel and API2. ... 58 Figure IV-4 Singular values plot (top: non-sorted singular values, bottom: sorted singular values) ... 60 Figure IV-5 Local rank map obtained by choosing an appropriate threshold which separates significant singular values from noise. ... 61 Figure IV-6 Csel matrix (Orange: absence of the constituent, White: presence of the constituent)
Figure IV-7 Highest correlation between the calculated spectra (Sopt) and the reference spectrum
of magnesium stearate (for each iteration of a PCA filtered matrix built from 5 to 100 components) ... 63 Figure IV-8 Distribution maps of drug substance constituents (PCA non-filtered dataset) ... 65 Figure IV-9 Sopt versus reference spectrum of magnesium stearate ... 65
Figure IV-10 Distribution maps of drug substance constituents (augmented matrix approach) . 67 Figure V-1 Graphical representation of the proposed approach ... 81 Figure V-2 Image distribution patterns used to build synthetic image (eight classes represented by eight different colours) ... 83 Figure V-3 Simulated distribution maps of lactose, avicel®, API and magnesium stearate (MgSt) ... 84 Figure V-4 Building of simulated data ... 85 Figure V-5 Non-centered PCA on pure compound image of API. Raw spectra, scores maps and loadings ... 86 Figure V-6 Orthogonal projected spectra of the simulated data to the suitable interference space
for each compound ... 87
Figure V-7 Correlation maps (k1 = lactose basis, k2 = avicel basis, k3 = API basis, k4 = MgSt basis) ... 88 Figure V-8 Presence/Absence maps of compounds in the simulated image (blue colour: Presence of the compound, white colour: absence of the compound) ... 89 Figure V-9 Presence/absence maps of drug compounds (blue colour: Presence of the compound, white colour: absence of the compound) ... 90 Figure V-10 Calculated spectrum by MCR-ALS (with n-n and local rank constraints) and pure spectrum of magnesium stearate ... 91 Figure V-11 Distribution maps of the five compounds obtained by MCR-ALS (with n-n and local rank constraints) ... 92 Figure VI-1 – Description of α angle in the spectral angle mapper (SAM) calculation ... 103 Figure VI-2 – Boxplot representation of SAM ... 104
Figure VI-3 – Description of the proposed approach ... 106 Figure VI-4 – Raw spectra of the image of dimensions 30 pixels per 30 pixels (900 spectra) .... 107 Figure VI-5 – Mean spectra of the 24 pure products included in the spectral library ... 108 Figure VI-6 – SAM values boxplot and values calculated from iteration 1 to 8 (to identify each sample number, readers are refered to Table VI-1) ... 110 Figure VI-7 – SAM values between pure projected spectrum of magnesium stearate and the matrix (iteration 7) ... 111 Figure VI-8 – Projected spectrum at positions y = 23 and x = 4 and the projected mean spectrum ... 112 Figure VI-9 – Evolution of standard deviation of the 24 values ... 113 Figure VI-10 – Distribution maps of metolose, API form 1, eudragit, microcrystalline cellulose, API form 2, magnesium stearate and maltodextrin ... 115
List of tables
Table II-1 Spatial and spectral contributions of a compound ... 19
Table III-1 Correlation coefficients between the ICA signals and the pre-processed true compound spectra. The comparison between the calculated signals and the true spectrum of each compound shows that only two ICs are directly linked to the drug product constituents. For each component, the highest correlation was highlighted with bold characters. ... 36
Table IV-1 Correlations between MCR-ALS calculated Sopt and the reference spectra (PCA filtered dataset) ... 62
Table IV-2 MCR-ALS results according to the number of components used to build the PCA reduced matrix ... 64
Table IV-3 Correlations between MCR-ALS Sopt and the reference spectra (column-wise augmented dataset) ... 67
Table V-1 Target concentrations of the eight classes ... 83
Table V-2 MCR-ALS results on simulated data ... 89
Table V-3 MCR-ALS results on real dataset ... 92
Table VI-1 – Spectral library ... 101
Abbreviations and notations
Abbreviations
API Active Pharmaceutical Ingredient
AsLS Asymmetric Least Squares
BSS Blind Source Separation
CLS Classical Least Squares
ICA Independent Component Analysis
IR Infrared
JADE Joint Approximate Diagonalization of Eigenmatrices
lof Lack of fit
MCR Multivariate Curve Resolution
MCR-ALS Multivariate Curve Resolution-Alternating Least Squares
NAS Net Analyte Signal
NIR Near infrared
OPA Orthogonal Projection Approach
PCA Principal Component Analysis
PCR Principal Component Regression
PLS Partial Least Squares
PLS-DA Partial Least Squares-Discriminant Analysis
QC Quality Control
R2 Explained variance
Notations
x Vectors in bold lowercase
X Matrix in bold uppercase
̅ Mean vector of X
n Scalar in italic lowercase
XT and xT Transpose form of a matrix X and a vector x
Spectral basis, vector subspace
Euclidian projector to a spectral basis K
and X and x orthogonally projected to K
I Identity matrix of dimensions p x p (p variables)
̅ Raman shift in cm-1
λ Wavelength
h Planck constant
λincident Wavelength of the incident photons
λscattered Wavelength of the scattered photons
Nn Number of molecules in the excited state
Nm Number of molecules in the ground state
k Boltzmann constant
T Temperature
ΔE Energy differences between the vibrational energy stated
gn Degeneracies of the excited state
gm Degeneracies of the ground state
Vari Theoretical spectral variance of a compound i
Csel Absence/presence matrix
N-dimensional space in which variables can be represented as vectors P-dimensional space in which observations can be represented as vectors
Chapter I: General introduction
1. Introduction ... 2 2. Outline of the thesis ... 3
1. Introduction
In the pharmaceutical environment, and especially in the research and development field, the quality of the medicine is a critical step as it is facing challenges with increased demand from the regulatory affairs to improve the quality of a pharmaceutical drug product. In order to ensure its proper effect on the patient health, a product has to be manufactured with the appropriate quality [1-3].
Today, a lot of techniques are used in quality control (QC) laboratories to ensure the quality of a drug product. Several tests such as dissolution profiles, stability studies or control of active content are required from the pharmaceutical guidelines and authorities to ensure that the analysed product is included within pre-determined specifications. In the QC labs, most of the analytical tools are based on chemical analyses (liquid chromatography, dissolution apparatus…) which generally damage the sample, require solvent and a lot of time or important human resources.
In the last decade, the use of vibrational spectroscopy such as near infrared or Raman spectroscopy has grown quickly and has appeared as an alternative analytical tool to usual techniques [4; 5]. By allowing fast and non-destructive analysis, without needing sample preparations in most cases, these analytical tools are particularly appreciated by the analysts. New available guidelines from European Pharmacopeia [6] or European Medicine Agency (EMA) [7] have strongly encouraged the use of these alternative techniques in the QC laboratories. The main objective is to continuously improve the knowledge of a pharmaceutical drug product to produce a medicine with high and consistent quality [8].
Due to the complexity of the acquired spectra or because univariate observation of the data can be inadequate, multivariate data analysis and chemometrics are often needed to extract useful information from spectroscopic measurements [9]. Several applications have been previously published in the pharmaceutical environment. Qualitative analysis such as raw material identification [10] or counterfeit detection [11], have been carried out and have particularly been appreciated in the pharmaceutical field. Quantitative methods such as content uniformity, quantification of a crystalline form during stability studies, have been developed in order to replace usual chemical approaches [12].
Apparition of chemical imaging, which gives both spectral and spatial information on the studied sample by associating two spatial dimensions (x and y dimensions) and one spectral dimension (each pixel spectrum) provides a new way of exploring a sample, i.e. a pharmaceutical drug
product [13; 14]. Indeed, by adding the spatial information, it is now possible to study the distribution of actives and excipients within a tablet or a powder sample. In the case of Raman microscopy, hyperspectral imaging (also called chemical imaging) is the association of a microscope and a Raman spectrometer. Because of the huge amount of data contained in hyperspectral images, a direct interpretation of the acquired images is not possible. Therefore, several chemometric tools have previously been applied for qualitative or quantitative analysis of hyperspectral dataset [15]. Some methods are mainly based on variance decomposition, while other methods require a calibration step or prior knowledge to develop predictive models. In most pharmaceutical cases, Raman microscopy coupled with chemometrics was used to study the compound distributions in a sample. Indeed, the study of active and excipient distributions can be viewed as a critical parameter significantly influencing the quality of the tablet. A non-controlled distribution can have an impact on the tablet dissolution profile or can facilitate the apparition of degradation products which may be one of the reasons of a troubleshooting alert throughout the manufacturing process.
In the framework of compound distributions, the study of a low dose compound, which can be viewed as a product located in a few pixels of an image and with a low spectral contribution comparing with other products, appeared as a real challenge. Indeed, because information linked to this product is weak and because chemometric algorithms are mainly based on the decomposition of statistical moments, detection of a low dose product could be difficult.
The main objective of this thesis will be to study the ability of different chemometric tools and methods:
i/ to study the compound distributions within a pharmaceutical drug product ii/ to identify a low dose compound in a pharmaceutical drug product
To reach these objectives, different chemometric tools will be tested, with or without prior knowledge on the formulation, and innovative methodologies will be proposed, developed and applied on simulated and real case Raman hyperspectral datasets.
2. Outline of the thesis
The thesis consists of an introductory part (chapter I), followed by a state of the art section (chapter II) on the use of Raman spectroscopy in the pharmaceutical environment. In these two
with the help of several applications in the pharmaceutical environment. Brief introduction of the Raman effect, spectral interpretation and data analysis will be described based on a review of Raman applications in the pharmaceutical field. Moreover, the main objective of this thesis, which can be resumed as the detection of a low dose compound within a pharmaceutical drug product, will be detailed and explained.
In the following sections, each chapter of the thesis refers to a scientific publication (published or submitted), forming the spine of this manuscript. The author would like to apologize for any potential redundancies between the different chapters, especially in the materials and methods sections, due to the chosen format of the thesis, based on articles.
Chapter III discusses the ability of a blind source separation method, independent component analysis, to extract pure compound signals in hyperspectral dataset without prior knowledge. This chapter is the reproduction of Art. I published in the Journal of Pharmaceutical and Biomedical Analysis in 2014.
Chapter IV details the use of multivariate curve resolution-alternating least squares to resolve a system including a low dose compound. Different approaches will be tested and discussed in this section. This chapter is the reproduction of Art. II published in the Journal of Pharmaceutical and Biomedical Analysis in 2015.
In Chapter V, an innovative procedure to set the presence/absence maps of compounds for later use as local rank constraints in the multivariate curve resolution-alternating least squares iterative process is proposed. The algorithm is based on orthogonal projection to a space containing the contributions to be removed (i.e. the interference subspace) and spectral comparison between the projected spectrum and a pure projected spectrum of the compound of interest. This chapter is the reproduction of Art. III published in Analytica Chimica Acta in 2015.
In chapter VI, an iterative approach is proposed to identify the pure compounds of a unknown pharmaceutical drug product by using a spectral library, spectral distances and orthogonal projections. This chapter is the reproduction of Art. IV submitted in the Journal of Pharmaceutical and Biomedical Analysis in 2015.
Finally, the last chapter of this thesis (chapter VII) concludes by synthesizing the key points of the tested and developed approaches. It proposes some perspectives and future research applications to continue this work.
Chapter II: The use of Raman spectroscopy
in the pharmaceutical environment: theory
and applications
1. Raman spectroscopy... 6 1.1. Theoretical aspects ... 6
1.2. Raman chemical imaging ... 9
1.3. Applications in the pharmaceutical environment ... 10
2. Chemometric tools ... 10 2.1. Data pre-processing ... 12 2.1.1. Spike correction ... 12 2.1.2. Baseline correction ... 13 2.1.3. Normalisation ... 14 2.1.4. Derivatives ... 15 2.2. Multivariate data analysis ... 16
2.2.1. Principal component analysis ... 16 2.2.2. Independent component analysis ... 17 2.2.3. Multivariate curve resolution-Alternating least squares ... 18 3. Identification of a low dose compound ... 19 3.1. Definition of a low dose compound ... 19
3.2. The sampling aspect ... 20
3.3. Data analysis aspect ... 22
1. Raman spectroscopy
1.1. Theoretical aspects
The objective of this chapter is to provide a brief introduction to Raman spectroscopy for people that are not familiar with this technology. For more details, readers are referred to the literature [16-18].
Raman spectroscopy can be considered as a vibrational spectroscopy. When an electromagnetic wave interacts with electrical and magnetic fields of atoms or molecules, different phenomena are observed depending on the energy of said wave. Optical spectroscopies constitute the body of methods that measure these light/matter interaction phenomena and thus use light for the study of molecular processes. Vibrational spectroscopies are optical spectroscopy techniques based on transitions between vibrational levels of the same electronic state. It measures the interaction of the incident electromagnetic radiation with the specific molecular vibrations of the sample. From spectrum, it is thus possible to deduce information on the nature and structure of a molecule, in either free or bonded form, as well as its interaction with its environment [19; 20].
Raman spectroscopy uses a monochromatic light source (typically a laser). When light (of frequency ) interacts with matter, incident photons are mainly transmitted and absorbed by the sample molecules. However, a slight part of the incident light is also scattered. In that case, most of the photons (1 photon / 104 photons) are elastically scattered, meaning that they have
the same energy of the incident light. This phenomenon is called the Rayleigh scattering effect. Occasionally (1 photon / 108 photons), a photon can be “inelastically” scattered, meaning that it
has a frequency different that the frequencies of the incident light. This phenomenon corresponds to the Raman effect (Figure II-1). If the frequency of the scattered light is lower than the frequency of the incident light, then the Stokes Raman effect is measured . However, if the frequency of the scattered light is higher than the frequency of the incident light, then the anti-Stokes effect is measured . The Raman effect is weak
comparing with the Rayleigh effect. In experimental applications, the Raman Stokes scattering is mainly measured as its intensity is higher than the anti-Stokes effect [21; 22]. Indeed, because the majority of molecules are in the ground energy state at room temperature, and not in an excited state as required for generating anti-Stokes scattering, the Stokes scattering is mainly observed. This observation can be explained by the Boltzmann distribution which describes the relationship between temperature and the fraction of molecules in an excited state [23]:
(II-1)
where and are the number of molecules in the excited and ground energy states, and the degeneracies of the excited and ground vibrational states, k the Boltzmann constant, T the temperature in Kelvin and the energy differences between the vibrational energy states. If the temperature increases, the number of molecules in the excited state increases and the anti-Stokes intensity changes accordingly. In theory, anti-Stokes and anti-anti-Stokes measurements contains the same frequency information, with different intensity levels.
A Raman spectrum represents the intensity of Stokes or anti-Stokes lines as a function of wavenumber and not frequency. The x-axis is generally labelled the Raman shift ( ̅) and measured in wavenumber (cm-1). It can be calculated using the following equation:
̅ (
) (II-2)
Where and are the wavelengths of the incident and the Raman scattered photons [24]. The Raman shift is then independent of the incident light frequency (the characteristic bands on a Raman spectrum will be the same whatever the wavelength of the laser). The positions of the Raman shifted wavenumbers for a given vibrational mode are identical to the wavenumbers of the corresponding bands in an infrared absorption spectrum. However, the stronger peaks in a Raman spectrum are often weak in an infrared spectrum, and vice versa. Comparing with other analytical tools, Raman spectroscopy is advantageous because quick and accurate measurements can often be made without destructing the sample and with minimal or no sample preparation.
Figure II-1 Description of the Raman scattering
A lot of Raman instrumentations are available on the market and the objective of this chapter is not to provide an exhaustive review of the Raman technologies. However, Raman apparatus can be briefly described as a system constituted of a monochromatic light source, a filter to remove the Rayleigh scatter, a spectrograph to separate the Raman scattered light by wavelength, a detector, and a computer to visualize the data [25]. Different light sources (lasers) are available. The choice of excitation wavelength is a compromise: the higher the energy of the wave, the more intense scattering but also the greater risk of inducing parasitic fluorescence. In the pharmaceutical environment, to study tablet or power, a 785nm laser is often a judicious choice.
1.2. Raman chemical imaging
Hyperspectral Raman images can be acquired by using two different modes: Raman mapping or Raman imaging. In the first case, the spectrum of the sample is dispersed across the detector, and the sample is moved when each spectrum has been measured. In the second case, the image of the sample at a single wavelength is focused on the detector and the wavelength is changed after each measurement [26].
In most pharmaceutical applications, Raman mapping systems are used. Raman spectroscopy is coupled with a microscope in order to acquire both spectral and spatial information of a sample. The Raman images make possible the characterisation of the pure compound in a pharmaceutical drug product and can provide the distribution of actives and excipients on the surface of a sample. The acquisition system generates hyperspectral data cube, defined by the spatial dimensions x and y and the spectral dimension p, corresponding to the Raman shift (Figure II-2). The easiest way of having an image is to observe the data at a specific Raman shift, but this visualisation can only be carried out when specific Raman bands are available. It is not suitable when signals are overlapped. In practice, spectral datasets are often composed by hundreds of variables (i.e. Raman shift) which makes the direct visualisation difficult. Due to high correlations between variables, their dimensions can be (mathematically) reduced without losing a lot of information [27].
Figure II-2 Generation of hyperspectral data cube
Every pixel contains a Raman spectrum, which can be a mixture of different compounds, depending on the spatial resolution used, which is a critical parameter of the analysis. Regarding
hundreds of micrometres (low spatial resolution). The lower the spatial resolution, the greater risks of acquiring mixture signals for each pixel. However, the higher the spatial resolution, the longer acquisition time. A compromise must be selected depending on the objective and the acquisition time.
1.3. Applications in the pharmaceutical environment
In the pharmaceutical environment, Raman spectroscopy is used for qualitative or quantitative analysis [28; 29]. The continuous improvement and simplification of apparatus have made the use of this analytical tool easier for analysts without knowing the Raman theory in details. The rapid, non-destructive and non-invasive features of this technology mark its potential suitability as a process analytical tool for the pharmaceutical industry, for both process monitoring and quality control throughout drug production [30]. Chemical imaging can be considered as an emerging platform technology that integrates conventional imaging and spectroscopy to attain both spatial and spectral information from a sample.
In the pharmaceutical environment, Raman spectroscopy and chemical imaging have been previously used in various ways [31]:
- Raw material identification in warehouses [10]
- Quantitative determination of active substance in a solid drug product [32; 33] - Detection and quantification of crystalline forms [34; 35]
- Fight against illegal drugs / Counterfeit detection [36-38]
- Process Analytical Technology: Support chemical or pharmaceutical development [39-41]
- Pharmaceutical development: determination of the tablet homogeneity [42; 43], understand dissolution performance [44]…
2. Chemometric tools
A Raman spectrum contains a lot of information that describes the chemical and physical composition of a sample. In the case of chemical imaging, the amount of data can be very important and a visual interpretation of the data is not possible. In order to extract the useful information, two approaches can be considered: univariate and multivariate data analysis. Historically, analysis of Raman data has been limited to the univariate approach by analysing
Raman band intensities or by calculating Raman band ratio. Univariate analysis is considered as the easiest, most prevalent and most robust data analysis approach and, in many cases, can provide sufficient information and reliable predictability [45]. But, most of the time, the complexity and the amount of data require the use of multivariate data analysis.
In most cases, chemometric tools appeared as a powerful solution to extract the desired information. Indeed, chemometrics was extremely useful to investigate complex and very similar spectra by extracting the relevant chemical information from the raw spectra, especially when they have a large number of variables and significant overlap of analytical signals. Another advantage is that chemometric tools are statistical methods which provide an objective way to examine spectra, as opposed to pure visual inspection [46]. Large datasets are generated using Raman spectroscopy, thus, extracting targeted information from these complex datasets is a real challenge.
Several chemometric methods have been developed and applied on spectroscopic data and hyperspectral imaging [15; 47]. In most applications of chemical imaging, data analysis procedure consists of the following steps [48] :
- Unfold the image (3-dimensions dataset to 2-dimensions dataset) - Pre-process the data (spike, baseline correction…)
- Perform data analysis (unsupervised or supervised algorithms) - Fold results back to image (distribution maps)
- Enhance resulting image (image filtering, contrast enhancement…)
In order to apply conventional chemometric tools on hyperspectral data cube, chemical images are usually unfolded from a 3-dimensions dataset to a 2-dimensions dataset. Common chemometric tools can then be applied on the unfolded hyperspectral images. By using these techniques, all the spectral information of the data cube is taken into account. Principal component analysis (PCA) [49], classical least squares (CLS) [50], partial least squares (PLS) [51], multivariate curve resolution (MCR) [52], partial least squares-discriminant analysis (PLS-DA) [53] or independent component analysis (ICA) [54] have been previously applied on hyperspectral dataset acquired by vibrational spectroscopy. Three of them were mainly used in this thesis: principal component analysis, independent component analysis and multivariate curve resolution-alternating least squares. By folding back the results, distribution maps can be obtained. Mathematical treatments or filters can be applied on the distribution maps in order to enhance image contrast, or to smooth the image, or to enhance edges in the image [55].
Some of the basic principles of these chemometric methods will be explained in the next sections as well as the pre-processing step of the data.
2.1. Data pre-processing
Pre-processing of the data is often necessary before applying chemometric methods in order to improve the model performance by removing perturbing effect or to enhance slight variations in the dataset [56]. With vibrational spectroscopy, it can be very important to decrease the influence of various signal sources that are not related to the useful chemical or physical information. Light scattering, variations during long acquisitions or different particle-size distributions could have a huge impact on the spectral quality and the use of pre-processing tools is often required.
A lot of pre-processing methods have been previously used on vibrational spectroscopy [57; 58]. Centering of the data, baseline correction or normalisation methods are very famous pre-processing techniques with vibrational spectroscopy. The use of derivative methods, coupled with a smoothing step (such as the Savitzky-Golay algorithm [59]) can be useful to enhance slight variations in the spectral dataset. In the case of Raman spectroscopy, cosmic rays can be observed on spectra, thus spike correction can also be necessary. Even if the objective of this thesis is not to provide an in-depth description of all the pre-processing tools applied on Raman spectroscopy, a brief description of the main approaches cited in this manuscript is provided in the next sections.
2.1.1. Spike correction
Spikes are usually sharp Raman bands which can influence the variance structure of the dataset. There are mainly explained by cosmic rays and high energy particles, striking the CCD (charge-coupled device) detector. These cosmic rays must be removed without modifying the Raman spectral bands before applying chemometrics tools. A lot of methods are available to correct these artefacts [60] and some of them have been successfully applied to Raman chemical imaging [61; 62]. In this work, a spatial approach based on [63] is applied. Image spectra in a square pixel area neighbourhood are used to identify outlier-contaminated data points in the central pixel of that neighbourhood. A preliminary “despiking” of the neighbouring spectra is performed by median filtering. Correlations between the central pixel spectrum and its “despiked” neighbours are calculated, and the most highly correlated spectrum is used to identify outliers. Spike-contaminated data are replaced using results of polynomial interpolation. Application of the spike correction is illustrated in Figure II-3, where signals
before and after the spike correction of a lactose spectrum are displayed. The spike at 610 cm-1
was clearly eliminated by the algorithm without modifying the Raman spectrum.
Figure II-3 Application of spike correction on a lactose spectrum
2.1.2. Baseline correction
A spectrum can be considered as the sum of a signal which contains the useful information on the chemical composition of a sample and a background signal which corresponds to the harmful information. With Raman spectroscopy, baseline variations can mainly arise from fluorescence effect by causing the disappearance of the Raman bands. Manual [64], semi-automated [65; 66] or fully semi-automated methods [67] can be applied on the data to correct these unwanted spectral variations.
In [66], a semi-automated method for fluorescence subtraction, based on a modification to least-squares polynomial curve fitting was described. The method was improved in [65] with the addition of a peak-removal procedure during the first iteration and a statistical method to account for signal to noise effects. Experimental results demonstrate that this approach improves the rejection of the fluorescence background during real-time Raman spectroscopy and for in vivo measurements characterized by low signal-to-noise ratios. To avoid the use of parameters such as the polynomial order selection, fully automated baseline correction techniques were developed [67].
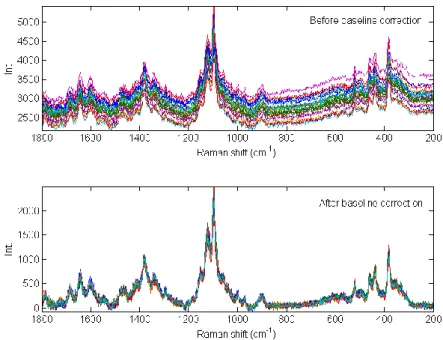
Asymmetric least squares (AsLS) is also a powerful method for removing baseline offset from raw Raman spectra. With this approach, it is assumed that some variables contain only background contributions. A polynomial is fitted to each spectrum and variables below the polynomial are up weighted before the next iteration. Process is repeated until that a pre-defined number of variables is reached [68-70]. Application of AsLS pre-processing step was illustrated in Figure II-4 on 25 Raman spectra of microcrystalline cellulose. Comparing with the raw spectra, the baseline variation was successfully corrected by the algorithm.
Figure II-4 Application of baseline correction using Asymmetric Least Squares on 25 spectra of microcrystalline cellulose
2.1.3. Normalisation
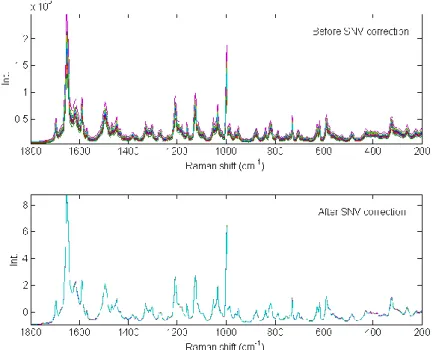
Due to acquisition variability and to concentrations or scattering variations of a compound, In some cases, Raman intensities can be different between samples or during the whole acquisition. In most situations, a normalisation has to be applied by dividing each variable of a spectrum with a constant [71]. The constant can be the maximum value of a spectrum, or the sum of all variables from a spectrum (also called the normalisation to unit area), or the sum of squares of all variables from a spectrum (also called the normalisation to unit length). Other methods such as standard normal variate (SNV) [72] or multiplicative scatter correction (MSC) [73], previously applied on near infrared spectra, have also been used successfully on Raman dataset
[74]. In Figure II-5, the SNV pre-processing was applied on 25 Raman spectra of Amlodipine. Spectral variability observed in the raw spectra was successfully corrected.
Figure II-5 Application of SNV correction on 25 spectra of Amlodipine
2.1.4. Derivatives
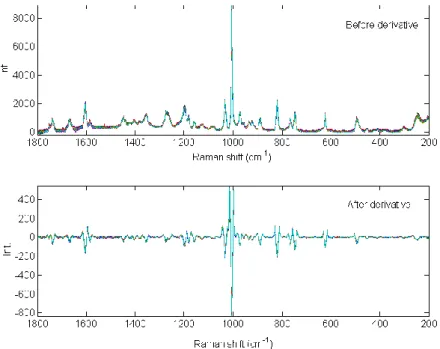
Derivatives can be applied on spectral data for two objectives. The first one is the correction of the baseline variations and the second one is the enhancement of the slight spectral variations. Most applications used a Savitzky-Golay [59] derivation which combines a smoothing and a derivative steps. With derivatives, the signal quality can decrease because the noise will be enhanced. A well-defined compromise has to be chosen between the derivative order, the polynomial order and the window size in accordance with the expected spectral quality.
In Figure II-6, a second order derivative with a window size equal to 9 and 2nd polynomial order,
was applied on 25 Raman spectra of aspartame. Baseline variations were significantly decreased and slight spectral variations were enhanced by preserving a sufficient spectral quality.
Figure II-6 Example of derivative correction on 25 spectra of aspartame
2.2. Multivariate data analysis
2.2.1. Principal component analysis
The main goal of principal component analysis (PCA) is to reduce the dimensionality of a matrix by removing correlations between variables. PCA decomposes the data in a new set of variables called principal components progressively explaining the largest variations of the dataset [75]. The second principal component is orthogonal to the first one and explains the residual variance not taken into account by the previous one. A spectral matrix can be explained by the score matrix T, a loading matrix P and a residual matrix E with the equation:
(II-3)
Scores refer to spectral variations while loadings represent the spectral contributions to each principal component. For a specific number of components, the residual matrix contains the non-explained information. It will decrease with the number of principal components. With chemical imaging applications, score results can be folded back on order to observe the pixel variability for each principal component. In the case of Raman spectra, where the variables are highly correlated, the number of components is usually considerably lower than the number of variables. PCA can be viewed as a specific case of eigen-decomposition on the
variance-covariance spectral matrix [76]. It is considered as a very powerful tool for exploratory analysis or dimension reduction, and it can also be an interesting tool to detect the number of components in a mixture dataset.
PCA was successfully applied on a lot of vibrational datasets and hyperspectral images [77; 78]. In some cases, the variability associated to a principal component can be linked with a chemical compound of a tablet but in most applications, due to their unclear chemical meaning, loadings and associated images are difficult to interpret.
2.2.2. Independent component analysis
Independent component analysis (ICA) is one of the most powerful techniques in blind source separation [79; 80], assuming that each row of the studied matrix is a weighted sum of pure source signals. It has been developed to extract the pure underlying signals from a set of mixed signals in unknown proportions. Considering a noise-free ICA model, a matrix X (n x m) is decomposed as a linear generative model by the following expression:
(II-4)
Where S is a (k x m) matrix of k independent source signals called the independent components and A is a (n x k) mixing matrix of coefficients or proportions of the pure signals in each mixed signal of X. The objective of ICA is to estimate a set of vectors that are as independent as possible, and the mixed signals in X can then be expressed as linear combinations of these independent components (ICs). It attempts to recover the original signals by estimating a linear transformation, using a criterion which reflects the statistical independence among the sources.
To solve the previous equation, an unmixing matrix W based on the observation of X needs to be calculated. The output U, constituted by the independent component u1,u2, … un should be as independent as possible. For a noise-free ICA model, W should be the inverse of A, and U should be equal to S, according to the following equation:
(II-5)
The mixing matrix A can then be calculated as:
2.2.3. Multivariate curve resolution-Alternating least squares
Multivariate curve resolution-alternating least squares (MCR-ALS) is a well-known resolution method [81; 82] which has the objective of decomposing an original matrix (n samples or rows and p variables or columns) of a multi-component system into the underlying bilinear model which assumes that the observed spectra are a linear combination of the spectra of the pure components in the system:
(II-7)
where C is the matrix of concentration profiles, ST the matrix of pure responses (i.e. spectra) and E contains the experimental error. In resolution of spectroscopic images, is the matrix of the unfolded image, C contains the concentration profiles that, conveniently refolded, show the distribution maps of each image constituent and ST contains the associated pure spectra [83]. In order to provide chemically meaningful profiles (i.e. pure spectra and distribution maps) and to strive for a unique MCR-ALS solution, several constraints must be properly chosen during the iterative calculation process (non-negativity, equality…) [84-86].
MCR-ALS must be initialised by a first estimate of C or ST matrix. Initial estimates can be manually filled where pure spectrum of each constituent is known but generally, a mathematical approach is applied. SIMPLISMA (Simple-to-use interactive self-modeling mixture analysis) [87], orthogonal projection approach (OPA) [88], independent component analysis (ICA) [89] or evolving factor analysis (EFA) [90] were used on spectroscopic data to identify pure signals in a mixture dataset.
During iterative process, figures of merit are the lack of fit (lof) and the explained variance (R²). The lack of fit is used to check if the experimental data were well fitted by the MCR-ALS procedure. These two criteria are calculated as follow:
√∑
∑ (II-8)
∑ ∑
∑ (II-9)
where is the input element of the original matrix and the related residual element after
3. Identification of a low dose compound
3.1. Definition of a low dose compound
The main objective of this thesis is the detection of a low dose compound in a pharmaceutical drug product by using Raman microscopy. In a large point of view, it can be generalised to the detection of a scarce sample in hyperspectral dataset and it can be extended to other applications (example: identification of a contaminant in food engineering). A scarce sample can be defined by a compound which has low spatial distribution and low spectral contribution in the data cube.
By definition, hyperspectral dataset are characterized by spectral and spatial dimensions. Regarding the spatial aspect, a specific compound can be distributed in most pixels of the image (the distribution of this compound can be considered as homogeneous) or in a few pixels of the image (the distribution of this compound can be considered as heterogeneous). Regarding the spectral aspect, the compound can provide high or low spectral contributions, depending on its concentrations or proportions in a spectrum, or depending on its absorptivity or spectral responses. As it is shown in Table II-1, four different cases can be found and observed for a specific compound in an image. Two of them (high spectral contribution in most pixels and high spectral contributions in a few pixels) can be easily tackled since the spectral information is highly present in several image pixels, i.e. several spectra. In this work, only the case of a compound which has low spatial and spectral contributions was studied.
Spatial
In most pixels In a few pixels
Spect
ral
High spectral contributions
Pure spectra and distribution maps can be easily calculated
Pure spectra and distribution maps can be easily calculated
Low spectral contributions
Low spectral contribution of the compound
Low spatial and spectral contributions of the
compound
Table II-1 Spatial and spectral contributions of a compound
3.2. The sampling aspect
In the pharmaceutical environment, the main objective of Raman chemical imaging is to study the distribution of actives and excipients in tablets or powders. Even if a pharmaceutical drug product is included within the quality specifications, the different compounds can be considered as non-homogeneously distributed in the tablet, leading to a possible sampling error if the entire image of the sample is not acquired. Because the whole tablet is not perfectly homogeneous, acquisition of different areas could provide various results [91].
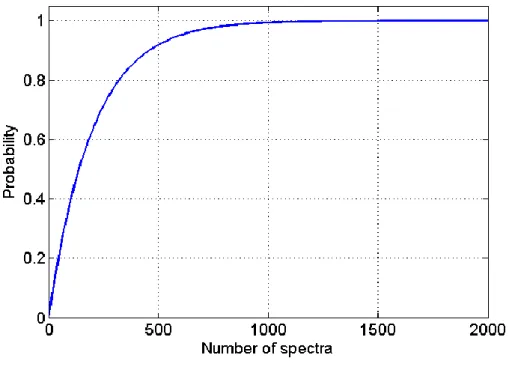
Raman microscopy has been previously tested to study the identification of a low-content active pharmaceutical ingredient. In [92], tablets were prepared with two forms of API which one is considered undesirable and lower than 1% w/w. Authors focused on the number of image spectra to acquire in order to ensure the spectral detection of the low-concentrated form. The probability of observing at least one spectrum of a low dose compound can be calculated as follow:
(II-10)
and
(II-11)
Where “bin” stands for binomial distribution, is the number of spectra of the low dose compound found from n spectra, and c the concentration of the low dose spectra. For example, for a 0.5% w/w low dose compound in a formulation, there is a probability higher than 99% to find a spectrum if more than 1000 spectra are acquired (Figure II-7).
Figure II-7 – Probability of finding at least one spectrum of a 0.5% w/w low dose compound
Even if these studies have shown the critical aspect of the number of spectra in an image, the statistical approaches developed did not consider a critical parameter of an acquisition: the spatial resolution. With chemical imaging, Raman measurements can be performed at a macroscopic or a microscopic scale. When a macroscopic scale is used, the spatial resolution can be generally considered as lower than the particle size of each compound. Therefore, the measured signal may not be representative of a pure pixel composition, and can be a mixture of different compounds. This occurs because of the light penetrating deep into the sample. The acquired signal at a specific pixel position is not originated only from a small and confined volume on the surface of the tablet but also from under the surface and the sides, depending on the apparatus and the sample. In theory, the higher the magnification, the smaller the dissipation of the light and the sampling area which leads to a pure compound identification [93]. Because Raman signals from various compounds of the tablet normally interfere [92], spectral modifications can be difficult to identify in the case of a low dose compound.
The probability of finding spectra (or pixels) of a given constituent is related to its concentration in the formulation, to its distribution in the tablet, to its scattering coefficient, to apparatus and acquisition parameters. Even if optimization of the chemical imaging system (for example by using a high spatially resolved spectrometer) appeared as a straightforward solution to detect a low dose compound, it increases significantly the number of points and hence, the time required
By considering the spectral variations, several compounds can have interferences, with overlapped Raman bands, which can make the identification of a constituent harder, especially in the case of a low dose compound. Therefore, multivariate data analysis of the spectral dataset can significantly improve identification and detection of a compound. But in practice, the precision and sensitivity of qualitative or quantitative analysis is very sensitive to both the spectrometer and sampling errors.
3.3. Data analysis aspect
For a lot of compounds, Raman spectroscopy provides spectrum with sharp and well-defined Raman bands. Generally, active responses are much stronger than those from excipients so that even low concentrations can be satisfactory detected. For those reasons, the distinction of active among the components of a formulation can be manually and visually performed by the analyst [94; 95] using univariate observation at a single variable (i.e. Raman shift) or by calculating surface ratio of Raman bands.
However, in most applications, Raman bands are overlapped and a direct interpretation of the spectra is not possible. Therefore, chemometric tools appeared as the only solution to extract useful information from the acquired signals. Several chemometric methods have been developed on vibrational dataset or hyperspectral imaging data cube (see Chapter II, paragraph 2) and most of them have studied the distributions of “sufficiently concentrated” pharmaceutical compounds, using prior knowledge on the studied formulation.
In some cases, the detection of a low dose compound can be useful to ensure the product quality or to improve the development of a product. In the literature, it has been previously studied from usual spectroscopic data by using bulk measurements [96; 97] and chemometric tool such as the PLS regression [98-100] and some of them focused on the detection limit of the analytical method [101]. The use of the net analyte signal (NAS) [102; 103] pre-processing appeared as an interesting tool to accurately resolve the analyte signal of a low dose compound and allow the construction of a quantitative model [104]. Several adaptations of these approaches can be considered, depending on the spectral basis (i.e. space containing the contributions to be removed) used for projecting the original dataset.
With the definition provided in section 3.1, a low dose compound can be viewed as a product with low spectral variance (i.e. low spectral contribution) within the entire dataset. The variance is one of the moments of a distribution. In theory, it describes how far a set of samples is spread out around the mean. In this work, because the data are not centered, the variance can be
associated with the dispersion of samples around a predefined value. Due to low spectral contributions of the low dose compound, and because it is only present in a few spectra (i.e. pixels), a visual identification of its distribution is not possible and usual chemometric method, mainly based on statistical moment decompositions, may encounter some difficulties to extract the associated information. Therefore, the detection of a low dose compound by using Raman microscopy and chemometrics appeared as a real challenge and, to our knowledge, it has not been studied in a previous work.
3.4. Contributions of the thesis
The present work uses Raman microscopy to study the distribution of actives and excipients in a pharmaceutical drug product. It focuses on the application of chemometric tools to identify both major and minor compounds of a pharmaceutical formulation, including spectral features and distribution maps of each product. The detection of a low dose compound in a tablet is the common thread of this thesis. It was defined above as a product with low spatial and spectral contributions, meaning that the information is contained only in few pixels of the image and mixed with the other compound spectra or scattered in noise contribution.
With usual chemometrics methods, hyperspectral image analysis can be viewed as the resolution of the following equation: where X is the initial dataset, C the matrix of concentrations and S the matrix of pure spectra. C and S can be calculated without prior knowledge by using blind source separation methods or with prior knowledge by using resolution methods. In this work, ICA and MCR-ALS, which have been previously applied on spectroscopic measurements and hyperspectral imaging to provide spectral features and distribution maps, were used. In both cases, the decomposition of statistical moments (variances or cumulants) was required. Considering the studied case of the low dose compound, we can make the hypothesis that, because these algorithms are mainly based on the decomposition of statistical moments, identification of this product within hyperspectral dataset can be difficult and different improvements or adjustments should be required.
In chapter III and chapter IV, the hypothesis presented above is challenged by applying ICA and MCR-ALS on hyperspectral image of a pharmaceutical tablet to provide the distributions of actives and excipients. The studied sample includes a lubricant which corresponds to the low dose compound. By applying ICA and MCR-ALS as usual, without any modifications of the calculation process, it can be assumed that these algorithms are not able to extract the low dose compound contributions. Some improvements and modifications of these two algorithms are