HAL Id: inria-00544992
https://hal.inria.fr/inria-00544992
Submitted on 9 Dec 2010
HAL is a multi-disciplinary open access
archive for the deposit and dissemination of
sci-entific research documents, whether they are
pub-L’archive ouverte pluridisciplinaire HAL, est
destinée au dépôt et à la diffusion de documents
scientifiques de niveau recherche, publiés ou non,
distributed system: the Grid’5000 platform in 2008
Anne-Cécile Orgerie, Laurent Lefèvre
To cite this version:
Anne-Cécile Orgerie, Laurent Lefèvre. A year in the life of a large scale experimental distributed
system: the Grid’5000 platform in 2008. [Research Report] RR-7481, INRIA. 2010, pp.33.
�inria-00544992�
a p p o r t
d e r e c h e r c h e
9 9 IS R N IN R IA /R R --7 4 8 1 --F R + E N G Thème NUMA year in the life of a large scale experimental
distributed system: the Grid’5000 platform in 2008
Anne-Cécile Orgerie — Laurent Lefèvre
N° 7481
distributed system: the Grid’5000 platform in 2008
Anne-Cécile Orgerie , Laurent Lefèvre
Thème NUM — Systèmes numériques Projets Reso
Rapport de recherche n° 7481 — March 2010 — 33pages
Abstract: This report presents the usage results of Grid’5000 over year 2008. Usage of the main operationnal Grid’5000 sites (Bordeaux, Lille, Lyon, Nancy, Orsay, Rennes, Sophia-Antipolis, Toulouse) is presented and analyzed.
en 2008
Résumé : Ce rapport présente les résultats d’usage de la plateforme expérimentale Grid’5000 pendant l’année 2008. L’usage des principaux sites opérationnels de Grid’5000 (Bordeaux, Lille, Lyon, Nancy, Orsay, Rennes, Sophia-Antipolis, Toulouse) est presenté et analysé. Mots-clés : Système distribué à grande échelle, usage, Grid’5000
Contents
1 Introduction 4
2 Definitions and Methodology 4
2.1 Grid’5000: a Large-Scale Experimental Distributed System . . . 4
2.2 Experiment Methodology . . . 5
3 Results per Grid’5000 site 5 3.1 Usage of Grid’5000’s Bordeaux site in 2008 . . . 6
3.2 Usage of Grid’5000’s Lille site in 2008 . . . 9
3.3 Usage of Grid’5000’s Lyon site in 2008 . . . 12
3.4 Usage of Grid’5000’s Nancy site in 2008 . . . 15
3.5 Usage of Grid’5000’s Orsay site in 2008 . . . 18
3.6 Usage of Grid’5000’s Rennes site in 2008 . . . 21
3.7 Usage of Grid’5000’s Sophia site in 2008 . . . 24
3.8 Usage of Grid’5000’s Toulouse site in 2008 . . . 27
3.9 Results summary . . . 30
4 Conclusions 32
List of Figures 32
1
Introduction
Some previous work on operational Grids [IDE+06] show that grids are not utilized at
their full capacity. We focus on the utilization of a large-scale experimental distributed system by relying on the case study of Grid’5000[Cea05]1, a French experimental Grid. We
collected and analyzed the logs of the Grid’5000 platform for a full year of usage (2008). We present the main statistics observed for each site and some specific and representative computing nodes. A special analysis is dedicated to the grid usage of this experimental platform. This usage analysis has been used in some works on energy-efficient experimental distributed infrastructures [OLG08a, OLG08b]. A similar analysis has been done for 2007 logs of Grid’5000 and can been found in [OL09].
This paper briefly presents the Grid’5000 experimental platform and the followed method-ology in Section2. The usage statistics are then presented for each Grid’5000 site (Section3).
2
Definitions and Methodology
2.1
Grid’5000: a Large-Scale Experimental Distributed System
The Grid’5000 platform is an experimental testbed dedicated for research in computer sci-ence, made up of more than 3400 processors geographically distributed on 9 sites in France (see Fig. 1). This platform can be defined as a highly reconfigurable, controllable, and monitorable experimental large-scale distributed system.
Figure 1: The Grid’5000 map
1Some experiments of this article were performed on the Grid’5000 platform, an initiative from the
French Ministry of Research through the ACI GRID incentive action, INRIA, CNRS and RENATER and other contributing partners (http://www.grid5000.fr). This research is supported by the GREEN-NET INRIA Cooperative Research Action:http://www.ens-lyon.fr/LIP/RESO/Projects/GREEN-NET/
The utilization of Grid’5000 can be very specific. Each user can reserve (in advance) some computing nodes. During its reservation time, the user can be root on his reserved nodes and he can deploy his own system images, collect data, launch applications, reboot the nodes, and so on. The nodes are entirely dedicated to the user during his reservation.
2.2
Experiment Methodology
The user gives the resource manager (at least) a start time, a duration, and the number of required resources. These characteristics define the job (a reservation). The resource manager is in charge of the job’s acceptance. It verifies if that job is compatible with previously accepted jobs and, if it is, it gives a job id to the user.
There are three different type of jobs:
• deploy: the user deploys its own environment, • default : the user uses the default environment.
• besteffort : they get scheduled on processes when no other job use them and these jobs are killed when a regular (deploy or default) job recently submitted needs the nodes used by a besteffort job.
When a resource is not available for the user, it can be in different states: • dead: the resource is down (due to a component failure for example); • suspected: the resource does not work properly;
• absent: the resource is not available for the user (not physically present).
Moreover, the platform has changed between the beginning and the end of the measure-ments. For that reason, we present the results as percentages of the platform’s capacity at the time of measurement (100% at a given time does not represent the same number of resources as 100% at another time).
In order to obtain the utilization traces, we have used a history function provided by OAR2 [CCG+05] called oarstat. This function provides the user with all the events that
occur during a time period. An event can be a job or a problem on a resource (it is dead, absent or suspected) for a given period. Our goal is to obtain a detailed overview of the usage of an experimental grid.
3
Results per Grid’5000 site
For each Grid’5000 site, we provide several values and figures which represent the global usage of the site. All the times are given in seconds. A resource is a core and a job is actually a reservation.
We have split the proposed statistics in three categories:
• the “platform and resources” part which lists the available number of resources and some statistics on the resources’ states. We also compute the real work time of the Grid’5000 site. The “real” percentage of work time is calculated without taking into account dead time or absent time (i.e. work time over total time minus dead time and absent time for all the resources).
• the “jobs” part proposes some statistics on the number of submitted jobs (reservations), the mean time and mean number of resources per job, and the maximal duration of a job on a site. We also list the number of reservations used for deploying system images (deploy jobs).
• the “users” section contains the number of users and the impact of users from other Grid’5000 sites. The percentage of users coming from other sites does not take into account any consideration of proportionality in terms of jobs. It is just the number of users coming from other sites over the total number of users (each user is counted once).
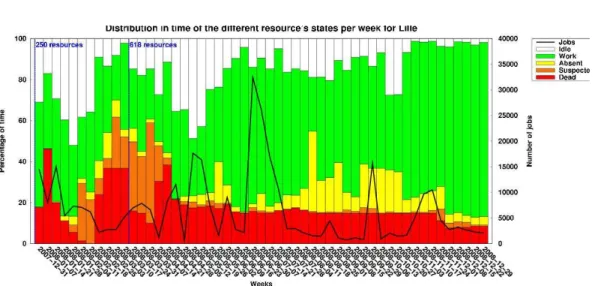
For each site, we provide four diagrams. The first one represents the weekly repartition in time of the resources between the different states: in red when some cores are dead (Dead state), in orange when they are suspected (Suspected state), in yellow when they are absent (Absent state), in green when they are working (a job is running) (Work state), and in white when they are unoccupied (no job, no other state) (Idle state).
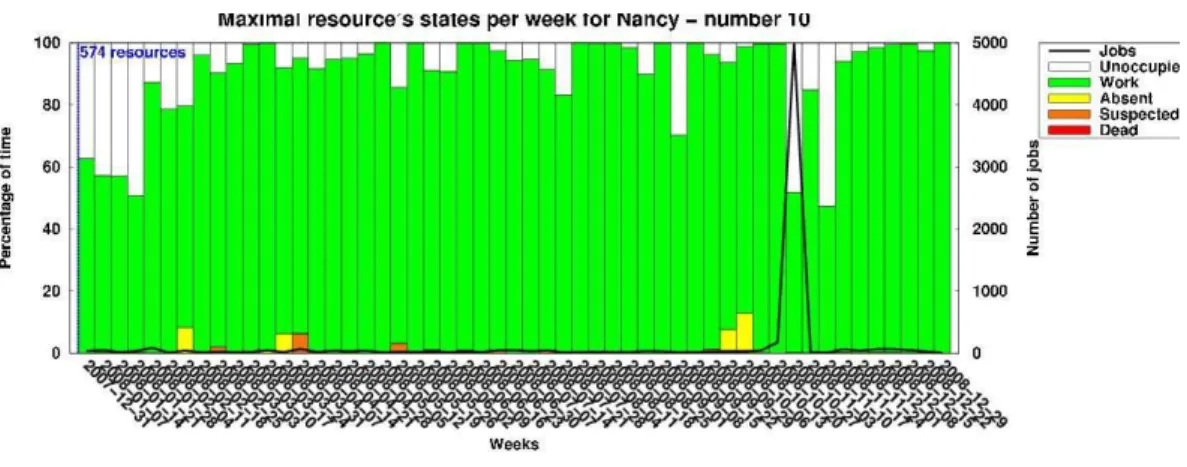
The two other diagrams present the weekly time repartition of two particular resources: the median and the maximal resources. The "maximal resource" is the resource which has the maximal work time among the resources which are present for the whole 2008 year. The "median resource" is a resource which is present for the whole 2008 year and is the nearest to the median value of cumulative work over the experiment’s duration.
3.1
Usage of Grid’5000’s Bordeaux site in 2008
• Platform and resources:
– Maximal number of resources (cores): 650
– Mean time spent in each state for all the resources, in percentage: ∗ Dead: 3.48%
∗ Suspected: 5.53% ∗ Absent: 4.06% ∗ Work: 49.19%
– Real percentage of work time (without taking into account the time when the resources are dead or absent): 53.20%
• Jobs:
– Mean time of a job: 2473.38 (41 minutes and 13 seconds)
– Maximal duration: 794428 s. (9 days 4 hours 40 minutes and 28 seconds) for job number 407783
– Mean number of resources (cores) per job: 7.44 – Percentage of deploy jobs: 0.97%
– Percentage of time spent in deploy jobs compared to the work time: 22.32% – Percentage of jobs coming from other sites: 83.28%
– Percentage of besteffort jobs: 58.03%
– Percentage of time spent in besteffort jobs compared to the work time: 34.90% • Users:
– Number of users: 223
– Percentage of users coming from other sites: 87%
Figure 3: Global diagram without dead time for Grid’5000’s Bordeaux site
Figure 5: Maximal resource diagram for Grid’5000’s Bordeaux site
We can see on these graphs that the site load is not related to the number of jobs. Indeed, between May and August, there are few jobs but the percentage of activity is high (Figure 2). Bordeaux is the less used Grid’5000 site for 2008 in terms of real activity. However, its activity has increased compared to the previous year [OL09].
3.2
Usage of Grid’5000’s Lille site in 2008
• Platform and resources:
– Maximal number of resources (cores): 618
– Mean time spent in each state for all the resources, in percentage: ∗ Dead: 16.21%
∗ Suspected: 4.67% ∗ Absent: 8.61% ∗ Work: 54.80%
– Real percentage of work time (without taking into account the time when the resources are dead or absent): 72.89%
• Jobs:
– Number of jobs (reservations): 344538
– Mean time of a job: 3154.58 s. (52 minutes and 34 seconds)
– Maximal duration: 756077 s. (8 days 18 hours 1 minute and 17 seconds) for job number 693546
– Percentage of deploy jobs: 0.61%
– Percentage of time spent in deploy jobs compared to the work time: 7.24% – Percentage of jobs coming from other sites: 38.97%
– Percentage of besteffort jobs: 19.01%
– Percentage of time spent in besteffort jobs compared to the work time: 37.88% • Users:
– Number of users: 198
– Percentage of users coming from other sites: 65.66%
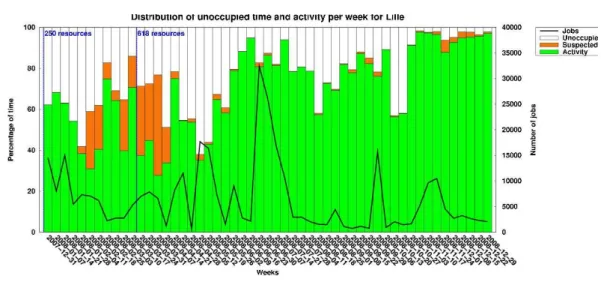
Figure 7: Global diagram without dead time for Grid’5000’s Lille site
Figure 9: Maximal resource diagram for Grid’5000’s Lille site
The number of resources has greatly increase from 250 to 618 cores during the year 2008. The last two months of the year show a really high utilization of this site (over 95% during those two months). Moreover, we can see on Figure8that even the oldest resources are reserved and used for experiments on Grid’5000 Lille site.
3.3
Usage of Grid’5000’s Lyon site in 2008
• Platform and resources:
– Maximal number of resources (cores): 322
– Mean time spent in each state for all the resources, in percentage: ∗ Dead: 1.82%
∗ Suspected: 2.78% ∗ Absent: 3.43% ∗ Work: 65.64%
– Real percentage of work time (without taking into account the time when the resources are dead or absent): 69.27%
• Jobs:
– Number of jobs (reservations): 138217
– Mean time of a job: 3723.55 s. (1 hour 2 minutes and 4 seconds)
– Maximal duration: 1080001 s. (12 days 12 hours and 1 second) for job number 124333
– Percentage of deploy jobs: 3.88%
– Percentage of time spent in deploy jobs compared to the work time: 49.69% – Percentage of jobs coming from other sites: 87.07%
– Percentage of besteffort jobs: 44.00%
– Percentage of time spent in besteffort jobs compared to the work time: 24.14% • Users:
– Number of users: 169
– Percentage of users coming from other sites: 73.37%
Figure 11: Global diagram without dead time for Grid’5000’s Lyon site
Figure 13: Maximal resource diagram for Grid’5000’s Lyon site
Lyon is the smallest Grid’5000 site for the year 2008. No machine has been added during this year to this site. However, it is really used. Another peculiarity of this site is that it gets the smallest reservations in terms of mean number of resources per reservation and among the smallest reservations in terms of mean length. It also gets the biggest time spent (in percentage) in deploy jobs: almost half of the time nodes are working with user’s environments.
3.4
Usage of Grid’5000’s Nancy site in 2008
• Platform and resources:
– Maximal number of resources (cores): 574
– Mean time spent in each state for all the resources, in percentage: ∗ Dead: 0.11%
∗ Suspected: 0.90% ∗ Absent: 1.95% ∗ Work: 58.84%
– Real percentage of work time (without taking into account the time when the resources are dead or absent): 60.08%
• Jobs:
– Number of jobs (reservations): 74592
– Mean time of a job: 8912.82 s. (2 hours 28 minutes and 33 seconds)
– Maximal duration: 1695503 s. (19 days 14 hours 58 minutes and 23 seconds) for job number 213465
– Mean number of resources (cores) per job: 14.63 – Percentage of deploy jobs: 4.23%
– Percentage of time spent in deploy jobs compared to the work time: 29.95% – Percentage of jobs coming from other sites: 20.11%
– Percentage of besteffort jobs: 76.16%
– Percentage of time spent in besteffort jobs compared to the work time: 17.05% • Users:
– Number of users: 157
– Percentage of users coming from other sites: 83.44%
Figure 15: Global diagram without dead time for Grid’5000’s Nancy site
Figure 17: Maximal resource diagram for Grid’5000’s Nancy site
The amount of available resources remains constant during the year 2008. This site presents a healthy working: almost no dead, suspected and absent periods. However, the load is not really balanced between the nodes as shown by Figures16and17.
3.5
Usage of Grid’5000’s Orsay site in 2008
• Platform and resources:
– Maximal number of resources (cores): 684
– Mean time spent in each state for all the resources, in percentage: ∗ Dead: 5.82%
∗ Suspected: 12.20% ∗ Absent: 6.45% ∗ Work: 50.73%
– Real percentage of work time (without taking into account the time when the resources are dead or absent): 57.82%
• Jobs:
– Number of jobs (reservations): 92862
– Mean time of a job: 6246.07 s. (1 hour 44 minutes and 6 seconds)
– Maximal duration: 1060487 s. (12 days 6 hours 34 minutes and 47 seconds) for job number 101189
– Mean number of resources (cores) per job: 14.58 – Percentage of deploy jobs: 3.59%
– Percentage of time spent in deploy jobs compared to the work time: 38.98% – Percentage of jobs coming from other sites: 96.28%
– Percentage of besteffort jobs: 38.91%
– Percentage of time spent in besteffort jobs compared to the work time: 27.17% • Users:
– Number of users: 172
– Percentage of users coming from other sites: 76.16%
Figure 19: Global diagram without dead time for Grid’5000’s Orsay site
Figure 21: Maximal resource diagram for Grid’5000’s Orsay site
This site is really more used than the previous year (18.88% of real activity in 2007 [OL09]). It is one of the biggest sites in terms of resources and attracts a lot of jobs coming from other sites.
3.6
Usage of Grid’5000’s Rennes site in 2008
• Platform and resources:
– Maximal number of resources (cores): 714
– Mean time spent in each state for all the resources, in percentage: ∗ Dead: 4.79%
∗ Suspected: 0.44% ∗ Absent: 0.79% ∗ Work: 60.98%
– Real percentage of work time (without taking into account the time when the resources are dead or absent): 64.58%
• Jobs:
– Number of jobs (reservations): 58843
– Mean time of a job: 7069.33 s. (1 hour 57 minutes and 49 seconds)
– Maximal duration: 604825 s. (7 days and 25 seconds) for job number 289263 – Mean number of resources (cores) per job: 27.32
– Percentage of deploy jobs: 7.84%
– Percentage of jobs coming from other sites: 87.41% – Percentage of besteffort jobs: 50.01%
– Percentage of time spent in besteffort jobs compared to the work time: 23.38% • Users:
– Number of users: 213
– Percentage of users coming from other sites: 82.63%
Figure 23: Global diagram without dead time for Grid’5000’s Rennes site
Figure 25: Maximal resource diagram for Grid’5000’s Rennes site
From Figures24and25, we see a really heterogeneous usage of the resources (proba-bly) due to the heterogeneity of the nodes. This site is the biggest one in terms of resources and its activity percentage is really on the average. Due to its size, it allows bigger reserva-tion. So, it has the higher mean number of resources per reservation (27.32) but one of the smallest number of reservations for the whole year.
3.7
Usage of Grid’5000’s Sophia site in 2008
• Platform and resources:
– Maximal number of resources (cores): 568
– Mean time spent in each state for all the resources, in percentage: ∗ Dead: 2.04%
∗ Suspected: 0.37% ∗ Absent: 1.98% ∗ Work: 78.25%
– Real percentage of work time (without taking into account the time when the resources are dead or absent): 81.51%
• Jobs:
– Number of jobs (reservations): 58142
– Mean time of a job: 8767.35 s. (2 hours 26 minutes and 7 seconds)
– Maximal duration: 485924 s. (5 days 14 hours 58 minutes and 44 seconds) for job number 345959
– Percentage of deploy jobs: 8.76%
– Percentage of time spent in deploy jobs compared to the work time: 25.64% – Percentage of jobs coming from other sites: 87.24%
– Percentage of besteffort jobs: 54.36%
– Percentage of time spent in besteffort jobs compared to the work time: 19.57% • Users:
– Number of users: 187
– Percentage of users coming from other sites: 85.03%
Figure 27: Global diagram without dead time for Grid’5000’s Sophia site
Figure 29: Maximal resource diagram for Grid’5000’s Sophia site
This site has the smallest number of jobs for the whole year compared to the other Grid’5000 sites. But, due to a high mean number of resources per reservation, it gets the highest percentage of activity (81.51%). This is illustrated on Figures26and27.
3.8
Usage of Grid’5000’s Toulouse site in 2008
• Platform and resources:
– Maximal number of resources (cores): 434
– Mean time spent in each state for all the resources, in percentage: ∗ Dead: 5.00%
∗ Suspected: 1.22% ∗ Absent: 14.86% ∗ Work: 49.42%
– Real percentage of work time (without taking into account the time when the resources are dead or absent): 61.67%
• Jobs:
– Number of jobs (reservations): 166191
– Mean time of a job: 2211.80 s. (36 minutes and 52 seconds)
– Maximal duration: 1080018 s. (12 days 12 hours and 18 seconds) for job number 94101
– Mean number of resources (cores) per job: 6.29 – Percentage of deploy jobs: 1.47%
– Percentage of time spent in deploy jobs compared to the work time: 28.37% – Percentage of jobs coming from other sites: 96.15%
– Percentage of besteffort jobs: 6.86%
– Percentage of time spent in besteffort jobs compared to the work time: 24.85% • Users:
– Number of users: 160
– Percentage of users coming from other sites: 81.88%
Figure 31: Global diagram without dead time for Grid’5000’s Toulouse site
Figure 33: Maximal resource diagram for Grid’5000’s Toulouse site
Toulouse has the shortest reservations with an average around 36 minutes. During the last two weeks of the year, the site is used at its full capacity (about 98% of activity). This site is one of the smallest Grid’5000 sites.
3.9
Results summary
Tables1,2,3,4, summarize the main observed statistics in terms of resources, jobs and users. These results show that the Grid5000 platform faces some heterogeneous usage depending on the involved sites.
• Platform and resources:
Site Number of resources (cores) Percentage of ‘real’ activity
Bordeaux 650 53.20% Lille 618 72.89% Lyon 322 69.27% Nancy 574 60.08% Orsay 684 57.82% Rennes 714 64.58% Sophia 568 81.51% Toulouse 434 61.67% Total Grid’5000 4564 64.67%
Table 1: Resource-related statistics • Jobs:
Site
Number of Mean number Mean duration Jobs coming jobs of resources of a job from other (reservations) per job (seconds) sites Bordeaux 356222 7.44 2473.38 83.28% Lille 344538 8.11 3154.58 38.97% Lyon 138217 4.39 3723.55 87.07% Nancy 74592 14.63 8912.82 20.11% Orsay 92862 14.58 6246.07 96.28% Rennes 58843 27.32 7069.33 87.41% Sophia 58142 22.14 8767.35 87.24% Toulouse 166191 6.29 2211.80 96.15%
Table 2: Job-related statistics
Site
Percentage Time spent Percentage Time spent Percentage Time spent of deploy in deploy of besteffort in besteffort of default in default
jobs jobs jobs jobs jobs jobs
Bordeaux 0.97% 22.33% 58.03% 34.90% 41.00% 42.77% Lille 0.61% 7.24% 19.10% 37.88% 80.29% 54.88% Lyon 3.88% 49.69% 44.00% 24.14% 52.12% 26.17% Nancy 4.23% 29.95% 76.16% 17.05% 19.61% 53.00% Orsay 3.59% 38.98% 38.91% 27.17% 57.50% 33.85% Rennes 7.84% 35.96% 50.01% 23.38% 42.15% 40.66% Sophia 8.76% 25.64% 54.36% 19.57% 36.88% 54.79% Toulouse 1.47% 28.37% 6.86% 24.85% 91.67% 46.78%
Table 3: Job-related statistics • Users:
Site Number of users Users from other sites
Bordeaux 223 87.00% Lille 198 65.66% Lyon 169 73.37% Nancy 157 83.44% Orsay 172 76.16% Rennes 213 82.63% Sophia 187 85.03% Toulouse 160 81.88%
4
Conclusions
We have observed an activity increase for all the Grid’5000 sites compared to 2007 year [OL09]. The global activity of the platform has grown from 40% to 65%. 2007 was still a develop-ment year for Grid’5000, whereas in 2008, the platform is fully working and it reaches its cruising speed.
List of Figures
1 The Grid’5000 map . . . 4
2 Global diagram with dead time for Grid’5000’s Bordeaux site . . . 7
3 Global diagram without dead time for Grid’5000’s Bordeaux site . . . 8
4 Median resource diagram for Grid’5000’s Bordeaux site . . . 8
5 Maximal resource diagram for Grid’5000’s Bordeaux site . . . 9
6 Global diagram with dead time for Grid’5000’s Lille site . . . 10
7 Global diagram without dead time for Grid’5000’s Lille site . . . 11
8 Median resource diagram for Grid’5000’s Lille site . . . 11
9 Maximal resource diagram for Grid’5000’s Lille site . . . 12
10 Global diagram with dead time for Grid’5000’s Lyon site . . . 13
11 Global diagram without dead time for Grid’5000’s Lyon site . . . 14
12 Median resource diagram for Grid’5000’s Lyon site . . . 14
13 Maximal resource diagram for Grid’5000’s Lyon site . . . 15
14 Global diagram with dead time for Grid’5000’s Nancy site . . . 16
15 Global diagram without dead time for Grid’5000’s Nancy site . . . 17
16 Median resource diagram for Grid’5000’s Nancy site . . . 17
17 Maximal resource diagram for Grid’5000’s Nancy site . . . 18
18 Global diagram with dead time for Grid’5000’s Orsay site . . . 19
19 Global diagram without dead time for Grid’5000’s Orsay site . . . 20
20 Median resource diagram for Grid’5000’s Orsay site . . . 20
21 Maximal resource diagram for Grid’5000’s Orsay site . . . 21
22 Global diagram with dead time for Grid’5000’s Rennes site . . . 22
23 Global diagram without dead time for Grid’5000’s Rennes site . . . 23
24 Median resource diagram for Grid’5000’s Rennes site . . . 23
25 Maximal resource diagram for Grid’5000’s Rennes site . . . 24
26 Global diagram with dead time for Grid’5000’s Sophia site . . . 25
27 Global diagram without dead time for Grid’5000’s Sophia site . . . 26
28 Median resource diagram for Grid’5000’s Sophia site . . . 26
29 Maximal resource diagram for Grid’5000’s Sophia site . . . 27
30 Global diagram with dead time for Grid’5000’s Toulouse site . . . 28
31 Global diagram without dead time for Grid’5000’s Toulouse site . . . 29
32 Median resource diagram for Grid’5000’s Toulouse site . . . 29
References
[CCG+05] Nicolas Capit, Georges Da Costa, Yiannis Georgiou, Guillaume Huard, Cyrille
Martin, Grégory Mounié, Pierre Neyron, and Olivier Richard. A batch scheduler with high level components. In Cluster computing and Grid 2005 (CCGrid05), 2005.
[Cea05] F. Cappello et al. Grid’5000: A large scale, reconfigurable, controlable and monitorable grid platform. In 6th IEEE/ACM International Workshop on Grid Computing, Grid’2005, Seattle, Washington, USA, Nov. 2005.
[IDE+06] A. Iosup, C. Dumitrescu, D. Epema, Hui Li, and L. Wolters. How are real grids
used? the analysis of four grid traces and its implications. In 7th IEEE/ACM International Conference on Grid Computing, September 2006.
[OL09] Anne-Cécile Orgerie and Laurent Lefèvre. A year in the life of a large-scale experimental distributed system: usage of the Grid’5000 platform in 2007. INRIA Research Report 6965, INRIA, April 2009.
[OLG08a] Anne-Cécile Orgerie, Laurent Lefèvre, and Jean-Patrick Gelas. Chasing gaps between bursts : Towards energy efficient large scale experimental grids. In PDCAT 2008 : The Ninth International Conference on Parallel and Distributed Computing, Applications and Technologies, Dunedin, New Zealand, December 2008.
[OLG08b] Anne-Cécile Orgerie, Laurent Lefèvre, and Jean-Patrick Gelas. Save watts in your grid: Green strategies for energy-aware framework in large scale distributed systems. In 14th IEEE International Conference on Parallel and Distributed Systems (ICPADS), Melbourne, Australia, December 2008.
Unité de recherche INRIA Futurs : Parc Club Orsay Université - ZAC des Vignes 4, rue Jacques Monod - 91893 ORSAY Cedex (France)
Unité de recherche INRIA Lorraine : LORIA, Technopôle de Nancy-Brabois - Campus scientifique 615, rue du Jardin Botanique - BP 101 - 54602 Villers-lès-Nancy Cedex (France)
Unité de recherche INRIA Rennes : IRISA, Campus universitaire de Beaulieu - 35042 Rennes Cedex (France) Unité de recherche INRIA Rocquencourt : Domaine de Voluceau - Rocquencourt - BP 105 - 78153 Le Chesnay Cedex (France)