HAL Id: hal-01212360
https://hal.archives-ouvertes.fr/hal-01212360
Submitted on 6 Oct 2015
HAL is a multi-disciplinary open access
archive for the deposit and dissemination of
sci-entific research documents, whether they are
pub-lished or not. The documents may come from
teaching and research institutions in France or
abroad, or from public or private research centers.
L’archive ouverte pluridisciplinaire HAL, est
destinée au dépôt et à la diffusion de documents
scientifiques de niveau recherche, publiés ou non,
émanant des établissements d’enseignement et de
recherche français ou étrangers, des laboratoires
publics ou privés.
Is Web Content a Good Proxy for Real-Life Interaction?
Mark Kibanov, Martin Atzmueller, Christoph Scholz, Alain Barrat, Ciro
Cattuto, Gerd Stumme
To cite this version:
Mark Kibanov, Martin Atzmueller, Christoph Scholz, Alain Barrat, Ciro Cattuto, et al.. Is Web
Content a Good Proxy for Real-Life Interaction?. International Conference on Advances in Social
Networks Analysis and Mining, Aug 2015, Paris, France. �hal-01212360�
Is Web Content a Good Proxy for
Real-Life Interaction?
A Case Study Considering Online and Offline Interactions of Computer Scientists
Mark Kibanov, Martin Atzmueller,
Jens Illig, Christoph Scholz
KDE Group, ITeG, University of KasselWilhelmsh¨oher Allee 73 34121 Kassel, Germany {kibanov, atzmueller, illig,
scholz}@cs.uni-kassel.de
Alain Barrat
Aix Marseille Universit´eUniversit´e de Toulon CNRS, CPT, UMR 7332 13288 Marseille, France [email protected]
Ciro Cattuto
Data Science LaboratoryISI Foundation via Alassio 11/c 10126 Torino, Italy
Gerd Stumme
KDE Group, ITeG University of Kassel Wilhelmsh¨oher Allee 73 34121 Kassel, Germany [email protected]Abstract—Today, many people spend a lot of time online. Their social interactions captured in online social networks are an important part of the overall personal social profile, in addition to interactions taking place offline. This paper investigates whether relations captured by online social networks can be used as a proxy for the relations in offline social networks, such as networks of human face-to-face (F2F) proximity and coauthorship net-works. Particularly, the paper focuses on interactions of computer scientists in online settings (homepages, social networks profiles and connections) and offline settings (scientific collaboration, face-to-face communications during the conferences). We focus on quantitative studies and investigate the structural similarities and correlations of the induced networks; in addition, we analyze implications between networks. Finally, we provide a qualitative user analysis to find characteristics of good and bad proxies.
I. INTRODUCTION
With the success of the Web and the rise of social media, many people spend a significant fraction of their time online. This is particularly the case in academia, as online activi-ties can both correspond to work-related and private social networking. Online social relationship can then represent a significant share of an individual’s social profile, in addition to the interactions that take place offline, e. g., when meeting friends, during a face-to-face conversation, etc. So far, the analysis of online social networks has received significant attention in the research community, while studies on offline interactions at large scale, e. g., focusing on networks of face-to-face proximity, has only been taken up recently. Study-ing human behavior usStudy-ing social media comes with some caveats [24]: e. g., the responses of social media users differ from public opinion measured by surveys [21]. Therefore, detailed investigations of the connection between individuals’ offline and online interactions are needed. However, to the best of the authors’ knowledge, a combined analysis focusing on inter-relations and implications between these different information sources has not been addressed before.
This paper aims to start filling this gap by analyzing online and offline social networks and published content of computer scientists who visited particular conferences. In particular, we investigate whether information from various online sources
can be used as a proxy for the offline world. In order to answer this question, we proceed in three steps focusing on structural similarity, correlation, and implications of offline and online data. Basically, we investigate data structures and central parameters that are important for many applications, for example, for finding central actors, opportunistic forwarding, and for generating recommendations.
For conducting our analysis and experiments, we investigate different online and offline datasets concerning computer sci-entists: we collected face-to-face interactions that took place during several computer science conferences, i. e., at LWA 2010 [3], LWA 2011 [28], LWA 2012 [8] – organized by the german computer science society – and during ACM Hypertext 2011 [9]. Specifically, by providing the CONFERATOR
sys-tem [?] at these conferences we obtained offline interactions given by networks of human face-to-face proximity using RFID-technology developed by the SocioPatterns consortium. We also utilized a number of online resources and collected further data about the participants of these conferences: the content (full texts, abstracts, and titles) of their papers, the coauthorship networks based on DBLP information, their Re-search Gate profiles, and finally content from their homepages. The presented online and offline data and networks are not completely aligned by nature which makes the presented problem even more challenging and interesting.
For determining if (and when) online content is a good proxy for the offline world, we focus on different aspects and aim to answer the following research questions:
1) Are there strong structural similarities and correlations between the considered online and offline social networks w.r.t. link structure? (Q1)
2) Can we identify implications between online and offline networks and content? (i. e., concerning link structure and link importance, rankings, and (textual) content) (Q2) 3) Can we characterize classes of actors for which their
online connections act as good proxies for their offline interactions, i. e., derive specific conditions using network parameters and properties of these actors? (Q3)
Our results indicate that online and offline datasets show some proxy relations but there are also specific structural differences.
Specifically, strong ties seem to correlate more than weak ones and “important persons” tend to keep their high rank from the online to the offline worlds. However, these correlations are often not strong enough for conclusions on the offline world using online data in all cases.
The rest of the paper is structured as follows. Section II discusses related work. Then, we introduce basic definitions and concepts in Section III. After that, we describe our datasets in Section IV. Section V discusses the results of our experiments. Finally, Section VI concludes the paper with a summary and promising options for future work.
II. RELATEDWORK
The analysis of online and offline information, e. g., on-line social networks, co-authorship networks, co-location and networks of human face-to-face proximity is an interesting and challenging task in social network analysis and mining. Concerning human face-to-face contacts, the SocioPatterns collaboration developed an infrastructure that detects close-range and face-to-face proximity of individuals wearing RFID tags. This infrastructure has been deployed in various en-vironments for studying the dynamics of human contacts, e. g., at conferences [4], [11], [19], in schools [22], [29], museums [16] and workplaces [10], [26]. [4] analyzes the interactions and dynamics of the behavior of participants at conferences; the connection between research interests, roles and academic jobs of conference attendees is further analyzed in [19]. We extend these analysis focusing on offline and online information. Link relations and their prediction using different datasets (particularly, face-to-face contacts and DBLP data) is further analyzed in [12]. Also, [10], [26], [27] analyze survey data and networks of face-to-face proximity. A first analysis of online and offline networks has been performed in [7], however, focusing on the direction from offline to online data. In contrast, we focus on the reverse – investigating the use of online data as a proxy for offline interactions. Moreover, we extend the previous research made using face-to-face proximity data and discuss new insights about similarity of offline and online networks.
Further research has been done to identify the interdepen-dence of offline and online information and its possible appli-cations. [?] investigates different methods for the identification of finding real-life contacts based on Twitter data. [30] inves-tigates social networking of emerging adults’ and the relation between online and offline social networks (collected using self-report surveys). [?], [?], [?] explore how the Facebook communications refer to real-life relations, their strength and their changes. Further works consider the task of predicting friendship links in online social networks, e. g., given locations of users from social networks [14], or using time-/geo-tagged photos of the users [13]. [15] infers friendship network struc-ture (collected using surveys) by using mobile phone data. In contrast to these approaches, this paper focuses on the analysis of structural similarity, inter-relations, dependencies and implications between online and offline social networks. Specifically, we investigate whether the information captured by online social networks can be considered as a valid proxy for offline interactions, i. e., face-to-face proximity networks and scientific collaboration.
III. BACKGROUND
We use graphs for representation, analysis and comparison of social networks. To analyze the content (or text) data we use the bag-of-words model (cf. Section V-B3). We use subgroup discovery to identify and characterize different classes of actors (cf. Section V-C). Below, we summarize the main concepts. A. Graphs
We represent a network as a graph G = (V, E). A weighted graph is a graph G = (V, E) together with a function w : E ! R+ that assigns a positive weight to each edge. For
the adjacency matrix A 2 Rn⇥nwith n = |V | holds Aij= 1
(Aij= w(i, j)) iff (i, j) 2 E for i, j 2 V , assuming a bijection
from 1, . . . , n to V .
The density dens(G) of a graph G is the ratio of the number of edges and the number of possible edges, cf. [?]: dens(G) =
|E|
n(n 1)/2. The degree deg(i) of a node i in a network is the
number of connections it has to other nodes, i. e., deg(i) := |{j | Aij = 1}| . In weighted networks, we complement the
degree of a node i by its strength s(i) = PjAij, i. e., the
sum of the weights of the attached edges. The Eigenvector centrality (EV-centrality) [?] of a node is an important measure of its influence. The EV-centrality of node depends on the eigenvectors of its neighbors: a node is central, if it has many central neighbors. EV-centrality eig(i) of a node i is defined as follows: eig(i) = PjAijeig(j),where is a constant.
Besides standard statistical measures of correlation and ranking, we apply measures and tests commonly used in social network analysis for comparing graph structures:
• Jaccard Coefficient: For two Graphs G1= (V1, E1) and
G2 = (V2, E2) with V1 = V2, the Jaccard coeffient J
of the set of edges E1 and E2 is computed as follows:
J(E1, E2) = |E|E11\E[E22||.
• QAP test: The quadradic assignment procedure (QAP) test is a standard approach for comparing two graphs G1
and G2; it is based on estimating the correlation of the
re-spective adjacency matrices [17]. QAP tests a given graph level statistic, for example the graph covariance, against a QAP null hypothesis. QAP compares the observed graph correlation of (G1, G2) to the distribution of the respective
resulting correlation scores obtained on repeated random row/column permutations (corresponding to reshuffling of nodes) of the adjacency matrix of G2.
B. Bag-of-Words Model
For measuring the semantic similarity of pairs of docu-ments (e. g.,, web pages or scientific papers) – and thus of their authors – in Section V-B3, we make use of the vector space model (bag-of-words-model) of Information Retrieval [20]. Each term of the corpus gives rise to one dimension of a high-dimensional vector space. After applied stemming each document d is represented by a vector ~v, which at the dimension assigned to term t carries the value tf-idf(d, t) := tf(d, t) · log N
d(t) with tf(d, t) = maxf (d,t)t0f (d,t0), f(d, t) being
the number of occurrences of t in d, N being the total number of documents, and d(t) being the number of documents containing t at least once. The semantic similarity of two documents d1and d2is then measured by the cosine similarity
cosim(d1, d2) := cos\( ~v1, ~v2) := || ~v1||v~12·|| ~· ~v2v2||2.
C. Subgroup Discovery
Subgroup discovery, e. g., [1], [6], [31], aims at identifying subgroups of individuals (in our case actors in a social network, cf. Section V-C) that are interesting with respect to a certain target concept. For a binary target concept, for example, we are interested in large subgroups with a high share of individuals for which the target concept is true, e. g., indicating online linking behavior of certain actors (individuals).
A database D = (I, A) is given by a set of individuals I and a set of attributes A. For nominal attributes, a basic pattern (ai= vj)is a Boolean function I ! {0, 1} that is true if the
value of attribute ai 2 A is equal to vj for the respective
individual. The set of all basic patterns is denoted by ⌃. A subgroup description or (complex) pattern P is given by a set of basic patterns P = {p1, . . . , pl}, pi 2 ⌃, i = 1, . . . , l,
interpreted as a conjunction p1^ . . . ^ pl, with length(P) = l.
A pattern can thus also be interpreted as the body of a rule. The rule head then depends on the property of interest, e. g., for a binary target concept T on a basic pattern selT = true.
A subgroup SP := ext(P ) :={i 2 I|P(i) = true}, is the set
of all individuals that are covered by the subgroup description P. In a top-k setting, a subgroup discovery algorithm returns the top-k subgroups according to a selectable interestingness measure q : 2⌃! R , cf. [1]. For a binary target concept, e. g.,
the size n := ext(P) of a subgroup described by the pattern P, i. e., its support, and the share tP of the target concept
in the subgroup, i. e., its confidence, are combined by the interestingess measures qS as follows: qS(P ) = n· (tP t0),
where t0 denotes the (default) share of the target concept in
the database D, or by the Lift quality function qL(P ) = ttP0.
IV. DATASETS
We distinguish the data on two dimensions: First, we consider online and offline networks, as well as online and offline content data: We define online data as the data that were not available before the existence of the world wide web (WWW). In this paper, we use two online datasets: the ResearchGate network and homepages of computer scientists. In contrast, offline data represents connections and content whose existence do not specifically depend on the WWW, even if they can be enhanced by WWW-mediated communication now: for that, we consider face-to-face (F2F) interactions during academic conferences and scientific publications. The presented online data was collected from November 2014 till January 2015. The DBLP data was collected in January 2015. Second, we distinguish between network data (face-to-face interactions, follower relations in ResearchGate and scientific publications coauthorship) and content data (content of scientific publications, content of homepages and different attributes in ResearchGate system).
A. Offline: Face-to-Face Proximity
At the LWA 2010, LWA 2011, LWA 2012 conferences (or-ganized by the German Computer Science Society) as well as the ACM Hypertext 2011 conference, we invited participants to wear active RFID devices (proximity tags) that can detect the close-range (about 1.5 meters) face-to-face proximity of the individuals wearing them. This allows us to map out time-resolved networks of face-to-face contacts among the conference attendees.
As in [11], we record a face-to-face contact when the length of a contact is at least 20 seconds. A contact ends when the proximity tags do not detect each other for more than 60 seconds. For more information about the proximity sensing technology, we refer the reader to the web site of SocioPatterns1 . Table I shows high-level statistics of the
collected datasets. The duration of each LWA conference was three days, while the Hypertext conference took four days.
TABLE I: High level statistics for the F2F networks: Number of nodes |V | and edges |E|, average degree and strength (weighted degree; an edge e = (u, v) 2 E is weighted by the aggregated duration of all contacts between u, v 2 V ), diameter d, and density.
Network |V | |E| ?Deg. ?Str. d Density LWA 10 77 1004 26.08 20797.22 3 0.34 LWA 11 42 300 14.29 11655.24 3 0.35 LWA 12 44 354 16.09 14673.32 3 0.37 HT 11 69 550 15.94 8224.75 4 0.23
B. Offline: Scientific Publications
We collected all data from the DBLP co-authorship net-work2 in order to determine subgraphs for conference
partic-ipants. Furthermore, we also retrieved some additional data, e. g., the number of coauthors.
Moreover, we created a corpus of published papers for all 102 persons, who had at least one observed face-to-face (F2F) contact and a ResearchGate profile. We consider all publications listed on a person’s DBLP page. For that, we stored paper titles and, when available, also abstracts and full-texts. In total, we retrieved 4 466 titles, 2 420 abstracts and 2 604full-texts of 95 of the 102 persons.
In our subsequent analysis using the publication data, we focus on the set of 66 persons, for whom we were able to extract at least one full-text, at least one abstract and at least one title. For these 66 persons, the dataset contains 1 997 full-texts, 1 858 abstracts and 3 461 titles in total.
C. Online: Homepages
We searched for the homepages of researchers using the Google search engine, using first names and surnames (and the name of the institution if it was necessary) as search terms. The institution name was usually available from the conference proceedings. If researchers had changed their place of work since the conference, we tried to identify both the previous and the current homepages (if available). We considered two languages for the homepages, English and German, since the LWA workshops are visited mainly by German scientists. The Google PageRank was collected for the identified homepages using the Google API. We also used the API of Readability service 3to extract the page content. This services parses the
webpages and uses the modified arc90 algorithm4 to identify
the main content of the page.
1http://www.sociopatterns.org 2http://dblp.uni-trier.de
3https://readability.com/developers/api 4https://code.google.com/p/arc90labs-readability/
TABLE II: Count of items (nodes) in different networks and datasets overall and for particular conferences conferences: F2F – Face-to-face networks; RG – ResearchGate account (RG* – at least one discipline); DBLP – DBLP entry, P – persons with full-text papers, abstracts, and titles; HP – persons whose homepages were identified (and total number of homepages – some persons have websites in different languages or from different institutions).
F2F RG RG* DBLP HP RG\HP RG\DBLP DBLP\HP RG\DBLP\HP RG*\HP\P LWA 2010 77 50 39 58 56 (79) 42 44 53 41 36 LWA 2011 42 26 21 37 38 (49) 25 26 35 25 20 LWA 2012 44 25 23 36 39 (47) 25 24 35 24 22 HT 2011 69 31 19 55 52 (71) 26 29 45 25 15 Overall 189 102 74 146 145 (199) 88 93 128 85 66 D. Online: ResearchGate
Similarly to DBLP, we searched for ResearchGate-profiles of the scientists and used the native built-in ResearchGate search engine for this purpose. We collected the publicly avail-able profile information of the found users (e. g., institution, department), including information that can be considered as user ranking information (e. g., RG-Score, number of profile views etc.), information about their research (disciplines, topics and skills of users) and lists of their followers and followees. E. Data intersection
Overall more than half of the considered conference partic-ipants have a ResearchGate account (102 out of 189) and over two-thirds of them have DBLP entries (146 out of 189) and identified homepages (145 out of 190), cf. Table II. The total number of identified pages is 199 as some researchers have pages in different languages or from different institutions. Al-most 40% of all researchers have all three items (ResearchGate account, homepage and DBLP entry).
In order to conduct the experiments for inter-network comparisons, we filtered the data, obtaining a core network representation. Given two networks and their graph respre-sentations G1 = (V1, E1) and G2 = (V2, E2), the core
network for the G1network is represented by the graph G⇤1=
(V⇤
1, E1⇤), where V1⇤ = {v 2 V1|(v, u) 2 E2, u 2 V1} and
E⇤
1={(v, u)|(v, u) 2 E1, v, u2 V1⇤}. Therefore, we removed
all nodes that are not active in one of the networks, e. g., some conference participants who have ResearchGate accounts but do not have any connections with other conference participants in this online network are not included in the core network of the conference considering the ResearchGate network.
V. ANALYSIS
In our analysis below, we focus on the three research ques-tions introduced above, i. e., concerning structural similarities and correlation, implications between online and offline, and the characterization of good proxies.
A. Structure and Correlation (Q1)
For answering the first question Q1, we investigate struc-tural similarities of the online and offline data, comparing global network and edge properties. As expected, face-to-face networks are much denser than the other network sources, cf. Tables I). So, we used different contact thresholds (i. e., we kept only links if the duration of at least one face-to-face contact was longer than the considered threshold) to decrease
TABLE III: Networks size and density dependent on conversation threshold for different conferences.
F2F-Threshold (in sec): 20: 180: 300: LWA 2010 |V |dens(G) 770.34 740.15 720.11 LWA 2011 |V |dens(G) 420.35 390.15 390.10 LWA 2012 |V |dens(G) 440.37 420.17 380.14 HT 2011 |V |dens(G) 690.23 610.09 580.08
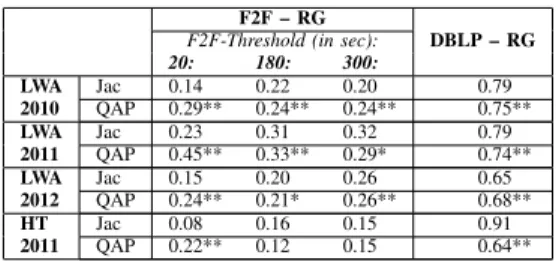
TABLE IV: Network correlation analysis: Jaccard co-efficient and results of QAP test for pairs of offline (Face-to-face proximity and DBLP-coauthorship) and on-line networks (ResearchGate) of participants of different conferences. Three thresholds for face-to-face proximity networks were considered: 20, 180 and 300 seconds. Values marked with “**” and “*” are significant at p 0.001 and p 0.05, respectively.
F2F – RG
F2F-Threshold (in sec): DBLP – RG 20: 180: 300: LWA Jac 0.14 0.22 0.20 0.79 2010 QAP 0.29** 0.24** 0.24** 0.75** LWA Jac 0.23 0.31 0.32 0.79 2011 QAP 0.45** 0.33** 0.29* 0.74** LWA Jac 0.15 0.20 0.26 0.65 2012 QAP 0.24** 0.21* 0.26** 0.68** HT Jac 0.08 0.16 0.15 0.91 2011 QAP 0.22** 0.12 0.15 0.64**
the density, as described in [?], cf. Table III. The number of active nodes was not reduced significantly in each case.
We compared the Jaccard coefficients of the offline and the online network’s cores regarding the edges, cf. Table IV. Moreover, we considered three different minimal contact thresholds for the face-to-face networks. We observe the trend, that the Jaccard similarity is higher for larger minimal contact thresholds, which may point to the fact that stronger ties in offline networks are better mapped in online networks. However, the values of the respective Jaccard coefficients range from 0.15 to 0.32, which does not seem sufficient to state that the two types of networks are very strongly correlated. This is also confirmed by the QAP-test analysis: while almost all correlations are significant, the correlation values themselves are only in a medium range, best for LWA 2010, worst for HT 2011. Furthermore, the Jaccard coefficient between the DBLP coauthorship network and the RG network is in all cases much higher than between the face-to-face proximity
and RG networks. This confirms the previous observation that the stronger the connection between two persons, the more likely the presence of the corresponding online connection; obviously, a coauthorship link represents a stronger connection than a conversation during a conference.
The answer to question Q1 can thus be summarized as follows: there exist structural similarities and correlations between offline and online networks. These similarities are much stronger if we consider DBLP instead of the face-to-face networks. Nevertheless, online data tends to act as a better proxy for stronger ties in the face-to-face network compared to all face-to-face interactions. This indicates that strong offline connections are more likely to be represented in online networks than weaker ones. Also, in the offline world, paper coauthorship, for example, is obviously a stronger connection than a conversation during a conference.
B. Implications – Online vs. Offline (Q2)
We investigate implications between the networks, focusing on the recurrance of edges of one network in another network, rankings, and the predictability of offline links given online content.
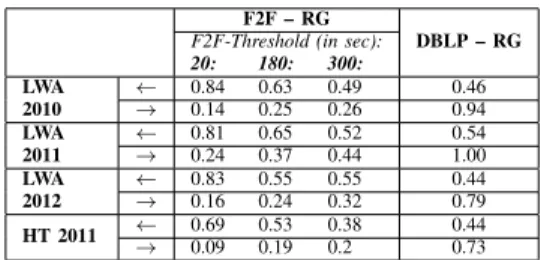
1) Implication between Sets of Edges: The implication of edges between different networks helps in further under-standing the networks’ nature, cf. Table V. The probability that two persons who are linked in ResearchGate also talk to each other during the LWA conference was pretty high – above 80% (69% for the Hypertext 2011 conference). The probability of two persons who are linked in ResearchGate being coauthors is very high as well – over 44%. In contrast, having a short conversation during the conference does not increase the chance for a link in the online world – the probability is below 24%. However, the longer the conversation is, the higher is the probability of the online link – up to 44% (for LWA 2011). The probability of a RG link between two persons in case they coauthored at least one paper is extremely high – 86% in average, up to 100% (for LWA 2011).
TABLE V: Implications: the probability of a link between two nodes in one network if it exists in another for offline (F2F and DBLP coauthorship) and online networks (ResearchGate) of participants of different conferences. We considered three contact thresholds (20, 180 and 300 seconds) for the F2F networks.
F2F – RG
F2F-Threshold (in sec): DBLP – RG 20: 180: 300: LWA 2010 ! 0.840.14 0.630.25 0.490.26 0.460.94 LWA 2011 ! 0.810.24 0.650.37 0.520.44 0.541.00 LWA 2012 ! 0.830.16 0.550.24 0.550.32 0.440.79 HT 2011 ! 0.690.09 0.530.19 0.380.2 0.440.73
2) Matching of Rankings: We aim to determine if the hierarchies of different online and offline worlds match each other. To answer this question we identify different features which reflect the “importance” or “influence” of persons in different worlds and compare the resulting ranks afterwards.
As different datasets represent different type of activities and have different nature, we identified different ranking strategies depending on networks properties:
• Face-to-face networks: the participants were ranked ac-cording to their eigenvector-centrality (cf. III-A) in each conference (graph); in case the person took part in more than one conference, the maximal EV-centrality was used. • DBLP: the persons with DBLP entries were ranked according to the number of their coauthors; the number of coauthors correlates with the number of publications and is a good sign of collaboration and visibility of a scientist.
• ResearchGate: ResearchGate profiles were ranked ac-cording to their RG-Score5 – a metric created by the
ResearchGate network to compute scientific reputation, based on three parameters: contribution, interaction and reputation.
• Homepages: The homepages of scientists were ranked according to their homepages’ Google PageRank; if re-searchers have different homepages, then the one with the highest PageRank value was chosen.
First, we computed the node rank correlation for all net-work pairs. The DBLP, ResearchGate and Homepage ranks correlate pairwise and the correlation is significant at p 0.001, cf. Table VI. The largest of all correlations is the correlation between the ResearchGate RG-Score and the DBLP number of coauthors, with a value of 0.68. However, the num-ber of papers and coauthors, respectively, are most probably used in the computation of the RG Score, so these metrics are not independent.
Surprisingly, the eigenvector centrality in the face-to-face proximity networks does not correlate with any of these metrics. We considered different centrality measures in the F2F-networks (such as number and lengths of contacts), with similar results (small negative non-significant correlation).
TABLE VI: Correlation of node ranks and intersection of the most important persons (for core (and whole) networks) based on different measures: F2F – based on eigenvector centrality, DBLP coauthorship – based on number of coauthors, ReserchGate network (RG) – based on RG-Score, network of webpages – based on global Google PageRank value.
DBLP RG HP F2F Correl.Intersec. 0.05 (0.05)0 0.15 (0.05)-0.07 0.22 (0.22)-0.01 DBLP Correl.Intersec. 0.65 (0.6)0.68 0.4 (0.4)0.49 RG Correl.Intersec. 0.48 (0.32)0.42
Furthermore, we identified the set of the top-ranked persons for each conference using each of the suggested rankings. We considered the top 5 persons obtained from different networks except for the homepage dataset. For that, we adjusted for ties when collecting the top persons according to their homepages’ pagerank. Then, we compared the top ranked nodes with each other. Particularly, we computed intersections for each pair
0.3 0.4 0.5 0.6 0.7 0.8 0.9 1 0 0.2 0.4 0.6 0.8 1 precision recall
homepages tfidf cos full papers tfidf cos abstracts tfidf cos titles tfidf cos ResearchGate disciplines tf cos random baseline 0.3 0.4 0.5 0.6 0.7 0.8 0.9 1 0 0.2 0.4 0.6 0.8 1 precision recall
homepages tfidf cos full papers tfidf cos abstracts tfidf cos titles tfidf cos ResearchGate disciplines tf cos random baseline
a b
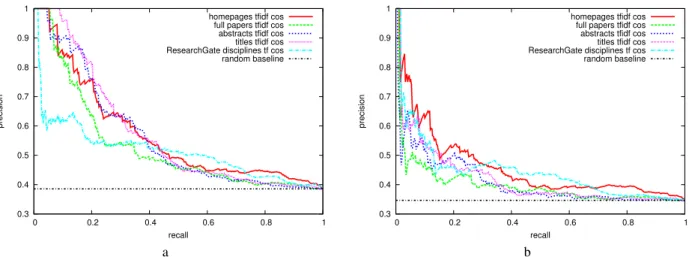
Fig. 1: Precision-recall curves for retrieving existing F2F links from paper, homepage, or RG data. Graph (a) is evaluated on all pairs of conference attendees for which all data is available. Graph (b) further disregards pairs of known coauthors.
of conferences, cf. Table VI. These intersections show how accurately it is possible to predict “important persons” in one network based on data from another network. We computed rankings for the both core and the complete networks. The results are similar to the rank correlation: the intersections between ResearchGate, DBLP and homepages rankings are higher than the intersections of the Face-to-Face proximity networks with each of these networks. However, the top-ranked persons from face-to-face networks are better predictable than we could suggest based on correlations between the rankings, cf. Table VI. Another interesting observation is that comparing the whole networks did not have a crucial influence on the results in most cases. This can be explained by the fact that “important persons” tend to be active in different networks, e. g., having different online and offline manifestations repre-senting their research profiles, interests and publications.
3) Online and Offline Content for Estimating F2F: We analyze the qualities of online and offline data for indicating the existence of face-to-face contacts. This task corresponds to the cold start link prediction problem [18] for social networks. Given online and offline data, our goal is to retrieve those pairs of conference co-attendees for which a face-to-face contact has been observed at a conference.
We rank all pairs of persons that co-attended a con-ference by the persons’ descending cosine-similarity in five different vectorspaces. We hypothesize, that we find many truly observed F2F contacts early in these rankings. For the first vectorspace, we represent persons by boolean vectors of their selected ResearchGate disciplines. For the second vectorspace, persons are represented by the sums of bag-of-words vectors built from all their homepages. The other three vectorspaces are based on the data of the persons’ publications. We tried bag-of-words vectorspaces from paper full-texts, only abstracts, and only titles. Each vector which represents a person is constructed by summing over the bag-of-words vectors of all the person’s publications or homepages. We applied stemming [23] and stopword removal to publication and homepage data.
We compare the predictive qualities of the rankings from each of these vectorspaces with respect to all four conferences. In particular, we apply microaveraging to the rankings of each vectorspace, i.e., we construct a single multi-conference cosine-ordered ranking for each vectorspace and use this ranking for evaluation. Each triple consists of a conference and two attendees of that conference and is mapped to either “observed” or “not observed” by the respective conference F2F-dataset. We concentrate on those 66 persons, for whom we have data in all of the five vectorspaces, i.e. we know at least one full-text, at least one abstract, at least one title, at least one RG discipline and at least one homepage. For these 66persons, the dataset contains 1997 full-texts, 1858 abstracts and 3 461 titles in total.
Figure 1a shows the precision and recall curves for retriev-ing truly observed F2F contacts. The graph indicates that none of the content networks is a good proxy for the face-to-face contact network. Intuitively, this can be explained by many other thinkable reasons to talk to each other aside from sim-ilar homepages, publications, or disciplines. Nevertheless, the comparison to the random baseline reveals that utilizing this information is clearly better than not knowing anything. Figure 1a further indicates that retrieving the observed F2F contacts among all pairs of conference co-attenders works comparably well using information from homepages, publication titles or abstracts. At low recall levels, title data yields slightly more precise results. Conversely, ResearchGate disciplines seem to be too broad concepts for achieving high-precision at low recall, but such information works relatively well at higher recall levels.
Because coauthors share publications, their publication based bag-of-words models naturally become more similar. This may also hold for homepages, which frequently contain publication lists. In a second evalutation setup, we examine to what extent the small amount of recall achieved with high precision in Figure 1a can be explained by highly ranked pairs of coauthors. Figure 1b is the result of an evaluation that disregards all coauthor pairs. The graph shows that the
TABLE VII: Examples of descriptions of subgroups of users that connect in Research Gate (RG) online, after at least one offline face-to-face (F2F) contact at a conference, and subgroups of users that do not connect.
# Target Subgroup Description Support Confidence Lift 1 Connection in RG Eigenvector centrality (F2F) > 0.28 (high) 0.21 1.00 1.42 2 Connection in RG At least one RG CS discipline and contact fraction > 46% 0.17 1.00 1.42 3 Connection in RG Number of DBLP coauthors > 67 (high) 0.22 0.96 1.36 4 Connection in RG Only RG CS disciplines and Google Pagerank > 3 0.32 0.86 1.22 5 Connection in RG At least one RG CS discipline 0.80 0.80 1.14 6 No RG Connection No RG CS disciplines and Eigenvector centrality (F2F) < 0.1 (low) 0.14 0.80 2.70 7 No RG Connection No RG CS disciplines 0.20 0.68 2.30 8 No RG Connection Number of RG views < 547 (low) 0.19 0.62 2.08 9 No RG Connection Number of RG publications < 10 (low) 0.22 0.54 1.82 10 No RG Connection Eigenvector centrality (F2F) < 0.1 (low) 0.50 0.46 1.56
accuracy of all models drops when coauthor pairs are not evaluated. Yet, the accuracies of the two models from online data drop less than those of paper based models. Homepage data works best for identifying F2F-contacts of non-coauthors. Even ResearchGate disciplines work slightly better than paper data on this subtask. An explanation could be that homepages and ResearchGate disciplines more concisely describe rough topics of research interests and that such interests are important features for guessing F2F contacts between non-coauthors. Furthermore, homepages are likely to be similar if they belong to the same institution and people from the same institution may be expected to talk to each other with increased proba-bility.
4) Summary: Concluding the analyses of Section V-B, it turned out that there is no definite answer as to whether links and ranks in online networks are good indicator for the existence of the corresponding links and ranks in the offline networks (Q2). Similar to Q1, we observed strong implications between the DBLP and the RG networks in Section V-B1. We also identified highly ranked (important) persons. However, the eigenvector centrality ranking of the face-to-face networks did not show any significant correlation with rankings from the other networks for generalizing these implications.
In Section V-B3, we considered cold start link prediction for the face-to-face networks, an example of a practical appli-cation of utilizing online information in order to infer offline relations. We found that information from all the networks can be used to find a small amount of the F2F contacts with high precision and most of the contacts with a clearly better precision than picking links randomly. Interestingly, we found that online data on homepages and in ResearchGate disciplines is better suited for discovering F2F links of non-coauthors than offline paper data.
C. Characteristics of Good Proxies (Q3)
In the following, we analyze features of actors in order to obtain descriptions of certain classes of actors which are good or bad proxies w.r.t. indicating online to offline interactions. We consider both the network and content data separately.
For the network data, we aim to characterize classes of actors for which online connections act as good (or bad) proxies for offline interactions. In particular, we perform the following experiment. We divide all persons who had at least one contact of face-to-face proximity during a given conference and a ResearchGate account into two groups: The first group are given by the persons who have at least one
connection in the RG network with another person who visited the conference (the person is a member of core network, cf. Section IV-E). The second group consists of the rest of conference participants – those who do not have connections with other participants in ResearchGate. Thus, we aim to characterize persons whose offline interactions are not dis-coverable online and vice versa. For that purpose, we applied subgroup discovery [1], [5] for identifying subgroups of actors that are characterized by certain descriptive features. We use descriptive information from the presented datasets in order to identify subgroups of users with properties as mentioned earlier, e. g., network centrality measures in the face-to-face contact networks, the Google PageRank of their homepages, and descriptive parameters extracted from their RG profiles. Exemplary results of our analysis are shown in Table VII.
In our analysis, we found interesting properties typical for one or another group. Persons with online connections, for example, have high eigenvector centrality in the face-to-face networks (row 1 in the table), high contact fraction with the participants of the conference (row 2), high number of DBLP coauthors (row 3) and high homepage PageRank (row 4). Therefore, the features which associate with importance and connectedness tend to characterize good proxies. This is in line with our conclusions for Q1 and Q2. Another interesting obser-vation is that computer scientists who visited the conferences tend to socialize more online than non-computer scientists who visited these conferences (rows 2, 5, 6, 7). Furthermore, online networks seem to be “bad proxies” for persons with a low eigenvector centrality (rows 6, 10). Also, a low number of RG views as well as a low number of publications (rows 8-9) are indicative.
We also analyzed the matching of the textual content of the homepages of individual scientists with the textual content of their papers. Therefore, we constructed binary variables (as target concepts) indicating a high/low similarity according to the cosine measure of the respective bag-of-word representa-tions. Here, we observe similar important features for good (and bad) proxies as discussed above, e. g., Google PageRank, the number of publications, or the selected ResearchGate disciplines.
Overall, the answer to question Q3 can be summarized as follows: in our analysis, we obtained some interesting properties that can explain the nature of proxies of different quality. We used subgroup discovery to obtain these properties in the form of characteristic descriptions. Alltogether, the presented insights and findings also correspond to the results of the previous experiments.
VI. CONCLUSIONS
In this paper, we analyzed online and offline social net-works and their content. We investigated whether information from online sources can be used as a proxy for the offline world, specifically for researchers in the area of computer science. Our results indicate that in many cases online and offline datasets still have structural differences at large. How-ever, strong ties seem to correlate better than weak ones and for “important persons” there are proxy relations between the online and the offline world. We also observed examples of a successful application of online data for offline scenarios, specifically relating to the analysis of content and characteristic subgroups. Our results show that the considered online data is not an ideal proxy for offline information overall, but still pro-vides some important indications about offline relationships.
In the future, we aim to analyze further relations between the presented and additional online (e. g., LinkedIn) and offline (e. g., Meetup.com) data. We also plan to consider time-based phenomena of network development. More and more ubiquitous systems and technologies are emerging, and this makes datasets with more participating persons and their com-munication in the physical world available. Furthermore, we aim to generalize the presented results (using larger networks and richer content data) for an extended modeling of the correspondence between online and offline social networks.
REFERENCES
[1] M. Atzmueller. Subgroup Discovery. WIREs: Data Mining and Knowledge Discovery, 1144, 2015.
[2] M. Atzmueller, D. Benz, S. Doerfel, A. Hotho, R. J¨aschke, B. E. Macek, F. Mitzlaff, C. Scholz, and G. Stumme. Enhancing Social Interactions at Conferences. it - Information Technology, 53(3):101–107, 2011. [3] M. Atzmueller, D. Benz, A. Hotho, and G. Stumme, editors.
Pro-ceedings of the LWA 2010 - Lernen, Wissen, Adaptivit¨at, Technical report (KIS), 2010-10. Department of Electrical Engineering/Computer Science, Kassel University, 2010.
[4] M. Atzmueller, S. Doerfel, A. Hotho, F. Mitzlaff, and G. Stumme. Face-to-Face Contacts at a Conference: Dynamics of Communities and Roles. In Modeling and Mining Ubiquitous Social Media, volume 7472 of LNAI. Springer, Berlin, 2012.
[5] M. Atzmueller and F. Lemmerich. VIKAMINE - Open-Source Sub-group Discovery, Pattern Mining, and Analytics. In Proc. European Conference on Machine Learning and Principles and Practice of Knowledge Discovery in Databases, volume 7524 of LNCS, pages 842– 845, Berlin, 2012. Springer.
[6] M. Atzmueller, F. Lemmerich, B. Krause, and A. Hotho. Who are the Spammers? Understandable Local Patterns for Concept Description. In Proc. 7th Conference on Computer Methods and Systems, Krakow, Poland, 2009. Oprogramowanie Nauko-Techniczne.
[7] A. Barrat, C. Cattuto, M. Szomszor, W. V. den Broeck, and H. Alani. Social Dynamics in Conferences: Analyses of Data from the Live Social Semantics Application. In Proceedings Intl. Semantic Web Conference, volume 6497 of Lecture Notes in Computer Science, pages 17–33, 2010. [8] H. Blom and N. Piatkowski, editors. Proceedings of the LWA 2012
-Lernen, Wissen, Adaptivit¨at. Technical University Dortmund, 2012. [9] P. D. Bra and K. Grønbæk, editors. HT’11, Proceedings of the
22nd ACM Conference on Hypertext and Hypermedia, Eindhoven, The Netherlands, June 6-9, 2011, New York, NY, USA, 2011. ACM. [10] C. Brown, C. Efstratiou, I. Leontiadis, D. Quercia, and C. Mascolo.
Tracking Serendipitous Interactions: How Individual Cultures Shape the Office. In Proc. CSCW, pages 1072–1081, New York, NY, USA, 2014. ACM Press.
[11] C. Cattuto, W. Van den Broeck, A. Barrat, V. Colizza, J.-F. Pinton, and A. Vespignani. Dynamics of Person-to-Person Interactions from Distributed RFID Sensor Networks. PLoS ONE, 5(7):e11596, 07 2010.
[12] Christoph Scholz and Martin Atzmueller and Alain Barrat and Ciro Cattuto and Gerd Stumme. New Insights and Methods For Predicting Face-To-Face Contacts. In Proc. ICWSM, Palo Alto, CA, USA, 2013. AAAI Press.
[13] D. J. Crandall, L. Backstrom, D. Cosley, S. Suri, D. Huttenlocher, and J. Kleinberg. Inferring social ties from geographic coincidences. Proceedings of the National Academy of Sciences, 107(52):22436– 22441, 2010.
[14] J. Cranshaw, E. Toch, J. Hong, A. Kittur, and N. Sadeh. Bridging the Gap Between Physical Location and Online Social Networks. In Proc. Ubicomp, pages 119–128, New York, NY, USA, 2010. ACM Press. [15] N. Eagle, A. S. Pentland, and D. Lazer. Inferring friendship network
structure by using mobile phone data. Proceedings of the National Academy of Sciences, 106(36):15274–15278, 2009.
[16] L. Isella, J. Stehl´e, A. Barrat, C. Cattuto, J.-F. Pinton, and W. V. den Broeck. What’s in a Crowd? Analysis of Face-to-Face Behavioral Networks. CoRR, 1006.1260, 2010.
[17] D. Krackhardt. QAP Partialling as a Test of Spuriousness. Social Networks, 9:171–186, 1987.
[18] V. Leroy, B. B. Cambazoglu, and F. Bonchi. Cold start link prediction. In Proceedings of the 16th ACM SIGKDD International Conference on Knowledge Discovery and Data Mining, pages 393–402, Washington, DC, USA, July 25-28, 2010. ACM.
[19] B.-E. Macek, C. Scholz, M. Atzmueller, and G. Stumme. Anatomy of a Conference. In Proc. Hypertext, pages 245–254, New York, NY, USA, 2012. ACM Press.
[20] C. Manning and H. Schuetze. Foundations of Statistical Natural Language Processing. MIT Press, 1999.
[21] A. Mitchell and P. Hitlin. Twitter reaction to events often at odds with overall public opinion. Mar. 2013. http://www.pewresearch. org/2013/03/04/twitter-reaction-to-events-often-at-odds-with-overall-public-opinion/, visited on 2015-01-23.
[22] M. C. Pachucki, E. J. Ozer, A. Barrat, and C. Cattuto. Mental Health and Social Networks in Early Adolescence: A Dynamic Study of Objectively-Measured Social Interaction Behaviors. Social Science and Medicine, 2014.
[23] M. Porter. An algorithm for suffix stripping. Program, 14(3):130–137, 1980.
[24] D. Ruths and J. Pfeffer. Social media for large studies of behavior. Science, 346(6213):1063–1064, 2014.
[25] L. Sachs. Applied Statistics. Springer, Berlin, 1982.
[26] K. Sailer, R. Pachilova, and C. Brown. Human versus Machine -Testing Validity and Insights of Manual and Automated Data Gathering Methods in Complex Buildings. In Proc. 9th Intl. Space Syntax Symp., Seoul, Korea, 2013. Sejong Univ. Press.
[27] T. Smieszek, V. Barclay, I. Seeni, J. Rainey, H. Gao, A. Uzicanin, and M. Salathe. How should social mixing be measured: comparing web-based survey and sensor-based methods. BMC Infectious Diseases, 14(1):136, 2014.
[28] M. Spiliopoulou, A. N¨urnberger, and R. Schult, editors. Proceedings of the LWA 2011 - Lernen, Wissen, Adaptivit¨at. Computer Science Faculty, Magdeburg University, 2011.
[29] J. Stehl´e, N. Voirin, A. Barrat, C. Cattuto, L. Isella, J. Pinton, M. Quag-giotto, W. Van den Broeck, C. R´egis, B. Lina, and P. Vanhems. High-Resolution Measurements of Face-to-Face Contact Patterns in a Primary School. PLOS ONE, 6(8):e23176, 08 2011.
[30] K. Subrahmanyam, S. M. Reich, N. Waechter, and G. Espinoza. Online and Offline Social Networks: Use of Social Networking Sites by Emerging Adults. Journal of Applied Developmental Psychology, 29(6):420 – 433, 2008.
[31] S. Wrobel. An Algorithm for Multi-Relational Discovery of Subgroups. In Proc. 1st European Symposium on Principles of Data Mining and Knowledge Discovery (PKDD-97), pages 78–87, Berlin, 1997. Springer.