HAL Id: hal-02916223
https://hal.archives-ouvertes.fr/hal-02916223
Submitted on 18 Dec 2020
HAL is a multi-disciplinary open access
archive for the deposit and dissemination of
sci-entific research documents, whether they are
pub-lished or not. The documents may come from
teaching and research institutions in France or
abroad, or from public or private research centers.
L’archive ouverte pluridisciplinaire HAL, est
destinée au dépôt et à la diffusion de documents
scientifiques de niveau recherche, publiés ou non,
émanant des établissements d’enseignement et de
recherche français ou étrangers, des laboratoires
publics ou privés.
Rapid reconstruction of paleoenvironmental features
using a new multiplatform program
Roberto Therón, Didier Paillard, Elsa Cortijo, José-Abel Flores, Maria
Vaquero, Francisco Javier Sierro, Claire Waelbroeck
To cite this version:
Roberto Therón, Didier Paillard, Elsa Cortijo, José-Abel Flores, Maria Vaquero, et al.. Rapid
re-construction of paleoenvironmental features using a new multiplatform program. Micropaleontology,
Micropaleontology Press, 2004, 50 (4), pp.391-395. �10.2113/50.4.391�. �hal-02916223�
Rapid reconstruction of paleoenvironmental features using a
new multiplatform program
Roberto Therón
1, Didier Paillard
2, Elsa Cortijo
2, José-Abel Flores
3, María Vaquero
1,
Francisco Javier Sierro
3and Claire Waelbroeck
21Departamento de Informática y Automática, Universidad de Salamanca, Salamanca, 37008, Spain 2
Laboratoire des Sciences du Climat et de l’Environnement,
Unité Mixte de Recherche CEA-CNRS, F-91198 Gif-sur-Yvette Cedex, France
3
Departamento de Geología, Universidad de Salamanca, Salamanca, 37008, Spain
email: [email protected]
ABSTRACT: As a symptom of evolution, human beings are always trying to better understand current and past events so as to be able to foresee future situations. In order to do that the development of new tools and/or methods is a must. Currently, the Modern Analog Tech-nique (MAT) is one of the most used techTech-niques in paleoceanography and it is applied for the quantitative reconstruction of environmen-tal conditions of the past. Here we propose a new tool, PaleoAnalogs, a method that combines the MAT technique with an interactive analysis to produce faster and more accurate down core reconstructions of (i.e.) sea surface temperature. The tool is tested here using planktonic foraminifers from Pleistocene sediments in the Mediterranean sea, where a well-build data-base is available. PaleoAnalogs is programmed with flexibility in order to enable the use of this technique for different micropaleontological groups and it is available for any operating system.
INTRODUCTION
Over the last years we have witnessed how the claim of society for accurate climate prediction has increased; therefore, the cli-mate predictability has emerged as one of the most powerful ar-eas of research. Two approaches may be used: (1) the development of new methods that will provide best-guess pre-dictions and, (2) a better understanding of the climate changes in the past that will lead to a more accurate ability of prediction. Along with atmospheric and land processes, ocean dynamics modelling is essential for predicting the impact of climatic change on human activities and vice versa. A crucial point is to provide quantitative data to reconstruct oceanographic parame-ters to monitor rapid and drastic climate changes.
The information accumulated over thousands of years (mainly in ice and sediment cores) is an impressive source of data that, for instance, help us to model earth and ocean dynamics (Theron et al. 2002), which is the first step to make climatic predictions. When looking for historic climatic data with dura-tions exceeding decades, the largest and oldest record is found in the oceans. Palaeoceanographers need to manipulate, inte-grate and analyze time-series that are obtained from a number of independent techniques (such as ocean drilling, ocean trac-ers, AMC14C datings, astronomic curves, etc.), which,
more-over, are usually produced by different researchers and/or laboratories.
Some of these data that are needed to understand paleoclimate are time-series of specific attributes related to the oceans. Thus, one problem scientists must face is how to know environmental parameters, such as sea surface temperature (SST), that were present at each given past moment. For the reconstruction of these features, isotope measurements (d18O) or biomarkers
(Uk
37index) have been used. Some works (Dowsett and
Robin-son 1998) suggest that isotopic estimates of temperature must be viewed with some degree of uncertainty (ice volume history,
for instance). Gratefully, other independent techniques, based on microfossil assemblages, offer the possibility to obtain paleoenvironmental reconstructions.
Beginning in the 1970s with CLIMAP (1976, 1981, 1984), paleooceanographers have been trying to derive quantitative es-timates using the distribution of fossil foraminifers present in the sedimentary record. After that, some better approaches have arisen, making the Modern Analog Technique, MAT (Hutson 1980) a standard method in paleoceanography.
The goal of this contribution is to show how the development of
ad hoc software tools can improve both the quality and time
consumption for obtaining the results that standard techniques in the field, like MAT, provide.
BACKGROUND
As has been stated before, paleoceanographers have been trying to derive quantitative estimates of climatic parameters from the sedimentary record. In general, the procedure is to observe the modern distribution of some component of surface sediments that depends on climate, find an empirical relationship between climate and the character of the sediments, and then extrapolate past climate by studying older sediments in the same way (Schweitzer 1994).
The first attempt to find an empirical relationship between past climate and components of the sediment was proposed by Imbrie and Kipp (1971); in that work, sea-floor sediments were examined to determine the percentage of various species of planktonic foraminifers present in them. The key element was the assumption that the distribution of foraminiferal assem-blages depended strongly on the extremes of annual SST. Thus, foraminiferal assemblages, decomposed with the standard sta-tistical method of Q mode principal component analysis, were studied, using a multiple regression technique, against the
age SST during the coolest and warmest seasons. These ideas lead to the development of the Transfer Function Technique that produces a set of transfer functions, i.e., equations that can be used to estimate cool and warm SST from the faunal compo-sition of a sediment sample.
Hutson (1980) developed an alternative approach, MAT, which does not generate a unique calibration formula between faunal data and physical properties. Instead, this method searches the data base of modern faunas for samples with assemblages that most resemble the fossil assemblage. The environment repre-senting the fossil sample is then reconstructed from the physical properties recorded in the best modern analog samples. In the original work of Hutson (1980), a cosine-theta distance was used to match modern and fossil samples. Later, in Overpeck et al. (1985), eight dissimilarity coefficients were tested to assess how they responded to differences among mod-ern pollen samples. In this study, it was suggested that, whereas all coefficients yielded congruent results, signal-to-noise
per-formed better than unweighted or equal-weight dissimilarity co-efficients. Furthermore, a squared chord distance was pointed out as the best choice, making this dissimilarity coefficient a standard in later works.
In the last years, some improvements of MAT have arisen with the introduction of SIMMAX (Pflaumann et al. 1996) and RAM (Waebroeck et al. 1998), and recently, artificial neural networks (ANNs) have been used for estimating past SST from plank-tonic foraminifer census data (Malmgren et al. 2001).
PROCEDURE
PaleoAnalogs: finding modern analogs
PaleoAnalogs is a Java-based program (available at http:// paleosofttools.usal.es), designed to process the method of mod-ern analogs. It is assumed that the user has faunal census esti-mates of one or more fossil samples, the core file, and one or more sets of faunal data from modern samples with the related environmental features, the database file. Furthermore, the user
392
Roberto Therón: Rapid reconstruction of paleoenvironmental features using a new multiplatform program
TEXT-FIGURE 1
Recognition of analogs. A, B, C, Aa, Ab, C’ and D are names of species; Env is the environmental feature (i.e. SST); Db1, Db2 and Db3 are database samples whereas Co1 and Co2 are core samples; #1, #2 and #3 are the ordinal numbers of the analogs for each core sample.
must understand the taxonomic categories represented in the data sets, and be able to recognize taxa that are or may be con-sidered equivalent in the analysis.
The process begins after the selection of the core and database files (text-figure 1); in general, these files will contain different taxa, both because different taxa are prevalent in different re-gions and because data providers use varying taxonomic cate-gories (species and subspecies), names, and abbreviations. In the example of text-figure 1, Aa and Ab are subspecies of the species A, while B and D are different names for the same spe-cies (C and C’ represent the case where different abbreviations are used). MAT requires that corresponding variables in differ-ent data sets be recognizable as such, otherwise it would be im-possible to calculate the distance measures. As it can be seen in figure 1, only after the database and the core files contain equiv-alent taxa, the dissimilarity computation can be done (diss1-1 is the calculated distance or dissimilarity coefficient between core sample Co1 and database sample Db1; diss1-3 is the distance between core sample Co1 and database sample Db3 and so on). Other tools, like ANALOG (Schweitzer 1994), solve this prob-lem trough the use of complex files of transformation rules. PaleoAnalogs features the taxa association wizard (figure 2). With the help of this wizard the problem is easily worked out, allowing the user to determine which taxa from each modern and fossil data file are compared, calculate proportions if needed, and identify the environmental features. For instance, using the taxa association wizard in figure 2 the name RUBR
(Globigerinoides ruber) is used for both the database and the core samples. For the example given in figure 1, the association wizard would permit to add the data of species Aa and Ab in the core and associate the result with the species A in the database by simply selecting the three names and pushing the third arrow button on the left (text-figure 2).
Once the database and the core data are transformed to have the same number of equivalent taxa, each sample in the core is com-pared with each sample in the database using a dissimilarity co-efficient. PaleoAnalogs provides the user with the choice of distance measure among the eight coefficients studied in Overpeck et al. (1985); this is particularly interesting, because since that work, most of the paleoceanographers do use only the squared chord distance because it is the unique distance offered in the program they have (Waelbroeck et al. 1998) and it has be-come the de facto standard. However, it can be very beneficial to compare the results obtained using different coefficients. Finally, using the distance measure selected by the user, a dis-similarity matrix (text-figure 3) is built. For each core sample (column 1), N dissimilarity values are given, N being the num-ber of samples in the modern database; these values are ordered increasingly so that each row of the matrix contains, left-to-right, the list of the N best analogs, that is, the database samples ordered by their likeness to that particular core pattern. For instance, figure 3 shows the application of this technique for a particular case: this table exhibits the dissimilarity matrix for planktonic foraminifer assemblages identified in core MD95-2043 (Alboran Sea –Western Mediterranean- 36º8' 598"N; 2º37'269"W; 1841 m water depth) using the Kallel et al. (1997) database. Each row corresponds to a sample taken at a given depth (0, 10, 20...) in the core sediment section. Each cell of the matrix shows a dissimilarity value and the name of the
as-Micropaleontology, vol. 50, no. 4, 2004
TEXT-FIGURE 2 Taxa association wizard
TEXT-FIGURE 3
Dissimilarity matrix for core MD95-2043. On the first column core sam-ples are presented. Following columns contain the ordered set of analogs for each core sample. Each cell includes the dissimilarity value and the label of the site for that particular analog.
sociated database sample. The best analog for each sample is the one that presents the dissimilarity value closest to zero. The next step in MAT is to reconstruct the environmental con-ditions of each core sample based on the environmental data of a number of best analogs (generally ten, although PaleoAnalogs permits the use of any number of analogs). This can be done by calculating the average value of the paleovariable to be recon-structed or by weighting the analogs (the closer an analog is the more similar the reconstructed value should be to it). However, this is somehow very strict, because it could happen that some of the used analogs were not valid (from a geologic point of view) so that they should not be used to reconstruct the paleovariable. This is the reason why an interactive analysis can be a powerful aid.
PaleoAnalogs: interactive analysis and recontructing pa-rameters
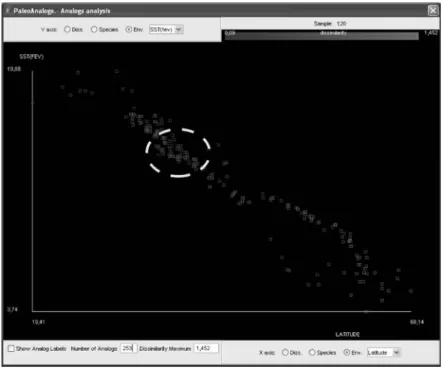
By clicking on a row of the dissimilarity matrix (text-figure 3) a 2D-plot for that core sample is shown. Text-figure 4 corre-sponds to the analogs distribution for the core sample ‘120’. This representation is enriched by adding colors (blue-to-red) covering the range of dissimilarity values for the core sample’s analogs.
On each axis one of three categories, dissimilarity values, spe-cies or environmental features, can be represented.
These 3-dimensional plots will help paleceanographers to gain a better understanding of the recontructions they are perform-ing. For instance, figure 4 illustrates a February tempera-ture/Latitude/Dissimilarity plot; it shows how the best analogs for core sample ‘120’ are concentrated to latitudes between 32º and 37º and temperatures between 11.5ºC and 13ºC, approxi-mately (blue colored boxes, inside the dotted circle in figure 4).
Also, this representation can be made for a selected number of analogs or for those with dissimilarity values smaller than a pre-set cut-off. Analogs can be labelled with the associated database sample name, which might be of help when showing small number of analogs (e.g., the analogs that will be used to esti-mate the temperature for a particular sample).
As a final step, the paleovariable reconstruction is performed. Figure 5 shows the SST reconstructed using the 10 best analogs for each sample in core MD2043 (warm- and cold-season esti-mates are considered in this example). Each reconstructed vari-able is accompanied by a standard deviation value in order to provide the palaeontologists with a precise measure of the accu-racy in the reconstruction.
CONCLUSIONS AND FUTURE WORK
This work is an example of how pattern recognition can be a valuable tool in the paleoclimatology field. Thanks to it, recon-structions of paleonvironmental conditions can gain in feasibil-ity, simplicity and expeditiousness. However, a means of better understanding of the reconstruction process must be estab-lished; this can be accomplished by an interactive analysis of the patterns (analogs) found .
Future improvements of PaleoAnalogs may include addition of other micropaleontologic fossil groups; assess the results in comparison with biogeochemical techniques; addition of more standard methods in the field (RAM, ANNs, etc.); consideration of time as a fourth dimension in the interactive analysis; and de-velopment and validation of new methods that include data mining techniques.
ACKOWLEDGMENTS
The authors whish to express thanks to Dr. Björn Malmgren and Dr. Harry Dowsett for their valuable suggestions and critical comments on this work.
394
Roberto Therón: Rapid reconstruction of paleoenvironmental features using a new multiplatform program
TEXT-FIGURE 4
This study was supported by the Spanish projects CL98-1002-CO2-02, REN2002-11126-E/ANT and REN2003-0842-CO2-02.
REFERENCES
CLIMAP Project Members, 1976. The surface of the ice-age Earth.
Sci-ence, 191: 1131-1144.
CLIMAP Project Members, 1981. Seasonal reconstruction of the Earth’s surface at the last glacial maximum. Geological Society of
America, Map and Chart Series, MC-36: 1-18.
CLIMAP Project Members, 1984. The last interglacial ocean.
Quater-nary Research, 21:123-224 .
DOWSETT, H.J., and ROBINSON, M.M., 1998. Application of the Modern Analog Technique (MAT) of Sea Surface Temperature Esti-mation to Middle Pliocene North Pacific Planktonic Foraminifer As-semblages. Palaeontologia Electronica, 1(1): 22 pp., 8.1MB. {http://palaeo-electronica.org/1998\_1/dowsett/issue1.htm} HUTSON, W. H., 1980. The Agulhas Current during the Late
Pleisto-cene: Analysis of modern faunal analogs. Science, 207: 64-66. IMBRIE, J. and KIPP, N.G., 1971. A new micropaleontological method
for paleoclimatology: Application to a Late Pleistocene Caribbean core. The Late Cenozoic Glacial Ages. New Haven:Yale University Press, 71-81.
KALLEL, N., PATERNE, J.C., DUPLESSY, C., VERGNAUD-GRAZZINI, C., LABEYRIE, M. ARNOLD, M., FONTUGNE, M. AND Pierre, c., 1997. Enhanced rainfall in the Mediterranean region during the last sapropel event. Oceanologica Acta 20:697-712.
M A L M G R E N , B . A . , K U C E R A , M . , N Y B E R G , J . a n d WAELBROECK, C., 2001. Comparison of statistical and artificial neural network techniques for estimating past sea surface tempera-tures from planktonic foraminifer census data. Paleoceanography 16 (5):520-530.
OVERPECK, J.T., WEBB, T. and PRENTICE, I.C., 1985. Quantitative interpretation of fossil pollen spectra: Dissimilarity Coefficients and the method of modern analogs. Quaternary Research, 23: 87-108. PFLAUMANN, U., DUPRAT, J., PUJOL, C. and LABEYRIE, L.,
1996. SIMMAX: A modern analog technique to deduce Atlantic sea surface temperatures from planktonic foraminifera in deep-sea sedi-ments. Paleoceanography 11:15-35.
THERON, R., FLORES, J. A., SIERRO, F. J., PELEJERO, C., GRIMALT, J. and VAQUERO, M., 2002. Using Data Mining and Visualization Techniques for the Reconstruction of Ocean Paleodynamics. Proceedings of the IEEE International Geoscience
and Remote Sensing Symposium, IV: 2382-2384.
SCHWEITZER, P. N., 1994. ANALOG: A program for estimating paleoclimate parameters using the method of modern analogs. U. S.
Geological Survey Open-File Report 94-645.
WAELBROECK, C., LABEYRIE, L., DUPLESSY, J.C., GUIOT, J., LABRACHERIE, M., LECLAIRE, H. and DUPRAT, J. 1998. Im-proving past sea surface temperature estimates based on planktonic fossil faunas. Paleoceanography 13 (3): 272-283.
Manuscript received October 5, 2003 Manuscript accepted July 20, 2004
Micropaleontology, vol. 50, no. 4, 2004
TEXT-FIGURE 5