Publisher’s version / Version de l'éditeur:
Proceedings of the 20th International Conference on Port and Ocean Engineering under Arctic Conditions June 9-12, 2009 Luleå, Sweden, 2009
READ THESE TERMS AND CONDITIONS CAREFULLY BEFORE USING THIS WEBSITE.
https://nrc-publications.canada.ca/eng/copyright
Vous avez des questions? Nous pouvons vous aider. Pour communiquer directement avec un auteur, consultez la
première page de la revue dans laquelle son article a été publié afin de trouver ses coordonnées. Si vous n’arrivez pas à les repérer, communiquez avec nous à [email protected].
Questions? Contact the NRC Publications Archive team at
[email protected]. If you wish to email the authors directly, please see the first page of the publication for their contact information.
NRC Publications Archive
Archives des publications du CNRC
This publication could be one of several versions: author’s original, accepted manuscript or the publisher’s version. / La version de cette publication peut être l’une des suivantes : la version prépublication de l’auteur, la version acceptée du manuscrit ou la version de l’éditeur.
Access and use of this website and the material on it are subject to the Terms and Conditions set forth at
Multi-year ice thickness: knowns and unknowns
Johnston, M.; Masterson, D.; Wright, B.
https://publications-cnrc.canada.ca/fra/droits
L’accès à ce site Web et l’utilisation de son contenu sont assujettis aux conditions présentées dans le site
LISEZ CES CONDITIONS ATTENTIVEMENT AVANT D’UTILISER CE SITE WEB.
NRC Publications Record / Notice d'Archives des publications de CNRC:
https://nrc-publications.canada.ca/eng/view/object/?id=15b81ab8-4582-4272-9f8c-ff99f9c09cba https://publications-cnrc.canada.ca/fra/voir/objet/?id=15b81ab8-4582-4272-9f8c-ff99f9c09cba
POAC09-120
MULTI-YEAR ICE THICKNESS: KNOWNS AND UNKNOWNS
M. Johnston1, D. Masterson2 and B. Wright3
1
Canadian Hydraulics Centre, National Research Council of Canada, Ottawa, CANADA
2
Chevron Canada Resources, Calgary, CANADA
3
B Wright & Associates, Canmore, CANADA
ABSTRACT
Nearly 5000 direct measurements of multi-year ice thickness, compiled from studies spanning a period of 51 years, are used to identify some of the “knowns and unknowns” surrounding multi-year ice. Many of these studies reside in the grey literature, which makes this paper one the few in the open literature to include data from these not-often-seen reports. Individual thickness measurements on multi-year ice suggest that floes from the Beaufort, Central Canadian Arctic, High Arctic and Sverdrup Basin are of comparable thickness. The thickest multi-year ice, 40.2 m, was measured on a pressure ridge in the Canadian Beaufort. On average, the mean thickness is 5.6 m (±2.2 m) for a relatively level multi-year floe and 9.9 m (±4.7 m) for a pressure ridge. Floes with a mean thicknesses of 11.3 m, and pressure ridges with a mean thickness of 24.7 m have been measured, however.
INTRODUCTION
Multi-year ice, because of its thickness and strength, represents one of the most significant design and operational concerns for future exploration, development and shipping systems in the Beaufort Sea. The importance of multi-year ice was recognized in the late 1960s and 70s when offshore activities first began in the Beaufort Sea. The three caisson structures that operated in different areas of the Beaufort (Molikpaq, Caisson Retained Island - CRI and Single Steel Drilling Caisson - SSDC) were all designed to withstand impacts with multi-year ice. The Molikpaq did experience impacts with multi-year ice while at the Tarsuit P-45 (1984/85) and Amauligak I-65 (1985/86) sites – interactions that resulted in the highest ice-induced global loads yet measured on a structure. Today, the search for oil and gas is beginning to venture into deeper waters of the Canadian Beaufort Sea, where polar pack ice is not uncommon, while some consideration is now being given to year-round shipping in the general region.
This paper focuses on multi-year ice thickness, which is just one of the many unknowns surrounding multi-year ice. Ice thickness, and its variation in spatial extent, are perhaps the most critical unknowns because they influence the loaded area and the ice failure mode. That, in turn, governs local and global loads on a structure. Local ice pressures are of course influenced by the thickest ice encountered, but global loads are the result of the integration of ice thicknesses over extended areas.
POAC 09
Luleå, Sweden
Proceedings of the 20th International Conference on
Port and Ocean Engineering under Arctic Conditions June 9-12, 2009 Luleå, Sweden
Many studies have focussed on multi-year ice over the years, nevertheless our knowledge of its thickness is still lacking. An understanding of multi-year ice is viewed as fundamentally important input for the planning of future activities in the deeper waters of the Beaufort Sea, especially given widespread reports of the shrinking polar ice cap and diminishing ice thickness. It is hoped that this paper, by summarizing thicknesses measured on multi-year floes across the Arctic over a period of 50 years, will make a significant and timely contribution to the literature – particularly in light of heightened interest in the Beaufort Sea.
TWO EXTREMES OF MULTI-YEAR ICE: LEVEL AND DEFORMED ICE
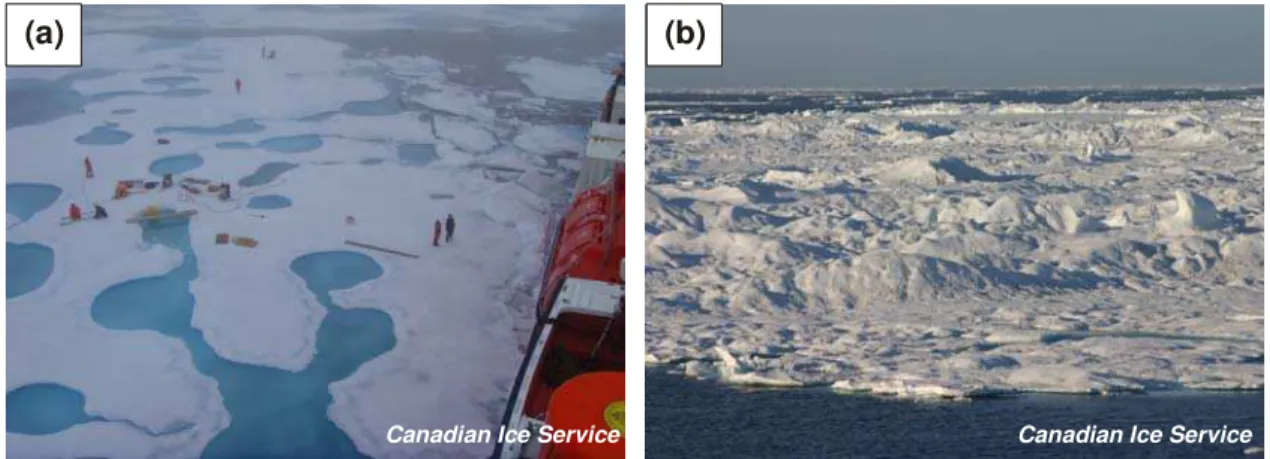
Figure 1 shows two very different multi-year floes encountered by Canadian Coast Guard icebreakers operating in the Beaufort Sea during the summer of 2005. Photograph (a) shows the very level surface of what is likely a young multi-year floe, about 2 to 3 m thick. Photograph (b) shows an extremely deformed multi-year floe. The deformed floe is commonly what comes to mind when thinking of “multi-year ice”, with its hummocked topography produced by years of deformation and melt.
One only has to look at photographs in Figure 1 to immediately understand why more on-ice studies have focussed on level multi-year floes, than severely deformed ones. The logistics of accessing deformed multi-year ice (by ship or air) are problematic, as are the effort and equipment needed to drill through the full thickness of ice. That is unfortunate because focusing attention on level multi-year ice floes like the one in photograph (a) raises questions about how often the more formidable features like the one in photograph (b) are encountered. Although this paper does not address the so-called frequency-of-encounter, which would be paper in itself, it does provide ample evidence that very thick multi-year ice is not a rare occurrence.
(b) (a)
Canadian Ice Service Canadian Ice Service
Figure 1. Ship-based observations of multi-year ice in the Beaufort Sea in late summer (a) level ice and (b) highly deformed ice. Both features are discussed in Johnston and Timco (2008).
DIRECT MEASUREMENTS OF MULTI-YEAR ICE THICKNESS
The visible effect that Climate Change is having on the spatial extent of perennial ice (and possibly its thickness) raises questions like “are thicknesses measured in the 1970s and 80s still relevant?”. To provide some insight to that question, this paper compiles data from the most comprehensive field studies on multi-year ice, spanning a period of 51 years. Only thicknesses
obtained by direct drilling (augering or coring) or from a combination of drill holes and sonar ranging are included here. Kovacs (1975) pioneered the use of sonar ranging for measuring the thickness of multi-year pressure ridges, and extensively validated his results with drill hole measurements. Both sonar and drilling are limited when it comes to measuring the maximum thickness of multi-year pressure ridges. Drilling can also have limitations on moderately thick multi-year floes, depending upon how much drilling equipment is available.
The thicknesses reported in this paper were obtained from individual (spot) measurements made either randomly at one or more locations on a floe, or along transects. Recent thickness measurements were obtained from digital files. All other data were obtained from hardcopy reports by re-entering (or scanning) tabulated data or by digitizing hardcopies of thickness profiles. Profiles were digitized by selecting enough data points to reasonably represent the sail and keel topography, while capturing the maximum and minimum ice thickness. Since many of the reports referenced here are from the ‘grey’ literature, this paper is one the few in the open literature to include data from these not-often-seen reports.
Airborne/ice-borne electromagnetic sensors and moored/submarine mounted upward looking sonar provide a wealth of information about ice thickness, but this paper does not include data from either source. Thickness measurements from the ubiquitous electromagnetic (EM) induction sensors have not been sufficiently validated on multi-year ice, yet many of the EM sensors are known to have severe limitations on thick ice due to their shallow penetration depth and/or appreciable ‘footprint’. A considerable amount of data has also been obtained from upward looking sonar (ULS). Although not included in the compilation, those data are referenced later in the paper.
DESCRIPTION OF FIELD STUDIES CONSIDERED HERE
This section describes the studies from which nearly 5000 thicknesses on multi-year floes were obtained. The floes were sampled across the Arctic (Figure 2), from 1958 to 2009. Symbols in the map refer to known coordinates of sampled floes or the coordinates approximated from a description of the study area.
Sverdrup Basin (total of 3240 thickness measurements): The largest number of ice thickness measurements come from the seismic studies that Panarctic Oils Ltd. and their partners conducted in the Sverdrup Basin. The gathering of seismic information along several thousand kilometres of precisely surveyed lines each year, from 1971 to 1986, required using a caterpillar-mounted rig to drill "shot" holes in the ice at intervals of 50, 70 or 135 m. A total of 123,703 boreholes were made in mixed-age ice (first-year, second-year and multi-year) over the stated period – thick ice being abandoned only occasionally (Melling, 2002). The Sverdrup Basin data are unique, since they represent the only known data base of its size containing accurate, unbiased thickness measurements of multi-year ice.
In this paper, data from 10 of the 44 survey lines run in 1978 are taken as representative of the 16 years of measurements from this area. The 5023 thicknesses measured along those 10 lines were easily incorporated into this analysis, having been used recently by Frederking (2005). Since these lines were run in MacLean Strait (noted by ‘x’ in Figure 2), they represent some of the thickest ice in the region. Only ice thicknesses of 3 m or more (3240 measurements) are discussed here; ice thinner than that is considered more characteristic of second-year or first-year
ice (although exceptions do apply). The maximum thickness from the 1978 data set was 23 m, which is comparable to the maximum thickness (26 m) measured along more than 12,000 km of transects over the 16 year period.
Dickins (1976) conducted thickness transects on 12 multi-year ridges in MacLean Strait using a combination of level survey and sonar ranging. Those data are not included in this compilation because none of the sonar readings were validated by drill hole measurements. However, it should be noted that the maximum measured ice thickness was 43 m and the mean total ridge thickness was 25.3 m. The 43 m maximum thickness is considerably greater than the 26 m measured during the 16 years of seismic studies, but it is in keeping with data from the Canadian Beaufort, as noted below.
5
1 - High Arctic 2 - Sverdrup Basin 3 - Central Canadian Arctic 4 - Canadian Beaufort 5 - Alaskan Beaufort 6 - Eastern Canadian Arctic 7 - Fram Strait
8 - Labrador Sea
9 - NW Canadian Arctic Isl.
x 4 9 3 1 6 8 7 2
Figure 2. Regions in which thickness measurements were made on level and ridged multi-year ice
Canadian Beaufort (638 measurements): The second largest number of thickness measurements come from the Canadian Beaufort, which should not be surprising given the number of studies conducted in the 1970s and 80s in support of oil and gas exploration. Works by Kovacs (1971; 1973; 1975), Dickins (1983) and Wright (1984) figure prominently in this region. These studies provide the only sources of information about the ridged multi-year floes that occur off the coast of Banks Island (73°N), where ice thicknesses approaching 50 m have been measured. Floating multi-year ice ridges are included in this paper. Grounded multi-year features are not, although they too can attain significant thickness (Kovacs and Gow, 1976; Wright and Gupta, 1982) making them hazardous to ships and structures once they dislodge. Kovacs (1975) reported the thickest ice in the data compilation: 40.2 m.
Alaskan Beaufort (419 measurements): Assur (1958) provides the earliest thickness measurements of multi-year ice on (what is assumed to be) a single multi-year floe. Most thickness measurements in this region were obtained from 9 ridged and level floes sampled by Vaudrey (1981) and 6 ridges by Kovacs (1983). Gulf (1978) provides thickness data for 3
pressure ridges on fragmented multi-year floes. The data also contain thicknesses measured on what is assumed to be a single floe sampled from the 1972 AIDJEX camp (Cox and Weeks, 1973). Voelker (1982; 1985) provides thickness data for 6 floes sampled from the USCGC Polar
Sea. The maximum thickness for the region (17.4 m) comes from Vaudrey (1981).
High Arctic (306 measurements): Danielewicz and Cornett (1984) provide 28 thickness measurements on 10 multi-year floes during the 1983 Hans Island study, although considerably more measurements were made using the ground-based EM-31 sensor. More recently, Salmela (1991) measured thickness profiles on 5 relatively level floes and 4 ridges north of Greenland while operating from the I.B. Oden. Johnston (2006; 2007) provides thickness data on multi-year floes in Nares Strait (16 measurements on 6 floes in 2006; 205 measurements on 9 floes in 2007). The thickest ice in this region was measured on a moderately hummocked floe where, at 16.6 m, the full thickness of ice could not be penetrated due to an insufficient amount of drill auger (Johnston, 2007).
Central Canadian Archipelago (183 measurements): Geotech (1986) measured 32 thicknesses on a single multi-year floe during the Medium Scale Multi-year Ice Indentation Test Program. Most of the on-ice thickness measurements in this region come from Johnston (2003; 2004; 2005; 2008; Johnston and Timco, 2008). Because those studies focused on ice strength however, typically only 3 to 4 holes were drilled per floe, each season. More recently, Johnston (2009) made detailed thickness measurements on multi-year floes in this region (82 thicknesses on 4 floes), from which the maximum thickness of the region was obtained (16.9 m). Measurements in this region are biased because all of the studies focussed on the more level areas of multi-year floes (ridge crests were avoided).
Eastern Canadian Arctic (150 measurements): Lapp et al. (1984) conducted more than 100 thickness measurements on 10 multi-year floes near Coburg Island, as part of the 1984 MV Arctic ship ramming trials. That data set is likely skewed towards thinner ice because thicknesses were frequently measured along the floe edge, to better define its geometry. Johnston (2005) measured a thickness of more than 8 m (the limit of the drill equipment) at four boreholes on a rubbled multi-year floe, whereas a later study showed a maximum thickness of 5 m from 38 drill holes on a single floe (Johnston, 2008). Lapp et al. (1981) report the maximum thickness for the region, at more than 10 m (the limit of the drill equipment).
Fram Strait (32 measurements): Gow et al. (1987) measured the thickness of 32 multi-year floes in the summer of 1984 while operating from the Polarstern. Since the objective of the study was to measure the properties of undeformed multi-year ice, cores were obtained from each floe in a level area of ice. The maximum reported thickness was 5.7 m but, because of the nature of the study, data are skewed towards thinner multi-year ice.
Labrador (19 measurements): Fenco (1977) provide the only readily available data on direct measurements of multi-year ice thickness for this region, other data having been misplaced or lost. One or two thicknesses are reported for 14 of the floes visited in March and April. Frequently, the multi-year floes were too thick to be penetrated. The deepest hole drilled without penetrating bottom was more than 10.7 m in March and 18.5 m in April.
Northwest Coast of Canadian Arctic Islands (0 measurements): Some of the thickest multi-year in the world exists in this region (Bourke and Garrett, 1987), which is significant because a portion of this ice drifts south every year. The authors are aware of only one on-ice study in this
area: Hudson et al. (1982) report that an aerial reconnaissance of the region showed landfast multi-year ice extending from central Prince Patrick Island (77°N) north to Ellesmere Island. Grounded shear ridges were reported extending to water depths of 52 m, sail excluded (Wright, unpublished). Those data are not included here because the thickness profiles were not validated.
ICE THICKNESS MEASUREMENTS
Results are now presented for (1) individual ice thicknesses combined for the entire Arctic (2) individual thicknesses grouped by the region in which they were collected and (3) mean thicknesses for individual ice features.
Individual Thickness Measurements, Arctic-wide
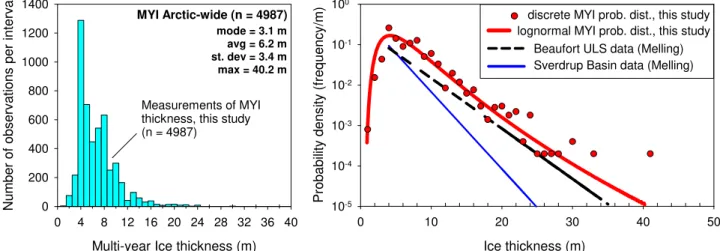
Figure 3-a shows the histogram for the 4987 measurements considered in this study, binned at 1 m intervals. The data include thicknesses of relatively level floes and deformed multi-year ridges. The average multi-year ice thickness measured across the Arctic is 6.2 m (±3.4 m), with a mode of 3.1 m. That might seem low, but it reflects the strong influence of the Sverdrup Basin data (3240 measurements) on the distribution. Excluding data from the Sverdrup Basin increases the average multi-year thickness to 6.4 m (±4.3 m) and the mode to 5.0 m (not shown).
Ice thickness (m) 0 10 20 30 40 50 Pr obabil it y dens it y ( fr e q u ency/m) 10-5 10-4 10-3 10-2 10-1 100
Sverdrup Basin data (Melling) Beaufort ULS data (Melling) discrete MYI prob. dist., this study
Multi-year Ice thickness (m)
0 4 8 12 16 20 24 28 32 36 40 Number of obser vati ons per i n ter v al 0 200 400 600 800 1000 1200 1400 Measurements of MYI thickness, this study (n = 4987)
mode = 3.1 m avg = 6.2 m st. dev = 3.4 m max = 40.2 m
lognormal MYI prob. dist., this study
MYI Arctic-wide (n = 4987)
Figure 3 Individual thicknesses measured on multi-year ice (a) histogram and (b) probability densities of binned data. Distributions for the Beaufort Sea and the Sverdrup Basin were obtained from Melling (2002). Note that on-ice measurements from this study include one year of data from the Sverdrup Basin.
The histogram shows the most commonly measured thicknesses quite well, but it does not reveal much about the more extreme values (tail of the distribution). The tail is better shown by plotting the probability density distributions on a logarithmic scale. Figure 3-b shows the discrete probability density for the direct thickness measurements from this study (using 1 m bins) and the lognormal probability density used to approximate the data. The maximum multi-year ice thickness in this study is 40.2 m. That is actually a lower bound because usually the maximum thickness along a ridge crest could not be measured by sonar or drilling.
This single extreme thickness of 40.2 m (41 m bin in Figure 3) might seem like an outlier, but a number of other studies have reported equally thick ice (or thicker), including Dickins (1976), Hudson et al. (1982), Melling (2002), to name a few. Figure 3-b shows the linear portion of the
mixed-age thickness distributions for the Beaufort Sea and Sverdrup Basin (after Melling, 2002). Thicknesses less than 4 m, the non-linear portion, have been excluded from both distributions. The Beaufort Sea data were obtained from a 350 km transect of ice drifting over a moored upward looking sonar (ULS). The Sverdrup Basin distribution includes the complete 16 years of seismic data (n = 123,703).
All three thickness distributions have a tail of exponentially decreasing probability for thick ice. Interestingly, the on-ice thickness distribution from the present study is in better agreement with the Beaufort Sea (ULS data) than the 16 years of data Sverdrup Basin (seismic studies). Recall that the present study includes only one year of data from the Sverdrup Basin, from which thicknesses less than 3 m were excluded. The 0.01 probability density for the on-ice measurements compiled in this study is 14 m, compared to 11 m for Melling’s Beaufort Sea data and 9 m for the Sverdrup Basin data. The 0.001 probability density is 22 m for the on-ice measurements, 19 m for the Beaufort Sea and 14 m for the Sverdrup Basin. Melling (2002) states that ice thicknesses in the Sverdrup Basin may be less extreme because of the limited fetch, which is insufficient to generate the ice-borne stresses needed to build large ridges. The author also suggests that the keels of massive ice features drifting into the Sverdrup Basin (from the northwest coast of the Canadian Arctic Islands) melt preferentially due to oceanographic effects.
Individual Thickness Measurements, Regional
Is the thickness of multi-year ice the same throughout the Arctic, or are there regional differences? Answering this question will help establish appropriate design criteria for ships and structures operating in different parts of the Arctic, and it will help focus future field studies in the regions where they are needed. On the other hand, if no regional variation in ice thickness exists, it should not matter where future measurements on multi-year ice are made. Thickness distributions for different Arctic regions were plotted, keeping in mind that the measurements all had some degree of bias, depending upon the objectives of the study, logistics, equipment limitations, etc. The Sverdrup Basin data are the exception, as mentioned earlier.
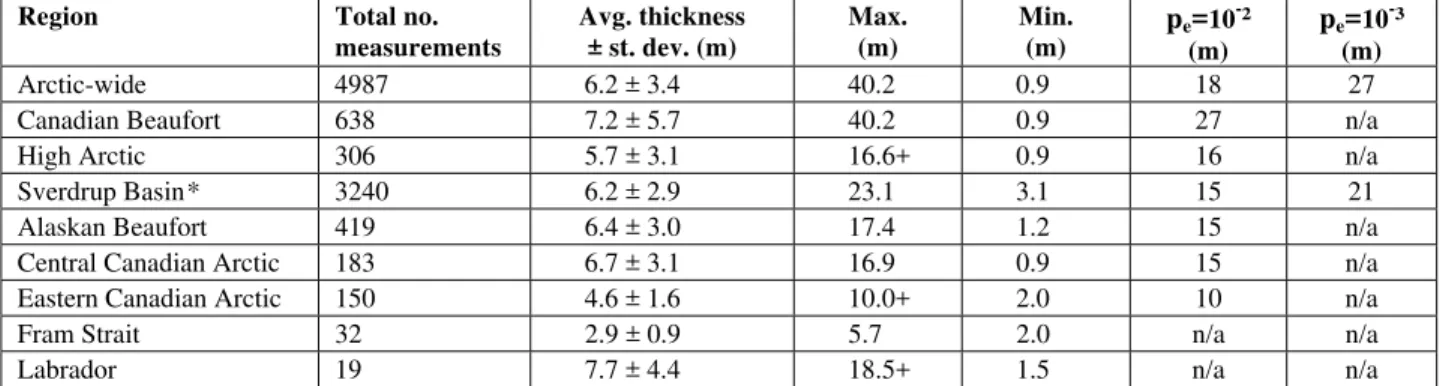
The histograms below show the individual thicknesses reported for multi-year floes in different Arctic regions (Figure 2). Labrador and Fram Strait are not included because so few data have been collected in those regions. Table 1 lists the particulars of multi-year ice from the different regions. The modes of multi-year ice thickness in the Sverdrup Basin (9.2 m) and Canadian Beaufort (10 m) are comparable, as are modes for the Alaskan Beaufort (7.9 m) and Central Canadian Arctic (7.3 m). The average multi-year ice thickness in Sverdrup Basin, the Alaskan Beaufort and the Central Canadian Arctic ranges from 6 to 7 m, with standard deviations of ±3 m. The average multi-year ice thickness in the Canadian Beaufort (7.2 m) is comparable to those three regions, but its standard deviation is almost twice as high (±5.7 m). Surprisingly, thicknesses reported for the High Arctic have a lower mode (5.0 m) and average (5.7 m) than most of the other Arctic regions (except for the Eastern Arctic). That is partly because floes north of Greenland (Salmela, 1991) were included in the High Arctic, whereas they are probably more representative of Fram Strait. When the data from Salmela (1991) are removed from the High Arctic, the average thickness increases to 6.1 m (± 2.1 m) not shown. Some bias is introduced into the High Arctic because the majority of thickness were obtained from Johnston (2008), where ridged ice was not sampled and only a limited amount of drill auger was available (a maximum thickness of 16.6+ m).
Table 1 Statistics of Individual Multi-year Thicknesses for entire Arctic, and Different Regions
Region Total no.
measurements Avg. thickness ± st. dev. (m) Max. (m) Min. (m) pe=10-² (m) pe=10-³ (m) Arctic-wide 4987 6.2 ± 3.4 40.2 0.9 18 27
Canadian Beaufort 638 7.2 ± 5.7 40.2 0.9 27 n/a
High Arctic 306 5.7 ± 3.1 16.6+ 0.9 16 n/a
Sverdrup Basin* 3240 6.2 ± 2.9 23.1 3.1 15 21
Alaskan Beaufort 419 6.4 ± 3.0 17.4 1.2 15 n/a
Central Canadian Arctic 183 6.7 ± 3.1 16.9 0.9 15 n/a
Eastern Canadian Arctic 150 4.6 ± 1.6 10.0+ 2.0 10 n/a
Fram Strait 32 2.9 ± 0.9 5.7 2.0 n/a n/a
Labrador 19 7.7 ± 4.4 18.5+ 1.5 n/a n/a
*Sverdrup Basin data obtained from 10 transects run in 1978. Data here include thicknesses of 3 m or greater. Alaskan Beaufort (n = 419) 0 10 20 30 40 N u m b e r o f ob s e rv a ti ons pe r b in 0 20 40 60 80 100 mode = 7.9 m avg = 6.4 m st. dev = 3.0 m max = 17.4 m Canadian Beaufort (n = 638) 0 10 20 30 40 0 40 80 120 mode = 10.0 m avg = 7.2 m st. dev = 5.7 m max = 40.2 m
East. Can. Arctic (n = 150)
Multi-year ice thickness (m)
0 10 20 30 40 0 20 40 60 mode = 3.8 m avg = 4.6 m st. dev = 1.6 m max = 10+ m High Arctic (n = 306) 0 10 20 30 40 0 40 80 120 mode = 5.0 m avg = 5.7 m st. dev = 3.1 m max = 16.6+ m Sverdrup Basin (n = 3240) 0 10 20 30 40 0 200 400 600 800 1000 1200 mode = 9.2 m avg = 6.2 m st. dev = 2.9 m max = 23.1 m
Cen. Can. Arctic (n = 183)
0 10 20 30 40 0 10 20 30 40 mode = 7.3 m avg = 6.7 m st. dev = 3.1 m max = 16.9 m
Figure 4 Histograms of multi-year thicknesses for different geographic regions. The Sverdrup Basin data were acquired along 10 transects during the 1978 seismic study.
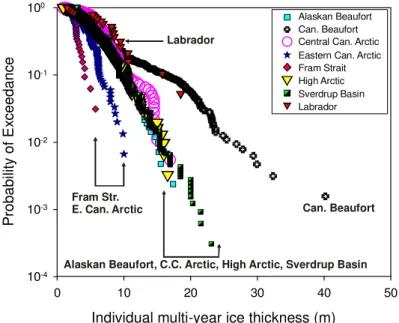
Because there are so few data from the different Arctic regions, the tail of their distributions cannot be shown in the same fashion that was used for individual thickness measurements in Figure 3-b (n = 4987). Rather, the tail for the different Arctic regions was plotted in terms of the exceedance probability (Figure 5), for which thicknesses were ranked in descending order and plotted against a probability, pe = i/(n+1); where pe is the exceedance probability, i is the ith ranked data point and n is the total number of data points.
The probability of exceedance curves for multi-year ice in the Alaskan Beaufort, Central Canadian Arctic, High Arctic and Sverdrup Basin are similar (Figure 5). There is also evidence of thick multi-year floes off the coast of Labrador (although data in this region are limited). Results suggest that multi-year floes in the Eastern Canadian Arctic and Fram Strait are thinner than elsewhere in the Arctic. Multi-year ice from the Canadian Beaufort is considerably thicker than ice in other regions, as discussed below.
Individual multi-year ice thickness (m)
Alaskan Beaufort, C.C. Arctic, High Arctic, Sverdrup Basin Labrador 0 10 20 30 40 50 P robabili ty of E xc eed anc e 10-4 10-3 10-2 10-1 100 Alaskan Beaufort
Central Can. Arctic Can. Beaufort
Eastern Can. Arctic Fram Strait High Arctic Sverdrup Basin Labrador
Fram Str.
E. Can. Arctic Can. Beaufort
Figure 5 Exceedance probabilities for multi-year ice from various regions
The probabilities most commonly cited for engineering purposes are the 100-year occurrence (pe=10-²) and the 1000-year occurrence (pe=10-³), but those terms have no physical basis for describing the thickness of multi-year ice that can be expected once every 100 or 1000 years. That would require much more data, plus information about floe size, drift speed and drift trajectory – none of which is readily available. However, exceedance probabilities can be used to compare multi-year ice thicknesses from different Arctic regions in a general way. Multi-year ice in the Alaskan Beaufort, Central Canadian Arctic, High Arctic and Sverdrup Basin have a 10-² exceedance probability of 15 to 16 m, compared to 27 m for the Canadian Beaufort. Differences between the Canadian Beaufort and the other regions become even more pronounced further out in the tail, where the 10-³ exceedance probability is 40 m for the Canadian Beaufort compared to 21 m for Sverdrup Basin, Alaskan Beaufort, High Arctic and Central Canadian Arctic. The 10-² exceedance probability for multi-year ice in the Eastern Canadian Arctic is 10 m. The 10-² exceedance probability for Fram Strait and Labrador cannot be determined because there are too few data.
Mean Thickness of “Level” Ice vs. Ridged Features
Part of the reason that the exceedance probabilities for the Canadian Beaufort are higher than other Arctic Regions is because many studies in that region focussed on multi-year pressure ridges. Therefore it is of interest to separate pressure ridges from the rest of the data. This was done by subdividing the measurements into two broad feature classes: deformed multi-year pressure ridges and relatively “level” multi-year ice. Taking it one step further, the mean thickness of a floe or ridge was determined whenever 3 or more thicknesses were reported for that feature. In general, the mean thickness of a pressure ridge does not include data from the level ice around it, and the mean thickness of a floe does not include data from pressure ridges. Reference is made to “level” multi-year ice, even though it is recognized that the surface topography of most multi-year floes ranges from moderate to extremely rough, which makes them very different from the floe pictured in Figure 1-a.
Nearly 1500 measurements were used to determine mean thicknesses for relatively level floes and pressure ridges sampled in the Arctic over the past 50 years. Although that may sound like a considerable amount of data, it only provides information about 101 multi-year ice features (65 floes and 36 pressure ridges). On average, 15 thickness measurements were obtained per ice feature, but many studies report only 3 thicknesses per feature (the minimum required for a mean thickness calculation) – and sometimes fewer.
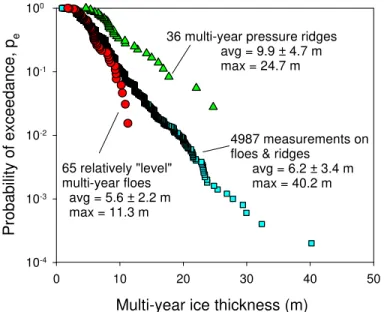
Figure 6 shows the exceedance probabilities for relatively level floes and deformed pressure ridges. As expected, multi-year floes and pressure ridges represent two very distinct populations. On average, the mean thickness of a relatively level multi-year feature is 5.6 m (±2.2 m). The mean thickness of a pressure ridge is, on average, 9.9 m (±4.7 m). The most formidable floe sampled in the studies cited here had a mean thickness of 11.3 m (from Johnston, 2008). The most massive pressure ridge had a mean thickness of 24.7 (from Kovacs, 1975). Therein lies the explanation for why thicknesses in the Canadian Beaufort are much higher than elsewhere in the Arctic: results from the Canadian Beaufort are dominated by measurements from 18 ridges that have a mean feature thickness of 11.0 m and a maximum feature thickness of 24.7 m. In comparison, the 16 ridges sampled in the Alaskan Beaufort had a mean feature thickness of 8.6 m and a maximum feature thickness of 12.8 m. Figure 6 shows that, where data overlap, results from the 4987 individual thickness measurements in this study fall between the mean feature thickness of level floes and pressure ridges.
Multi-year ice thickness (m)
0 10 20 30 40 50 Pr ob abi lit y of excee dance , p e 10-4 10-3 10-2 10-1 100 4987 measurements on floes & ridges
avg = 6.2 ± 3.4 m max = 40.2 m 65 relatively "level" multi-year floes avg = 5.6 ± 2.2 m max = 11.3 m
36 multi-year pressure ridges avg = 9.9 ± 4.7 m max = 24.7 m
Figure 6 Exceedance probabilities showing mean feature thickness of 65 relatively level floes and 36 pressure ridges. Also included are individual thicknesses for level and ridged multi-year ice combined.
RECOMMENDATIONS
This paper highlights several “unknowns” surrounding multi-year ice. First, detailed thickness measurements have not been made along the northwest coast of the Canadian Arctic Islands. The fact that so few studies have been conducted in an area that produces the most severe ice features is partly responsible for our incomplete understanding of multi-year thickness – and the absence of data on multi-year hummock fields. Second, detailed thickness measurements should include
pressure ridges, in addition to the more level regions of the floe. To be used for design, information must be available about lateral extent, and thus average thickness over different areas of the floe. Accounting for only the maximum feature thickness, will result in unrealistically high loads. Spatial variability in thickness is also important because, while massive ice features do exist, their driving force needs to be sufficient for them to pose a threat to offshore structures. Third, efforts should be focused towards quantifying if, and how, extremely thick multi-year features decrease in thickness as they migrate south – only then, will answers be forthcoming about whether massive pressure ridges from northern Canadian waters will still be a concern when they arrive in shipping lanes and/or lease areas.
CONCLUSIONS
Nearly 5000 direct measurements of multi-year ice thickness were compiled from 31 studies, spanning 51 years. Recent measurements on the more level parts of multi-year ice confirm that extremely thick multi-year ice still exists, throughout the Arctic. On average, the mean thickness of a relatively level multi-year floe is 5.6 m (±2.2 m), although floes with a mean thickness upwards of 8 m have been found quite easily. While these floes are thick, they pale in comparison to the thickness of multi-year pressure ridges. Individual (spot) measurements have shown ridges to be upwards of 40 m thick On average, the mean thickness of a multi-year pressure ridge is 9.9 m (±4.7 m) although ridges with a mean thickness of 24.7 m have been measured.
Individual thickness measurements on multi-year ice suggest that floes from the Beaufort, Central Canadian Arctic, High Arctic and Sverdrup Basin are of comparable thickness. There is some evidence that multi-year floes in Fram Strait and the Eastern Canadian Arctic may be thinner than elsewhere in the Arctic, but there are too few data to state this with certainty. It is sometimes questioned whether features such as the massive pressure ridges found in the Canadian Beaufort are also present in the Alaskan Beaufort. While too few data are given in the paper to decisively answer this question, the anecdotal evidence given here from Kovacs and Gow (1975) suggests ‘yes’, such massive ice features do exist in the Alaskan Beaufort. Recent measurements by Melling (2002, personal communication) also provide evidence to support this.
In closing, it is hoped that this paper provided a more coherent picture of multi-year ice. Reliable information about its thickness will be extremely important for the design and operation of future exploration and production systems in the Beaufort Sea, as it was for exploration structures in the past. Has multi-year ice become less important? Evidence here says not. Unfortunately, direct measurements of multi-year ice thickness have not been made in the same area, over a number of years, but this paper shows that the thick multi-year floes like those sampled in the 1970s and 80s persist to this day.
ACKNOWLEDGEMENTS
The financial support and interest of Transport Canada, the Program for Energy Research and Development (PERD), Industry, Canadian Ice Service, Canadian Coast Guard and the Polar Continental Shelf Program is gratefully acknowledged; without it, recent measurements on multi-year ice would not have been possible. Industry also contributed by making not-often-seen reports from the grey literature available for this study. The helpful comments of R. Frederking are much appreciated.
REFERENCES
Bourke, R. and Garrett, R. (1986) Sea Ice Thickness Distribution in the Arctic Ocean. Cold Regions Science and Technology, 13 (1987), p. 259 – 280.
Cox, G.F.N. and Weeks, W.F. (1973) Salinity variations in sea ice. U.S. Army Cold Regions Research and Engineering Laboratory, CRREL report 310, August 1973, 23 pp.
Dickins, D. (1976) Multi-year Pressure Ridge Study, Queen Elizabeth Islands. Report by NORCOR Engineering and Research Limited, October 1976, 67 pp.
Dickins, DF and Associates, Ltd. (1983) Multi-year ice thickness distribution in the Beaufort Sea. Report for Gulf Canada Resources Inc., March 1983, 35 pp.
Danielewicz, B.W. and Cornett, S. (1984) Ice Forces on Hands Island, 1983. APOA Report 202 prepared by Canadian Marine Drilling Limited, May, 1984, 144 pp.
Fenco (1973) Beaufort Sea Summer Ice Testing Project. Report 60 for Arctic Petroleum Operators Association (APOA) prepared by Fenco Consultants Ltd., November, 1973, 16 pp. Fenco (1977) 1977 Winter Field Ice Survey Offshore Labrador. Report for Total Eastcan
Exploration Ltd. prepared by Fenco Consultants Ltd., August 1977, 202 pp.
Frederking, R. (2005) A Method for Determining Ice Cover Thickness and Strength in the Canadian Arctic Archipelago. Report by NRC-CHC, CHC-TR-034, May, 2005, 12 pp.
Geotech (1986) Medium Scale Multi-year Ice Indentation Test Program. Joint Industry Report prepared by GEOTECHnical Resources Ltd. 282 pp.
Gow, A.J. et al. (1987) Physical properties of Summer Ice in the Fram Strait, June-July 1984. U.S. Army Cold Regions Research and Engineering Laboratory, CRREL report 87-16, 87 pp. Gulf (1985) Dynamic Horizontal Ice Loading on an Offshore Structure: On Ice Investigation,
Vol. V1, Phase IA Molikpaq Performance at Amauligak I-65. 47 pp.
Hudson et al. (1982) Final Report on the Field Studies and Aerial Mapping along the Northwest Edge of the Canadian Archipelago, March/April 1980. 50 pp.
Harrington, G. (1979) Geometry and Strength of Multi-year Pressure Ridges in the Alaskan Beaufort Sea. Report by Gulf Resources Offshore Technology Section (GR&DC), May, 1979. Hibler, W.D. III et al. (1972) Top and Bottom Roughness of a Multi-year Ice Floe. AIDJEX
Bulletin 13, May 1972, p. 77 - 91.
Johnston, M. (2003) Properties of Second-year and Multi-year Ice during Freeze-up. Report by NRC-CHC, CHC-TR-024, March 2004, 26 pp.
Johnston, M. (2004) Properties of Second-year and Multi-year Ice during Freeze-up. Technical report by NRC-CHC, CHC-TR-024, March 2004, 27 pp.
Johnston, M. (2005) Properties of Second-year and Multi-year Ice during Freeze-up: Second Season of Measurements. Interim report by NRC-CHC for CCGS Louis S. St-Laurent 2005 voyage report, November 2005, 13 pp.
Johnston, M. (2006) unpublished.
Johnston, M. (2008) Characterizing Multi-year Ice in the High Arctic: Evaluating Two Ground-based EM Sensors. Controlled Tech. Report by NRC-CHC, CHC-CTR-073, Mar 2008, 70 pp. Johnston, M. and Timco, G. (2008) Understanding and Identifying Old Ice in Summer.
Technical report by NRC-CHC, CHC-TR-055, December, 2008, 236 pp.
Johnston, M. (2009) Thickness and Temperature Measurements on Multi-year Ice in the Canadian Arctic Archipelago, 2008 Field Season. Controlled Technical Report by NRC-CHC, CHC-CTR-090, January 2009.
Johnston, M. et al. (2002) Property Changes of First-year Ice and Old Ice during Summer Melt. Report by NRC-CHC, CHC-TR-010, March 2003, 36 pp.
Kovacs, A and Mellor, M. (1971) Sea Ice Pressure Ridges and Ice Islands. Technical Note 122, Creare Inc., Hanover, New Hampshire, 127 pp.
Kovacs, A. et al. (1973) Structure of a Multi-year Pressure Ridge. Arctic, Vol. 26, No. 1, p. 22 - 31.
Kovacs, A. (1975) A study of Multi-year Pressure Ridges and Shore Ice Pile-up. APOA Project 89, October 1975, 45 pp.
Kovacs, A. and Gow. A. (1976) Some Characteristics of Grounded Floeberg near Prudhoe Bay, Alaska. Cold Regions Research and Engineering Laboratory Report 76-34, September 1976, 13 pp.
Kovacs, A. (1983) Characteristics of Multi-year Pressure Ridges. Proceedings of 7th International Conference on Port and Ocean Engineering under Arctic Conditions (POAC'83), Helsinki, Vol. 3, p. 173 - 182.
Lapp, D. et al. (1984) Test Ice for Dedicated Tests M.V. Arctic 1984, Location, Monitoring, Verification and Specific Data: Phase IV Testing Program: Vol I: Ice Physical Property Report. Report by Norland Science and Engineering Ltd. for Canarctic Shipping Company Ltd., Dec. 1984, 150 pp.
Melling, H. (2002) Sea Ice of the Northern Canadian Arctic Archipelago. Journal of Geophysical Research, Vo.. 107, No. C11, 21 pp.
Salmela, O. (1991) Measurements made for the Sea Ice and Remote Sensing Group during the ODEN-91 International Arctic Ocean Expedition. Report by Helsinki University of Technology, Laboratory of Naval Architecture and Marine Engineering, Appendix III, 59 pp. Sandwell Inc. (1991) Beaufort and Chukchi Sea: Arctic Production Platforms – Update. Joint
Industry Project Report 112517.
Voelker, R.P et al. (1985) Beaufort Sea Data Collection: Multi-year Ice Research Aboard the USCGC POLAR SEA - November 11 - December 4, 1984", Report by ARCTEC Engineering for Maritime Administration, Washington D.C., PB88-18123, June 1985, 57 pp.
Voelker, R.P. et al. (1982) Summer Multi-year Ice Properties in the Beaufort Sea. Report by ARCTEC Engineering for Maritime Administration, Washington D.C., Dec. 1982, Report 797C, 109 pp.
Vaudrey, K. (1981) Beaufort Sea Multiyear Ice Features Survey, Volume I: Field Study, report by Vaudrey and Associates, Inc., October 1981, 36 pp.
Wright, B. and Gupta, P. (1982) Ice Pile-up and Ride-up Survey, Banks Island – 1979. Gulf Canada Report, Frontier Development Division. June 1982.
Wright, B. et al. (1984) Beaufort Multi-year Ice Study, 1980, Dec. 1980. Report by Gulf Canada Resources Inc. Jan. 1984.