Assessing Language Proficiency from Eye Movements in Reading
The MIT Faculty has made this article openly available.
Please share
how this access benefits you. Your story matters.
Citation
Berzak, Yevgeni et al. "Assessing Language Proficiency from Eye
Movements in Reading." © 2018 The Association for Computational
Linguistics. 2018 Conference of the North American Chapter of
the Association for Computational Linguistics: Human Language
Technologies, June 2018, New Orleans, Louisiana, Association for
Computational Linguistics, 2018.
As Published
http://dx.doi.org/10.18653/v1/n18-1180
Publisher
Association for Computational Linguistics
Version
Final published version
Citable link
https://hdl.handle.net/1721.1/130436
Terms of Use
Creative Commons Attribution 4.0 International license
Proceedings of NAACL-HLT 2018, pages 1986–1996
Assessing Language Proficiency from Eye Movements in Reading
Yevgeni Berzak MIT BCS [email protected] Boris Katz MIT CSAIL [email protected] Roger Levy MIT BCS [email protected] Abstract
We present a novel approach for determining learners’ second language proficiency which utilizes behavioral traces of eye movements during reading. Our approach provides stand-alone eyetracking based English proficiency scores which reflect the extent to which the learner’s gaze patterns in reading are similar to those of native English speakers. We show that our scores correlate strongly with standard-ized English proficiency tests. We also demon-strate that gaze information can be used to ac-curately predict the outcomes of such tests. Our approach yields the strongest performance when the test taker is presented with a suite of sentences for which we have eyetracking data from other readers. However, it remains effec-tive even using eyetracking with sentences for which eye movement data have not been previ-ously collected. By deriving proficiency as an automatic byproduct of eye movements during ordinary reading, our approach offers a poten-tially valuable new tool for second language proficiency assessment. More broadly, our re-sults open the door to future methods for infer-ring reader characteristics from the behavioral traces of reading.
1 Introduction
It is currently estimated that over 1.5 billion peo-ple are learning English as a Second Language (ESL) worldwide. Their learning progress is com-monly evaluated with classroom tests prepared by language instructors, quizzes in language learn-ing software such as Duollearn-ingo and Rosetta Stone, and by official standardized language proficiency tests such as TOEFL, IELTS, MET and others. In “high stakes” scenarios, official language profi-ciency tests are the de-facto standards for language assessment; they are accepted by educational and professional institutions, and are taken by millions of language learners every year (for example, in
2016 over three million people took the IELTS test (IELTS,2017)). These tests probe language profi-ciency based on performance on various linguistic tasks, including grammar and vocabulary exams, reading and listening comprehension questions, as well as essay writing and speaking assignments.
Despite their ubiquity, traditional approaches to language proficiency testing have several draw-backs. First, such tests are typically prepared man-ually and require extensive resources for test de-velopment. Moreover, their validity can be un-dermined by test specific training, prior knowl-edge of the evaluation mechanisms (Powers et al., 2002), as well as plain cheating via unauthorized access to test materials. Further, the utilized test-ing and evaluation methodologies vary across dif-ferent tests, and test materials are in most cases inaccessible to the research community. Perhaps most crucially, the reliance of these tests on the end products of linguistic tasks makes it challeng-ing to study learners’ language processchalleng-ing patterns and the difficulties they encounter in real time.
In this work we propose a novel methodol-ogy for language proficiency assessment which marks a significant departure from traditional lan-guage proficiency tests and addresses many of their drawbacks. In our approach, we determine language proficiency from broad coverage analy-sis of eye movements during reading of free-form text in a foreign language, a special case of the general problem of inferring comprehender char-acteristics and cognitive state from the measur-able traces of real-time language processing. Our framework does not require the test taker to pre-pare for the test or to perform any hand-crafted lin-guistic tasks, but simply to attentively read an ar-bitrary set of sentences. To the best of our knowl-edge, this work is the first to propose and imple-ment such an approach, yielding a novel language proficiency evaluation scheme which relies solely 1986
on ordinary reading.
Our framework builds on previous research in psycholinguistics demonstrating that the eyetrack-ing record reflects how readers interact with the text and how language processing unfolds over time (Frazier and Rayner, 1982; Rayner, 1998; Rayner et al., 2012). In particular, it has been shown that key aspects of the reader’s character-istics and cognitive state, such as mind wander-ing durwander-ing readwander-ing (Reichle et al.,2010), dyslexia (Rello and Ballesteros,2015) and native language (Berzak et al., 2017) can be inferred from their gaze record. Despite these advances, the poten-tial of the rich and highly informative behavioral signal obtainable from human reading for auto-mated inference about readers, and specifically about their linguistic proficiency has thus far been largely unutilized.
Here, we first introduce EyeScore, an indepen-dent measure of ESL proficiency which reflects the extent to which a learner’s English reading pat-terns resemble those of native speakers. Second, we present a regression model which uses gaze features to predict the learner’s scores on specific external proficiency tests. We address each of our tasks in two data regimes: Fixed Text, which re-quires eyetracking training data for the specific sentences presented to the test taker, as well as the more general and challenging Any Text regime, where the test taker is presented with arbitrary sentences for which no previous eyetracking data is available. To enable prediction mechanisms in both regimes, we utilize previously proposed gaze features, and develop new linguistically and psy-chologically motivated feature sets which capture the interaction between eye movements and lin-guistic properties of the text.
We demonstrate the effectiveness of our ap-proach via score comparison to standardized En-glish proficiency tests. Our primary benchmark test, taken in lab by 145 ESL participants, are the grammar and listening sections of the Michi-gan English Test (MET) whose scores range from 0 to 50. EyeScore yields 0.5 Pearson’s correla-tion to MET in the Fixed Text regime, and 0.48 in the Any Text regime. Our regression model for predicting MET scores from eye movement fea-tures obtains a correlation of 0.7 and a Mean Ab-solute Error (MAE) of 3.31 points in the Fixed Text regime, and 0.49 correlation and 4.11 MAE in the Any Text regime. Our results are
sub-stantially stronger compared to a baseline using only raw reading speed, and are reasonably close to correlations among traditional proficiency tests. These outcomes confirm the promise of the pro-posed methodology to reliably measure language proficiency.
This paper is structured as follows. Section 2 describes the data and the experimental setup. In section3we delineate our feature sets for charac-tering eye movements in human reading. Section 4 introduces EyeScore, a second language profi-ciency metric which is based on similarity of read-ing patterns to native speakers. In section 5 we use eyetracking patterns to predict scores on MET and TOEFL. In section6we survey related work. Finally, we conclude and discuss future work in section7.
2 Experimental Setup
Our study uses the dataset of eye movement records and English proficiency scores introduced in Berzak et al. (2017)1, which we describe here in
brief. The dataset contains gaze recordings of 37 native English speakers and 145 ESL speakers be-longing to four native language backgrounds: 36 Chinese, 36 Japanese, 36 Portuguese and 37 Span-ish. Participants were presented with free-form English sentences appearing as one-liners. To en-courage attentive reading each sentence was fol-lowed by a yes/no comprehension question. Dur-ing the experiment participants held a controller with buttons for indicating sentence reading com-pletion and answering the sentence comprehen-sion questions. Participants’ eye movements were recorded using a desktop mount EyeLink 1000 eyetracker (SR Research) at a sampling rate of 1000Hz.
2.1 Procedure and Reading Materials
An experimental trial for a sentence starts with a presentation of a target circle at the center left of a blank screen. A 300ms fixation on this circle trig-gers a one-liner sentence on a new screen starting at the same location. After completing reading the sentence, participants are presented with the let-ter Q on a blank screen. A 300ms fixation on this letter triggers a question about the sentence on a new screen. Participants provide a yes/no answer to the question and are subsequently informed if
1The data was collected under IRB approval, and all the
they answered correctly. The first trial of the ex-periment was presented to familiarize participants with the experimental setup, and is discarded from the analysis.
Each participant read a total of 156 English sentences, randomly drawn from the Wall Street Journal Penn Treebank (WSJ-PTB) (Marcus et al., 1993). The maximal sentence length was set to 100 characters, yielding an average sentence length of 11.4 words. All the sentences include the manual PTB annotations of POS tags (Santorini, 1990) and phrase structure trees, as well as Google universal POS tags (Petrov et al.,2012) and depen-dency trees obtained from the Universal Depen-dency Treebank (UDT) (McDonald et al.,2013). 2.2 Experimental Regimes
Half of the 156 sentences presented to each par-ticipant belong to the Fixed Text regime, and the other half belong to the Any Text regime. Sen-tences from the two regimes were interleaved ran-domly and presented to all participants in the same order.
Fixed Text In this regime, all the participants read the same suite of 78 pre-selected sentences (900 words). The Fixed Text regime supports token-level comparisons of reading patterns for specific words in the same contexts across read-ers. It enables the construction of a proficiency test which relies on a fixed battery of reading materials for which previous eyetracking data was collected. Any Text In the second, Any Text regime, dif-ferent participants read difdif-ferent sets of 78 sen-tences each (880 words on average). This regime generalizes the Fixed Text scenario; predicting reader characteristics in this regime requires for-mulating type-level abstractions that would al-low meaningful comparisons of reading patterns across different sentences. It corresponds to a pro-ficiency test in which the sentences presented to the test taker are completely arbitrary, and no prior eyetracking data is available for them.
2.3 Standardized English Tests
We use participants’ performance on the Michi-gan English Test (MET) and TOEFL as external benchmarks of their English proficiency.
Michigan English Test (MET) Our primary in-dicator of English proficiency is the listening and grammar sections of the MET (Form-B), which were administered by Berzak et al. (2017) in-lab, and taken by all the 145 non-native participants
upon completion of the reading experiment. The test has a total of 50 multiple choice questions, comprising 20 listening comprehension questions and 30 written grammar questions. The test score is computed as the number of correct answers for these questions, with possible scores ranging from 0 to 50. The mean MET score in the dataset is 41.46 (std 6.27).
TOEFL Berzak et al. (2017) also collected self-reported scores on the most recently taken offi-cial English proficiency test, which we use here as a secondary evaluation benchmark. We focus on the most commonly reported test, the TOEFL-iBT whose scores range from 0 to 120. We take into ac-count only test results obtained less than four years prior to the experiment, yielding 33 participants. We sum the scores of the reading and listening sec-tions of test, with a total possible score range of 0 to 60. In cases where participants reported only the overall score, we divided that score by two. We further augment this data with 20 participants who took the TOEIC Listening and Reading test within the same four years range, resulting in a total of 53 external proficiency scores. The TOEIC scores were converted to the TOEFL scale by fitting a third degree polynomial on an unofficial score conversion table2between the tests. The converted
scores were then divided by two. Henceforth we refer to both TOEFL-iBT and TOEIC scores con-verted to TOEFL-iBT scale as TOEFL scores. The mean TOEFL score is 47.6 (std 9.55). The Pear-son’s r correlation between the TOEFL and MET scores in the dataset is 0.74.
2.4 Data Split
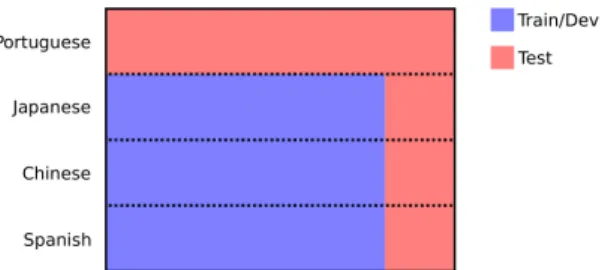
We divide the ESL speakers into train-ing/development and test sets in the following manner. For MET, we split our 145 ESL par-ticipants into a training/development set of 88 participants and a test set of 57 participants. The test set consists of an entire held out native language – 36 speakers of Portuguese – as well as 7 participants randomly sampled from each of the remaining three native languages. Our test set is thus particularly challenging due to the large fraction of participants belonging to the held out language, a design which emphasizes
2
http://theedge.com.hk/conversion-table-for-toefl-ibt-pbt-cbt-tests/ Although both TOEFL and TOEIC are administered by the same company (ETS), to the best of our knowledge there is no publicly available official conversion table between the two tests.
Figure 1: Illustration of the data split for MET into a training/development set (88 participants) and a test set (57 participants).
generalization to language learner populations which are not part of the training set. Figure 1 presents a schematic overview of our MET split. For TOEFL, due to the limited available data, in Section4 we report EyeScore correlations for all the 53 test takers, and in Section 5 we perform regression experiments using leave-one-out cross validation.
3 Eye Movement Features
In order to capture behavioral psycholinguistic traces of language proficiency we utilize several linguistically and psychologically motivated fea-ture representations of eye movements in read-ing. We include features introduced in prior work (see Words in Fixed Context and Syntactic Clus-ters (Berzak et al., 2017)) as well as newly de-veloped feature sets (see Word Property Coeffi-cients and Transitions). All our features rely on the well established division of gaze trajectories into fixations (stops) and saccades (movements be-tween fixations) that characterizes human reading (Rayner,1998).
Our fixation based features make use of several standard metrics of fixation times, defined below.
• First Fixation duration (FF) Duration of the first fixation on a word.
• First Pass duration (FP) Time spent from first entering a word to first leaving it (includ-ing re-fixations within the word).
• Total Fixation duration (TF) The sum of all fixation times on a word.
• Regression Path duration (RP) Time from first entering a word until proceeding to its right.
Our feature sets are divided into two groups. The first group consists of type-level features, ap-plicable both in the Any Text and Fixed Text regimes. The second group of feature sets is token-based and can be extracted only in the Fixed Text regime, because it presupposes the same textual input for all participants.
3.1 Type-Level Features
Word Property Coefficients (WP-Coefficients) This new feature set quantifies the influence of three key word characteristics on reading times of individual readers: word length, word frequency and surprisal. The last measures the difficulty of processing a word in a sentence (Hale,2001;Levy, 2008), and is defined as its negative log probability given a sentential context:
surprisal(wi|w1...i−1) =− log(wi|w1...i−1)
(1) In the reading literature, these three characteris-tics were suggested as the most prominent linguis-tic factors influencing word reading times (e.g. In-hoff and Rayner, 1986; Rayner and Well, 1996; Pollatsek et al.,2008;Kliegl et al., 2004;Rayner et al., 2004, 2011; Smith and Levy, 2013; Luke and Christianson,2016); whereby longer, less fre-quent and contextually less predictable words are fixated longer.
To derive this feature set, we measure length as the number of characters in the word. Word (log) frequencies are obtained from the BLLIP-WSJ corpus (Charniak et al., 2000). Estimates of surprisal are obtained from a trigram lan-guage model with Chen and Goodman’s modified Kneser-Ney smoothing trained on the BLLIP-WSJ using SRILM (Stolcke et al., 2002). We then fit for each participant four regression models that use these three word characteristics to predict the word’s raw FF, FP, TF and RP durations. The re-gression models are fitted using Ordinary Least Squares (OLS). We also train a logistic regres-sion model for predicting word skips. Finally, we extract the weights and intercepts of these mod-els and encode them as features. As each of the five models has three coefficients and one intercept term, the resulting WP-Coefficients feature set has 20 features.
Syntactic Clusters (S-Clusters)
Following Berzak et al. (2017), we extract aver-age word reading times clustered by POS tags and
syntactic functions. We utilize three metrics of reading times, FF, FP and TF durations. We then cluster words according to three types of syntac-tic criteria, Google Universal POS tags, PTB POS tags, and the syntactic function label of the word to its head word. To derive the feature set, we av-erage the word fixation times of each cluster. An example of an S-Cluster feature is the average TF duration for words with the PTB POS tag DT. We take into account only cluster labels that appear at least once in the reading input of all the partici-pants, yielding a total of 312 S-Clusters features in the Fixed Text regime. In the Any Text regime we obtain 156 S-Clusters features for MET and 165 S-Clusters features for TOEFL.
3.2 Token-Level Features Transitions
Transitions is a new feature set which summarizes the sequence of saccades between words in a sen-tence. Given a sentence with n words, we con-struct an n × n matrix T . A matrix entry ti,j
records the number of saccades whose launch site falls within word i and landing site falls within word j. With a total of 11,616 possible transitions in the Fixed Text sentences, the resulting feature set contains 9,077 features with a non-zero value for at least one participant for MET, and 8,132 such features for TOEFL.
Words in Fixed Context (WFC)
This feature set was previously used in Berzak et al. (2017) and consists of reading times for words within fixed contexts. We extract FP and TF du-rations for the 900 words in the Fixed Text sen-tences, resulting in a total of 1,800 WFC features.
4 English Proficiency Scoring Based on Eye Movements in Reading
We hypothesize that language proficiency influ-ences the way that learners process a second lan-guage, which in turn will be reflected in eye move-ment patterns in reading. Specifically, we propose to examine whether the more proficient is an ESL learner, the more similar are their reading patterns to those of native English speakers. We opera-tionalize the notion of native-like reading in the following manner. First, given a feature represen-tation of choice and a dataset D comprising ESL learners DL2and native speakers DL1we Z score
each feature in D using a Z scaler derived from
DL2. We then obtain a prototype feature vector of
native reading vL1by averaging the feature vectors
of the native speakers. vL1= 1 |DL1| X y∈DL1 vy (2)
Finally, we obtain an eyetracking based profi-ciency score of an ESL learner by computing the cosine similarity of their feature vector to the na-tive reading prototype. Hereafter we refer to this measure as EyeScore.
EyeScorey∈DL2 = vy· vL1
kvykkvL1k (3)
Reading Speed Normalization To reduce bias towards fast readers, the feature representations used for Eyescore are normalized to be invariant to the reading speed of the participant. Specifically, for the S-Clusters and WFC feature sets we fol-low the normalization procedure of Berzak et al. (2017), where for a given participant, the reading time of a word wiaccording to a fixation metric M
is normalized by SM,C, the metric’s fixation time
per word in the linguistic context C: SM,C = 1 |C| X w∈C Mw (4)
The linguistic context is defined as the surround-ing sentence in the Fixed Text regime, and the en-tire textual input in the Any Text regime. The nor-malized fixation time is then obtained as:
M normwi =
Mwi
SM,C (5)
For the WC-Coefficients features we take into ac-count only the 15 model coefficients, and omit the 5 intercept features which capture the reading speed of the participant. Finally, we also normal-ize the Transitions features matrix T by the to-tal number of saccades in the sentence to obtain Tnormin whichPi,jtnormi,j = 1.
4.1 Correlation with MET and TOEFL We evaluate the ability of EyeScore to capture language proficiency by comparing it against our two external proficiency tests, MET and TOEFL. Table 1 presents the Pearson’s r correlation of EyeScore with MET and TOEFL for the feature sets described in section 3 using the MET train-ing/development set and all the participants who took TOEFL.
MET TOEFL
Features Fixed Any Fixed Any
Reading Speed 0.28 0.27 0.15 0.13
WP-Coefficients 0.38 0.37 0.21 0.13
S-Clusters 0.45 0.48 0.50 0.45
Transitions 0.45 NA 0.44 NA
WFC 0.50 NA 0.54 NA
Table 1: Pearson’s r of EyeScore for different feature sets with MET (training/development set, 88 partici-pants) and TOEFL (all 53 participartici-pants). Fixed denotes the Fixed Text regime in which all the participants read the same sentences, and Any denotes the Any Text regime where different readers read different sentences.
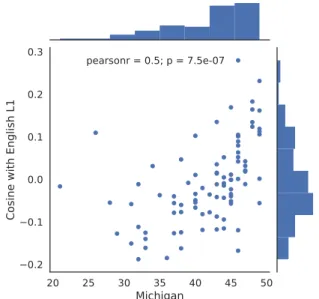
The strongest correlations, 0.5 for MET and 0.54 for TOEFL, are obtained in the Fixed Text regime using the WFC features. This outcome confirms the effectiveness reading time compar-isons when the presented sentences are shared across participants. To illustrate the quality of this result, Figure 2 presents a comparison of EyeScore and MET scores in the Fixed Text and WFC features setup. We further note good per-formance of the Transitions and S-Clusters fea-tures in this regime across both proficiency tests. The strongest performance in the Any Text regime is obtained using the S-Clusters features, yielding 0.48 correlation with MET and 0.45 correlation with TOEFL. These results are competitive with the WFC feature set in the Fixed Text regime, sug-gesting that reliable EyeScores can be obtained even when no prior eyetracking data is available for the sentences presented to the test taker.
In order to contextualize the correlations ob-tained with the EyeScore approach, we first com-pare our results to raw reading speed, an informa-tive baseline which does not rely on eyetracking. EyeScore substantially outperforms this baseline for nearly all the feature sets on both MET and TOEFL, clearly showing the benefit of eye move-ment information for our task. Next, we consider possible upper bounds for our correlations. While obtaining such upper bounds is challenging, we can use correlations between different traditional standardized proficiency tests as informative refer-ence points. First, as mentioned previously, in our dataset the MET and reported TOEFL scores have a Pearson’s r correlation of 0.74. We further note an external study conducted by the testing com-pany Education First (EF) which measured the correlation of their flagship standardized English
20 25 30 35 40 45 50 Michigan −0.2 −0.1 0.0 0.1 0.2 0.3 C os in e w it h En gl is h L1 pearsonr = 0.5; p = 7.5e-07
Figure 2: Comparison of MET (training/development set, 88 participants) with EyeScore using Words in Fixed Context (WFC) features in the Fixed Text regime.
proficiency test EFSET-PLUS with TOEFL-iBT (Luecht,2015). Using 384 participants who took both tests, the study found a Pearson’s r of 0.63 for the reading comprehension and 0.69 for the listen-ing comprehension sections of these tests. Despite the radical difference of our testing methodology, our strongest feature sets obtain rather competi-tive results relacompeti-tive to these correlations, further strengthening the evidence for the ability of our approach to capture language proficiency.
5 Predicting Performance on MET and TOEFL
In section4 we introduced EyeScore as an inde-pendent metric of language proficiency which is based on eye movements during reading. Here, we examine whether eye movements can also be used to explicitly predict the performance of partici-pants on specific external standardized language proficiency tests. This task is of practical value for development of predictive tools for standard-ized proficiency tests, and constitutes an alterna-tive framework for studying the relevance of eye movement patterns in reading to language profi-ciency.
To address this task, we use Ridge regression to predict overall scores on an external proficiency test from eye movement features in reading. The model parameters θ are obtained by minimizing
MET TOEFL
Fixed Any Fixed Any
Features r MAE r MAE r MAE r MAE
Reading Speed 0.27 4.58 0.24 4.62 0.09 7.92 0.06 7.96
WP-Coefficients 0.43 4.11 0.44 4.14 0.34 7.76 0.31 7.49
S-Clusters 0.56 3.87 0.49 4.11 0.55 7.45 0.50 7.76
Transitions 0.52 3.93 NA NA 0.38 7.11 NA NA
WFC 0.70 3.31 NA NA 0.50 6.68 NA NA
Table 2: Pearson’s r and Mean Absolute Error (MAE) for prediction of MET scores (test set, 57 participants) and TOEFL scores (leave-one-out cross validation, all 53 participants) from eye movement patterns in reading. We consider two baselines which do not use eyetracking information: (1) the average proficiency score in the training set, which yields 4.82 MAE on MET and 8.29 MAE on TOEFL, and (2) the reading speed of the participant.
the following loss objective: X
i
(yi− θ · f(xi))2+ λkθk22 (6)
where yi is a participant’s test score, xi is their
eye movement record, and f(xi)are the extracted
eye movement features. To calibrate the model with respect to native English speakers, we aug-ment each training set DL2tr with the group of 37
native speakers DL1whose proficiency scores are
assigned to the maximum grade of the respective test (50 for MET and 60 for TOEFL)3. Based on
MET performance on the train/dev set, the features used for predicting scores on both tests are not nor-malized for speed4. As a preprocessing step, we
fit a Z scaler for each feature using the ESL par-ticipants in the training set, and apply it to all the participants in the training and test sets.
Results
We evaluate prediction accuracy using Pearson’s r and Mean Absolute Error (MAE) from the true proficiency test scores. The λ parameter for MET is optimized for MAE on 10 fold cross validation within the training/development set. For TOEFL, which has a relatively small number of partici-pants, we report results on leave-one-out cross val-idation with λ set to 1.
Table2presents the results for both proficiency tests. We consider two baselines; the first is as-signing all test set participants with the average
3Our experiments on the training/development set
indi-cate that this training data augmentation step leads in most cases to improved regression performance.
4We note that in line with the low correlation of reading
speed with TOEFL, speed normalized features tend to be bet-ter predictors of TOEFL scores, obtaining r 0.59 and MAE 6.47 with WFC features in the Fixed Text regime, and r 0.58 and MAE 7.19 with S-Clusters in the Any Text regime.
20 30 40 50
True Michigan Score 30 35 40 45 50 Pr ed ic te d M ic hi ga n Sc or e pearsonr = 0.7; p = 1e-09
Figure 3: Comparison of MET scores (test set, 57 par-ticipants) with predicted MET scores using Words in Fixed Context (WFC) eye movement features in the Fixed Text regime.
score of the training participants. This baseline yields an MAE of 4.82 on MET and 8.29 on TOEFL. The second baseline uses reading speed as the sole feature for prediction. In all cases, our eyetracking based features outperform the average score and reading speed baselines.
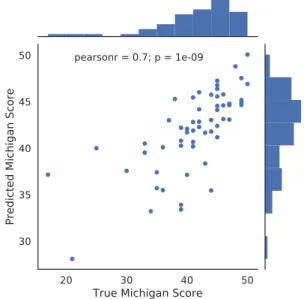
The performance of the different feature sets is in most cases consistent across the two proficiency tests and is largely in line with the correlations of EyeScore reported in Table 1. Similarly to the EyeScore outcomes, the best performance in the Fixed Text regime is obtained using the WFC fea-ture set, with a Pearson’s r of 0.7 and MAE of 3.31 for MET. This result is highly competitive with correlations between different standardized English proficiency tests. Figure3depicts a
com-parison between MET scores and our MET predic-tions in this setup. On TOEFL, WFC features ob-tain the strongest MAE of 6.68, while S-Clusters have a higher r coefficient of 0.55.
In the Any Text regime, differently from Eye-Score, we obtain comparable results for the S-Clusters and WP-Coefficients feature sets. Over-all, the improvements of both feature sets over the baselines in the Any Text regime further support the ability of type-level features to generalize the task of language proficiency prediction to arbitrary sentences.
6 Related Work
Our work lies on the intersection of language proficiency assessment, second language acquisi-tion (SLA), the psychology of reading and NLP. Automated language proficiency assessment from free-form linguistic performance has been stud-ied mainly in language production (Dikli, 2006; Williamson, 2009; Shermis and Burstein, 2013). Over the past several decades, multiple essay and speech scoring systems have been developed for learner language using a wide range of linguis-tically motivated feature sets (e.g. Lonsdale and Strong-Krause, 2003; Landauer, 2003; Xi et al., 2008;Yannakoudakis et al.,2011). Some of these systems have been deployed in official language proficiency tests, for example the e-rater essay scoring system (Attali and Burstein,2004) used in TOEFL (Ramineni et al.,2012). While this line of work focuses on assessment of language produc-tion, here we introduce and address for the first time automated language assessment during on-line language comprehension.
In SLA, there has been considerable interest in eyetracking, where studies have mostly focused on controlled experiments examining processing of specific linguistic phenomena such as syntactic ambiguities, cognates and idioms (Dussias,2010; Roberts and Siyanova-Chanturia, 2013). A no-table exception is (Cop et al.,2015) who used free-form reading to study differences in fixation times and saccade lengths between native and non-native readers. Our work also adopts broad coverage analysis of reading patterns, which we use to for-mulate predictive models of language proficiency. Our study draws on a large body of work in the psychology of reading (seeRayner,1998;Rayner et al., 2012, for overview) which has suggested that eye movement patterns during reading are
sys-tematically influenced by a broad range of lin-guistic characteristics of the text, and reflect how readers mentally engage with the text (Frazier and Rayner,1982;Rayner and Frazier,1989;Reichle et al., 1998; Engbert et al., 2005; Demberg and Keller, 2008; Reichle et al., 2009; Levy et al., 2009, among many others). Prior work on read-ing has also demonstrated that gaze provides valu-able information about various characteristics of the reader and their cognitive state. For example, Reichle et at. (2010) have shown that eye move-ment patterns are categorically different in atten-tive versus mindless reading. In Rello and Balles-teros (2015) eye movements were used to distin-guish between readers with and without dyslexia. Berzak et al. (2017) collected the dataset used in our work and used it to predict the first language of non-native English readers from gaze. We build on these studies to motivate our task and design fea-ture representations which encode linguistic fac-tors known to affect the human reading process.
Related work in NLP developed predictive models of reading times in reading of free-form text (e.g. Nilsson and Nivre, 2009; Hara et al., 2012;Hahn and Keller,2016). In a complemen-tary vein, eyetracking signal has been used for linguistic annotation tasks such as POS tagging (Barrett and Søgaard,2015a;Barrett et al.,2016) and prediction of syntactic functions (Barrett and Søgaard,2015b). Both lines of investigation pro-vide further epro-vidence for the tight interaction be-tween eye movements and linguistic properties of the text, which we leverage in our work for infer-ence about the linguistic knowledge of the reader.
7 Conclusion and Discussion
We present a novel approach for automated assess-ment of language proficiency which relies on eye movements during reading of free-form text. Our EyeScore test captures the similarity of language learners’ gaze patterns to those of native speak-ers, and correlates well with the standardized tests MET and TOEFL. A second variant of our ap-proach accurately predicts participants’ scores on these two tests. To the best of our knowledge, the proposed framework is the first proof-of-concept for a system which utilizes eyetracking to measure linguistic ability.
In future work, we plan to extend the analysis of the validity and consistency of our approach, and further explore its applications for language
proficiency evaluation. In particular, we will ex-amine the impact of factors that can undermine the validity of language proficiency tests, such as test specific training, familiarity with the evalua-tion system’s features (Powers et al., 2002), and cheating via unauthorized prior access to test ma-terials. Since participants are less likely to be able to manipulate their eye movements in an in-formed and systematic manner—readers are gen-erally not even aware that their eye movements are saccadic—and since our test can be performed on arbitrary sentences, we expect it to be robust to prior exposure to the test materials and test-ing methodology. We will further study the con-sistency of our scores for repeated tests by the same participants. A preliminary split-half analy-sis indicates that eyetracking based scores are ex-pected to be highly consistent across tests. Fi-nally, our approach can be combined with tradi-tional proficiency testing methodologies, whereby gaze will be recorded while the participant is tak-ing a standardized language proficiency test. This will enable developing novel approaches to lan-guage proficiency assessment which will integrate task based performance with real time monitoring of cognitive and linguistic processing.
Acknowledgments
This material is based upon work supported in part by the Center for Brains, Minds, and Ma-chines (CBMM), funded by NSF STC award CCF-1231216.
References
Yigal Attali and Jill Burstein. 2004. Automated essay scoring with e-rater v. 2.0. ETS Research ReportR
Series 2004(2).
Maria Barrett, Joachim Bingel, Frank Keller, and An-ders Søgaard. 2016. Weakly supervised part-of-speech tagging using eye-tracking data. In ACL. vol-ume 2, pages 579–584.
Maria Barrett and Anders Søgaard. 2015a. Reading behavior predicts syntactic categories. In CoNLL. pages 345–349.
Maria Barrett and Anders Søgaard. 2015b. Using read-ing behavior to predict grammatical functions. In Proceedings of the Sixth Workshop on Cognitive As-pects of Computational Language Learning. pages 1–5.
Yevgeni Berzak, Chie Nakamura, Suzanne Flynn, and Boris Katz. 2017. Predicting native language from gaze. In ACL. pages 541–551.
Eugene Charniak, Don Blaheta, Niyu Ge, Keith Hall, John Hale, and Mark Johnson. 2000. BLLIP 1987-89 WSJ corpus release 1. Linguistic Data Consor-tium, Philadelphia 36.
Uschi Cop, Denis Drieghe, and Wouter Duyck. 2015. Eye movement patterns in natural reading: A com-parison of monolingual and bilingual reading of a novel. PLOS ONE 10(8):1–38.
Vera Demberg and Frank Keller. 2008. Data from eye-tracking corpora as evidence for theories of syntactic processing complexity. Cognition 109(2):193–210. Semire Dikli. 2006. An overview of automated scoring
of essays. The Journal of Technology, Learning and Assessment 5(1).
Paola E Dussias. 2010. Uses of eye-tracking data in second language sentence processing research. An-nual Review of Applied Linguistics 30:149–166. Ralf Engbert, Antje Nuthmann, Eike M Richter, and
Reinhold Kliegl. 2005. Swift: a dynamical model of saccade generation during reading. Psychological Review 112(4):777.
Lyn Frazier and Keith Rayner. 1982. Making and cor-recting errors during sentence comprehension: Eye movements in the analysis of structurally ambiguous sentences. Cognitive Psychology 14(2):178–210. Michael Hahn and Frank Keller. 2016. Modeling
hu-man reading with neural attention. In EMNLP. pages 85–95.
John Hale. 2001. A probabilistic Earley parser as a psycholinguistic model. In NAACL. Association for Computational Linguistics, pages 1–8.
Tadayoshi Hara, Daichi Mochihashi, Yoshinobu Kano, and Akiko Aizawa. 2012. Predicting word fixations in text with a CRF model for capturing general read-ing strategies among readers. In Proceedread-ings of the 1st Workshop on Eye-tracking and Natural Lan-guage Processing. pages 55–70.
IELTS. 2017. International English language testing system — Wikipedia, the free encyclopedia. On-line; accessed November 2017. https://en. wikipedia.org/wiki/International_ English_Language_Testing_System. Albrecht Werner Inhoff and Keith Rayner. 1986.
Parafoveal word processing during eye fixations in reading: Effects of word frequency. Perception & Psychophysics 40(6):431–439.
Reinhold Kliegl, Ellen Grabner, Martin Rolfs, and Ralf Engbert. 2004. Length, frequency, and predictabil-ity effects of words on eye movements in reading. European Journal of Cognitive Psychology 16(1-2):262–284.
Thomas K Landauer. 2003. Automated scoring and an-notation of essays with the Intelligent Essay Asses-sor. Automated essay scoring: A crossdisciplinary perspective .
Roger Levy. 2008. Expectation-based syntactic com-prehension. Cognition 106(3):1126–1177.
Roger Levy, Klinton Bicknell, Tim Slattery, and Keith Rayner. 2009. Eye movement evidence that readers maintain and act on uncertainty about past linguis-tic input. Proceedings of the National Academy of Sciences 106(50):21086–21090.
Deryle Lonsdale and Diane Strong-Krause. 2003. Au-tomated rating of ESL essays. In Proceedings of the HLT-NAACL Workshop on Building Educational Applications using Natural Language Processing -Volume 2. Association for Computational Linguis-tics, pages 61–67.
Richard M Luecht. 2015. EFSET PLUS - TOEFL iBT correlation study report.
https://www.efset.org/research/ ˜/media/centralefcom/efset/pdf/ EFSET_TOEFL_correlational_report_ Sep_v1.pdf.
Steven G Luke and Kiel Christianson. 2016. Limits on lexical prediction during reading. Cognitive Psy-chology 88:22–60.
Mitchell P Marcus, Mary Ann Marcinkiewicz, and Beatrice Santorini. 1993. Building a large annotated corpus of English: The Penn Treebank. Computa-tional Linguistics 19(2):313–330.
Ryan McDonald, Joakim Nivre, Yvonne Quirmbach-Brundage, Yoav Goldberg, Dipanjan Das, Kuzman Ganchev, Keith Hall, Slav Petrov, Hao Zhang, Os-car T¨ackstr¨om, et al. 2013. Universal dependency annotation for multilingual parsing. In ACL. Mattias Nilsson and Joakim Nivre. 2009. Learning
where to look: Modeling eye movements in read-ing. In Proceedings of the Thirteenth Conference on Computational Natural Language Learning. Associ-ation for ComputAssoci-ational Linguistics, pages 93–101. Slav Petrov, Dipanjan Das, and Ryan McDonald. 2012.
A universal part-of-speech tagset. In LREC. Alexander Pollatsek, Barbara J Juhasz, Erik D Reichle,
Debra Machacek, and Keith Rayner. 2008. Immedi-ate and delayed effects of word frequency and word length on eye movements in reading: a reversed de-layed effect of word length. Journal of Experimental Psychology: Human Perception and Performance 34(3):726.
Donald E Powers, Jill C Burstein, Martin Chodorow, Mary E Fowles, and Karen Kukich. 2002. Stumping e-rater: challenging the validity of automated essay scoring. Computers in Human Behavior 18(2):103– 134.
Chaitanya Ramineni, Catherine S Trapani, David M Williamson, Tim Davey, and Brent Bridgeman. 2012. Evaluation of the e-rater scoring engine forR
the TOEFL independent and integrated prompts.R
ETS Research Report Series 2012(1).
Keith Rayner. 1998. Eye movements in reading and information processing: 20 years of research. Psy-chological Bulletin 124(3):372.
Keith Rayner, Jane Ashby, Alexander Pollatsek, and Erik D Reichle. 2004. The effects of frequency and predictability on eye fixations in reading: implica-tions for the ez reader model. Journal of Experi-mental Psychology: Human Perception and Perfor-mance 30(4):720.
Keith Rayner and Lyn Frazier. 1989. Selection mech-anisms in reading lexically ambiguous words. Jour-nal of Experimental Psychology: Learning, Mem-ory, and Cognition 15(5):779.
Keith Rayner, Alexander Pollatsek, Jane Ashby, and Charles Clifton Jr. 2012. Psychology of reading. Psychology Press.
Keith Rayner, Timothy J Slattery, Denis Drieghe, and Simon P Liversedge. 2011. Eye movements and word skipping during reading: effects of word length and predictability. Journal of Experimental Psychology: Human Perception and Performance 37(2):514.
Keith Rayner and Arnold D Well. 1996. Effects of con-textual constraint on eye movements in reading: A further examination. Psychonomic Bulletin & Re-view 3(4):504–509.
Erik D Reichle, Alexander Pollatsek, Donald L Fisher, and Keith Rayner. 1998. Toward a model of eye movement control in reading. Psychological Review 105(1):125.
Erik D Reichle, Andrew E Reineberg, and Jonathan W Schooler. 2010. Eye movements during mindless reading. Psychological Science 21(9):1300–1310. Erik D Reichle, Tessa Warren, and Kerry McConnell.
2009. Using ez reader to model the effects of higher level language processing on eye movements during reading. Psychonomic Bulletin & Review 16(1):1– 21.
Luz Rello and Miguel Ballesteros. 2015. Detecting readers with dyslexia using machine learning with eye tracking measures. In Proceedings of the 12th Web for All Conference. ACM, page 16.
Leah Roberts and Anna Siyanova-Chanturia. 2013. Using eye-tracking to investigate topics in L2 acqui-sition and L2 processing. Studies in Second Lan-guage Acquisition 35(02):213–235.
Beatrice Santorini. 1990. Part-of-speech tagging guidelines for the Penn Treebank project (3rd revi-sion). Technical Reports (CIS) .
Mark D Shermis and Jill Burstein. 2013. Handbook of automated essay evaluation: Current applications and new directions. Routledge.
Nathaniel J Smith and Roger Levy. 2013. The effect of word predictability on reading time is logarithmic. Cognition 128(3):302–319.
Andreas Stolcke et al. 2002. SRILM - an extensible language modeling toolkit. In Interspeech. volume 2002, page 2002.
David M Williamson. 2009. A framework for imple-menting automated scoring. In Annual Meeting of the American Educational Research Association and the National Council on Measurement in Education, San Diego, CA.
Xiaoming Xi, Derrick Higgins, Klaus Zechner, and David M Williamson. 2008. Automated scoring of spontaneous speech using SpeechRaterSM v1. 0. ETS Research Report Series 2008(2).
Helen Yannakoudakis, Ted Briscoe, and Ben Medlock. 2011. A new dataset and method for automatically grading ESOL texts. In ACL. pages 180–189.