Publisher’s version / Version de l'éditeur:
Vous avez des questions? Nous pouvons vous aider. Pour communiquer directement avec un auteur, consultez la
première page de la revue dans laquelle son article a été publié afin de trouver ses coordonnées. Si vous n’arrivez pas à les repérer, communiquez avec nous à PublicationsArchive-ArchivesPublications@nrc-cnrc.gc.ca.
Questions? Contact the NRC Publications Archive team at
PublicationsArchive-ArchivesPublications@nrc-cnrc.gc.ca. If you wish to email the authors directly, please see the first page of the publication for their contact information.
https://publications-cnrc.canada.ca/fra/droits
L’accès à ce site Web et l’utilisation de son contenu sont assujettis aux conditions présentées dans le site LISEZ CES CONDITIONS ATTENTIVEMENT AVANT D’UTILISER CE SITE WEB.
Proceedings of 61st Canadian Water Resources Association Annual Conference: Managing the Health of Canadian Lakes and Rivers: 16 June 2008, Gimli,
Manitoba, pp. 1-25, 2008-06-16
READ THESE TERMS AND CONDITIONS CAREFULLY BEFORE USING THIS WEBSITE. https://nrc-publications.canada.ca/eng/copyright
NRC Publications Archive Record / Notice des Archives des publications du CNRC :
https://nrc-publications.canada.ca/eng/view/object/?id=4c6a4f2e-f6b6-4972-b9e0-d1695874f594 https://publications-cnrc.canada.ca/fra/voir/objet/?id=4c6a4f2e-f6b6-4972-b9e0-d1695874f594
NRC Publications Archive
Archives des publications du CNRC
This publication could be one of several versions: author’s original, accepted manuscript or the publisher’s version. / La version de cette publication peut être l’une des suivantes : la version prépublication de l’auteur, la version acceptée du manuscrit ou la version de l’éditeur.
Access and use of this website and the material on it are subject to the Terms and Conditions set forth at
A Comprehensive water quality monitoring in urban stormwater detention ponds
http://irc.nrc-cnrc.gc.ca
A c o m p r e h e n s i v e w a t e r q u a l i t y m o n i t o r i n g i n
u r b a n s t o r m w a t e r d e t e n t i o n p o n d s
N R C C - 5 0 5 8 9
W a n g , D . ; C o s s i t t , K . ; D o r m u t h , D .
A version of this document is published in / Une version de ce document se trouve dans: Proceedings of 61st Canadian Water Resources Association Annual Conference:
Managing the Health of Canadian Lakes and Rivers, Gimli, Manitoba, June 16-19, 2008, pp. 1-25
The material in this document is covered by the provisions of the Copyright Act, by Canadian laws, policies, regulations and international agreements. Such provisions serve to identify the information source and, in specific instances, to prohibit reproduction of materials without written permission. For more information visit http://laws.justice.gc.ca/en/showtdm/cs/C-42
Les renseignements dans ce document sont protégés par la Loi sur le droit d'auteur, par les lois, les politiques et les règlements du Canada et des accords internationaux. Ces dispositions permettent d'identifier la source de l'information et, dans certains cas, d'interdire la copie de documents sans permission écrite. Pour obtenir de plus amples renseignements : http://lois.justice.gc.ca/fr/showtdm/cs/C-42
A COMPREHENSIVE WATER QUALITY MONITORING IN URBAN STORMWATER DETENTION PONDS
Dunling Wang1, Karen Cossitt2 and Darryl Dormuth3 Centre for Sustainable Infrastructure Research
Institute for Research in Construction, National Research Council of Canada
Abstract: During the summer of 2007, a monitoring program was carried out with comprehensive water sampling and deployment of YSI 2200V2 multi-sensor sondes for continuous water quality monitoring in two stormwater detention ponds in Regina, SK. One pond (referred to as the south pond) was built in a mature neighborhood with the primary function of detaining stormwater runoff during heavy rainfall events. The second pond (north pond) is located in a newly developing neighborhood and is a constructed wetland, built not only to detain stormwater runoff, but also to improve its quality before being discharged into a nearby creek. The north pond was planned to allow growth of vegetation and other aquatic species, which simulate a shallow prairie marsh. Chemical compositions of the water in the south pond were consistent between the inlet and the outlet. However, in the north pond significant reductions from the inlet to the outlet were observed in alkalinity, total hardness, total dissolved solids and nutrient levels. The south pond had lower average concentrations of suspended solids and major ions in comparison with the north pond. The north pond also had higher average concentrations in total nitrogen, nitrate and total phosphorus (TP), while the south pond had a significantly
1
Corresponding author. Research Officer, National Research Council Centre for Sustainable Infrastructure Research (NRC-CSIR), 301-6 Research Drive, Regina, SK, Canada S4S 7J7, Phone (306) 780-8698, Fax (306) 780-3421, Dunling.Wang@nrc-cnrc.gc.ca
2
Technical Officer, NRC-CSIR. Currently, Senior Engineer, Planning and Development Division, City of Regina.
3
higher ortho-phosphorus, which seemed to relate to the difference in the maturity of the landscapes and fertilizer applications. The low nitrate and high TP seemed to contribute to severe blue-green algae blooming in the south pond in July. Peak concentrations of total coliform, Escherichia coli (E. coli) and fecal streptococcus in both ponds were closely related to the rainfall events that occurred during the monitoring period. A significant reduction in the bacterial quantities was observed from the inlet to outlet in both ponds. Test results also support the conclusion that the wetland design of the north pond is efficient in removing nutrients and some other urban contaminants.
Introduction
In the City of Regina, stormwater runoff from all the City’s proximities is transported into the Wascana Creek through outlet infrastructure, including smaller creeks,
stormwater channels and storm trunk sewers. To manage the quantity of runoff and to reduce pressure to these outlet infrastructures, stormwater detention ponds were constructed to collect stormwater runoff from adjacent neighborhoods to retard the outflow during snowmelt and storm events. Some detention ponds were built with a primary function of detaining stormwater runoff during heavy rainfall events, while others were constructed not only to detain stormwater runoff but also aimed to reduce urban contaminant levels before discharging the water into the nearby creeks.
Besides aesthetically pleasing to adjacent community residents, stormwater detention ponds have become a significant part of the urban ecosystem and play a critical role not only in retarding stormwater outflow, but also in holding water that can be potentially used for various urban activities, such as irrigation of open space, landscaping and
ponds. However, stormwater contains various urban contaminants, including debris (e.g., pavement, wood, metals, salt, sand, silt, and leaves, biological agents (e.g. bacteria and virus from bird and animal wastes), chemicals (e.g. pesticides, herbicides and
hydrocarbons), nutrients (nitrogen and phosphorus), lubricating oil and grease.
Stormwater pollution has resulted in severe degradation of urban receiving water (U.S. EPA, 1983; Massal, et al., 2007; Nazahiyah et al., 2007). As a result, government policies have been developed for management of stormwater and for the control of stormwater pollution (Bowen et al., 1993; City of Calgary, 2000) and many stormwater management practices have been proposed (Urbonas, 1993). A stormwater detention pond is one of most widely used management practices (City of Calgary, 2000; MOEE, 1994).
Increasing demands on municipal water use, particularly in semi-arid regions such as the Prairie regions in Canada and United States, and lack of source water supplies have presented stormwater as a viable resource in urban settings.
A comprehensive monitoring program was carried out in two stormwater detention ponds in Windsor Park, City of Regina, Saskatchewan. The distance between the two detention ponds is less than 1 km (Fig 1). The south pond was built in 1987 and is located in a well-established residential properties and parks with fully developed landscapes. The south pond is about 270 m long and runs in a south-north direction with two inlets located at the north and south ends separately and one outlet at the southwestern location. The pond has a surface water area of 21,000 m2 and a constant operation depth of 1.8 m. The north pond is a new constructed wetland, built in 2005. The north pond is located in a
developing residential neighborhood with intensive construction still ongoing. The pond is about 255 m long and runs in a direction from southeast to northwest. This pond also
has two inlets, one located at the east end and the other located in the middle part of north side. The outlet of the pond is located at the west end. The pond has a surface water area of 9,000 m2 and a contoured bottom, resulting in operation depths varying 0.5 to 2.7 m. The deeper areas are near the inlet and the outlet locations. The objectives of this study include: 1) to monitor water quality in two different ponds as affected by storm events; 2) to compare the effects of different urban neighborhoods on pollutant loads, including nutrients, salt and pathogens (total coliform, E. coli and fecal streptococci as indicators); and 3) to measure water quality changes in the detention ponds and the growth of diatom and blue green algae (BGA). In this paper, we present the first year’s results from this monitoring program.
Data collection
Stormwater quality monitoring was conducted through analyses of collected water samples and the deployment of four YSI 2200V2 multi-sensor sonde systems that continuously measure water quality changes. Two water samples were taken from each pond every two weeks, one from the inlet area and the other from the outlet area. These samples were consistently taken from 10 cm depth below pond surface to avoid
influences by floating debris and plankton. In addition, four sets of samples were also collected at three different depths (10 cm above pond bottom, mid-depth and 10 cm below the pond surface) to investigate the vertical variations of water quality in the detention ponds. The samples for water chemistry testing were collected in 4 L plastic containers, while the samples for bacteriological testing were collected in 220 mL sterilized containers, which are provided by the Saskatchewan Disease Control
Laboratory (SDCL). After collection, the samples were immediately stored in coolers and transported to the SDCL for physical, chemical and microbiological analysis. The test parameters include pH, conductivity, total alkalinity, total dissolved solids (TDS), total suspended solids (TSS), hardness, calcium, potassium, sodium, magnesium, sulfate, chloride, biochemical oxygen demand (BOD), dissolved organic carbon (DOC), nitrate, total Kjeldahl nitrogen (TKN), ortho-phosporus (OP), total phosphorus (TP), chlorophyll-A, total coliform (TC), E. coli and fecal streptococci (FS).
Windsor Park
InletsInlets Sonde location Outlet Outlet
North Pond
South Pond
Fig 1. The selected detention ponds and their inlet and outlet locationsFour battery-powered YSI 6600V2 multi-sensor sonde systems were deployed into the detention ponds for continuous water quality monitoring. Each sonde contains 2 electrode probes that measure temperature, pH, conductivity and total dissolved solids, and 4 optical sensors that measure turbidity, dissolved oxygen, blue-green algae and chlorophyll. Data are collected at a time interval of 15 min. to capture water quality changes, particularly during the storm events. The sonde probes can function at water temperatures from -5 to 45 ˚C, at a maximum depth of 9 m (30 ft.). The sonde locations were chosen in the general area of the inlet and outlet, near where the grab samples were taken (Fig 1). When deployed, the sonde was hidden and protected in a 0.9 m (3 ft.) open-end stainless steel pipe, with 10 rows of 25 mm (1 in.) diameter holes (22 holes in each row) drilled into the pipe to allow water to flow through them. The sonde house was vertically suspended at a depth of 1.2 to 1.5 m (4 to 5 ft) below the water surface, under a submerged buoy, which was anchored by 70-kg metal weights. The sonde housing unit was designed to provide a secure and stable docking station for free movement of water around the sensors while preventing theft, vandalism and incident damage. The vertical deployment allows for sensors to point downward, minimizing the effect of daylight on measurements, particularly the optical sensors. In the meantime, this also avoids settlement of suspended solids on the probes. The sondes stayed in the field for the entire monitoring season from June to October. Data downloads and battery changes took place every 2 weeks. During data download field work, the sensors were visually inspected and any necessary maintenance and calibrations were performed.
Results and discussion
Climatic conditions
Regina has a semi-arid continental climate with warm, slightly moist summers and cold, dry winters. Average annual precipitation is 390mm with the most rainfall occurring June to August. June is the wettest month with monthly average precipitation of 75mm. The average daily temperature for the year is 2.8°C, with July and August being the hottest months. In 2007, the total precipitation was 274mm with major rainfalls occurring in May. May had a total precipitation of 81.5 mm, which was almost 80% more than normal. August was also wetter than normal. The other months were drier than normal. For example, for the month of June, the total precipitation was only 21.4mm, which was only 30% of the normal rainfall (Table 1). The average temperature during this period was 0.83 ˚C higher than normal. In particular, July had an average temperature of 21.9˚C, which was 3.2˚C higher than the normal monthly average (Table 1). The relatively drier and hotter climatic conditions affected stormwater quality in the detention ponds as discussed in this paper.
Table 1. Rainfall events (with >4mm rainfall) during the monitoring period and comparison of 2007 climatic condition with long-term average
Month May June July Aug Sep Oct
Day 3 13 14 21 23 31 14 17 9 21 25 6 10 18 5 6 Precipitation* (mm) 4.4 11.9 6.4 18.1 24 11.6 4.8 9.7 9.0 17.5 4.3 25.7 16.1 5.7 5.4 4.4 Total rainfall* 2007 (mm) 81.5 21.4 33.8 52.2 12.8 15.6 Average rainfall (mm)** 45.4 71.3 55.0 43.6 34.4 18.4 Average temp - 2007 (˚C)* 11.5 16.0 21.9 16.5 11.7 6.1 Normal temp (˚C)** 10.9 15.6 18.7 17.5 11.3 4.7
*Data from Environment Canada. http://www.climate.weatheroffice.ec.gc.ca/.
Vertical variation
Water samples that were taken near the inlet and the outlet locations from three different depths (top, mid- and bottom) were analyzed to examine the vertical variations of water quality in the detention ponds. Samples collection occurred on July 25, four days after a significant rainfall on July 21. Test results showed that the south pond had relatively uniform physical and chemical properties that did not change with depth (Table 2). The results reflect the construction feature of this pond, in which the unique depth allows stormwater runoff to be mixed well quickly, particularly the two inlets being located at the two ends. Higher than normal TKN and nitrate-N levels observed on July 25 were resulted from an application of 100 kg of ammonia nitrate (NH4NO3) on July 23 by the
City to control blue green algal growth. Before the application, the concentration of TKN had ranged from 1.2 to 1.8 mg/L and nitrate-N below detection limit (<0.04 mg/L). Chlorophyll-A concentration and bacterial indicators (TC, E. coli and FS) were highly variable, and did not show a trend.
In the north pond, water quality varied with locations and depths (Table 2). Higher concentrations for most monitored parameters were observed near the inlet location compared to the outlet location. This is expected because the pond’s design allows for physical settlement and biological activities to occur as the stormwater travels from the inlet to the outlet. During the process, concentration of any contaminants affected by these physical and biological processes would be expected to reduce. Vertically, a trend of concentration increase from top to bottom was observed for many of the tested parameters at both the inlet and outlet locations. This can be caused by many factors.
Table 2. Variation of water quality with depth on July 25th, four days after 17.5 mm rainfall on July 21.
Parameter South pond North pond
Inlet Outlet Inlet Outlet
Top Mid- Bottom Top Mid- Bottom Top Mid- Bottom Top Mid- Bottom
pH 8.6 8.6 8.5 8.5 8.5 8.5 8.4 8.3 8.2 9.2 8.9 8.4 Conductivity(µS/cm) 1044 1045 1055 1057 1057 1057 989 1678 1932 1116 1131 1272 TDS1 (mg/L) 788 786 800 797 800 797 712 1332 1559 784 809 939 TSS2 (mg/L) 28.0 26.0 27.0 27.0 28.0 26.0 23.0 24.0 20.0 4.0 5.0 9.0 Cl (mg/L) 58.6 58.3 58.9 59.1 59.3 58.9 63.5 110.2 128.6 80.1 81.7 93.7 SO4(mg/L) 345 344 347 350 353 350 345 673 788 420 426 482 Ca(mg/L) 88.0 88.0 90.0 88.0 88.0 87.0 77.0 150.0 176.0 80.0 82.0 95.0 Mg (mg/L) 41.0 41.0 41.0 42.0 41.0 41.0 42.0 78.0 91.0 49.0 50.0 58.0 DOC3 (mg/L) 12.8 12.8 13.0 12.9 12.9 12.7 18.4 21.1 20.4 16.3 16.4 18.2 BOD4 (mg/L) 6.6 6.1 6.7 6.3 6.8 8.7 6.7 9.4 4.3 3.1 3.8 5.9 TKN5 (mg/L) 2.00 2.10 2.20 1.90 2.00 2.00 0.90 1.40 1.30 1.00 1.20 1.50 NO3-N(mg/L) 0.29 0.29 0.30 0.33 0.32 0.35 1.16 3.22 3.63 0.16 0.15 0.06 TP6 (mg/L) 0.21 0.22 0.22 0.20 0.20 0.20 0.10 0.15 0.12 0.07 0.09 0.14 Chlorophyll-A(mg/L) 48.0 47.4 46.8 52.0 55.4 48.6 24.8 93.7 37.0 19.6 33.7 72.9 TC7 (cfu/100 mL) 23100 13500 51200 16100 32300 16000 79400 23800 22800 14600 14600 7701 E. coli(cfu/100 mL) 52 85 246 20 142 41 6131 1178 1046 98 122 20 FS8 (cfu/100 mL) 470 320 30800 220 890 220 10200 3400 2500 130 330 120
1 total dissolved solid; 2total suspended solids; 3 dissolved organic carbon; 4 5-day biochemical oxygen demand; 5 total Kjeldahl nitrogen; 6 total
One of the factors could be vertical stratification in the relative deep areas. In particular, when the samples were taken only 4 days after a major rainfall, physical settlement was still undergoing. Another possible factor could be the different biological activities at various depths, such as the diatoms and water weeds growing at different depths. Given the vertical variations observed, water samples for this study were taken from 10 cm depth below the water surface to maintain consistency and reduce variability caused by sampling depth.
Pond water general chemistry
Chemical analysis indicated that the north pond contained higher concentrations of inorganic ions, including chloride, sulfate, calcium, magnesium and sodium, which caused overall elevated levels in other related parameters, such as conductivity, total dissolved solids and hardness in comparison with the south pond (Table 3). During the monitoring period, concentrations of these inorganic ions had been in a trend of slight to moderate increase in both detention ponds (Fig 2). This trend seems to related to lack of precipitation and hot conditions in the summer months, which caused inorganic ions to concentrate in the ponds as a result of evaporation. The elevated sulfate (SO42-) concentrations reflect the characteristics
of local soils, which include high sulfate component in their profiles. The sulfate has been dissolved in the stormwater and transported to the pond through surface runoff or
Table 3. Seasonal water quality average based on grab samples from the detention ponds
Parameter South Pond
(mean ± sd)
North Pond (mean ± sd)
pH 8.6 ± 0.2 8.8 ± 0.4
Conductivity (μS/cm) 1017 ± 230 1454 ± 468
Total dissolved solids (mg/L) 754± 200 1079 ± 405
Total suspended solid (mg/L) 22.0 ± 7.8 14.5 ± 10.3
Alkalinity (mg/L as CaCO3) 140 ± 27 95 ± 35 Hardness (mg/L as CaCO3) 363 ± 102 554 ± 206 DOC (mg/L) 13.8 ± 2.7 18.2 ± 4.1 BOD (mg/L) 7.1 ± 2.0 4.0 ± 1.8 Chloride (mg/L) 61.7 ± 8.0 105.3 ± 35.9 Fluoride (mg/L) 0.2 ± 0.0 0.2 ± 0.0 Sulfate (mg/L) 316± 110 558 ± 222 Calcium (mg/L) 81 ± 22 111 ± 41 Magnesium (mg/L) 38.9 ± 11.5 67.0 ± 25.8 Sodium (mg/L) 92 ± 21 128 ± 45 Potassium (mg/L) 5.8 ± 0.7 8.4 ± 1.3 Chlorophyll A (mg/L) 53.0 ± 23.4 27.0 ± 18.8
The changes in inorganic ion concentrations were also affected by rainfall events. The initial increase was related to early rainfalls in the season, which occurred in the month of May (Table 1). The runoff collected all types of urban contaminants including the road salt that was used during the winter months. The road salt used in Regina was mainly sodium chloride (NaCl) and it is easily dissolved and transported by the stormwater runoff. Further increases in the inorganic ions were due to the lack of precipitation in the summer months. Strong evaporation caused by the hot conditions in these months also resulted in elevated ion concentrations of the pond water.
North windsor pond near the outlet 0.0 100.0 200.0 300.0 400.0 500.0 600.0 700.0 800.0 900.0
15-May-07 14-Jun-07 14-Jul-07 13-Aug-07 12-Sep-07 12-Oct-07 11-Nov-07
Date (MMDDYY) Concentration (mg/L) Sulfate Sodium Calcium Chloride Magnesium
South windsor pond near the outlet
0.0 100.0 200.0 300.0 400.0 500.0 600.0 700.0 800.0 900.0
15-May-07 14-Jun-07 14-Jul-07 13-Aug-07 12-Sep-07 12-Oct-07 11-Nov-07
Date (MMDDYY) Concentration (mg/L) S ulfa te S o dium C a lc ium C hlo ride M a gne s ium
Fig 2. Inorganic ion concentrations change during the monitoring season.
During the monitoring period, a decrease in the inorganic ion concentrations was observed (Fig 2). This decrease responded to the three rainfall events, which occurred on July 21, August 6 and August 10. The runoff from these storm events may contain less soluble ions
compared with those from earlier storm events, as road salt had been dissolved and transported away. Due to this reason, the inorganic ion concentrations in detention ponds were actually diluted when this runoff reached the ponds. The ion concentrations in the ponds gradually increased after these rainfall events in responding to hot conditions and strong evaporation and transpiration between later August and early October.
The north pond contained a higher level of DOC, reflecting the runoff erosion of the surface soils into the pond, as observed in this site under construction. In comparison, the south pond had higher BOD concentrations. The north pond had a higher DOC and lower BOD in comparison with the south pond. This may be related to the nature of organic materials coming from communities of different maturity. In the north pond, the DOC may have come from eroded soils that contain less degradable humic materials. However, this merits further investigation in the future.
Nutrient levels
Both ponds had similar levels of total nitrogen (TN), with an average in the range of 1.7 to 1.9 mg/L (Fig 3). However, during the monitoring period, the nitrate level in the south pond was mostly below detection limit. In the south pond, less than 5% TN occurred as nitrate that was readily available for plankton or other plants to uptake. Over 95% TN existed in TKN form, which is dominated by organic form. This low nitrate level in the south pond was further offset by application of nitrate fertilizer (100 kg of NH4NO3) on July 23, as a
practice of biological manipulation to control the growth of BGA. It was evident that a significant increase in nitrate level from below detection limit (<0.04 mg/L) before fertilizer application to 0.35 mg/L on July 25, 2 days after the application (Fig 3). In the north pond
about 40% TN was nitrate and the other 60% occurred as TKN. Higher nitrate
concentrations in the north pond may have been caused by runoff from exposed soils that were previous nutrient-enriched farmland. Even with highly variable levels of nitrate, an average concentration during the monitoring period still only reached 0.75 mg/L (Table 4).
South pond inlet location
0.0 0.5 1.0 1.5 2.0 2.5 3.0 3.5 4/9 /2 007 5/9 /2 007 6/8 /2 007 7/8 /2 007 8/7 /2 007 9/6 /2 007 10/6 /20 07 Concentration (mg/L) TN TKN NO3-N TP OP
North pond inlet location
0. 0 0. 5 1. 0 1. 5 2. 0 2. 5 3. 0 3. 5 TN NO3-N TKN TP OP
South pond outlet location
0.0 0.5 1.0 1.5 2.0 2.5 3.0 3.5 4/9 /07 5/9/07 6/9/07 7/9/07 8/9/07 9/9/07 10/9 /07 Date Concentration (mg/L ) TN TKN NO3-N TP OP
North pond outlet location
0 0.5 1 1.5 2 2.5 3 3.5 5/1 5/20 07 6/1 4/20 07 7/1 4/20 07 8/1 3/20 07 9/1 2/20 07 10/1 2/2 007 Date Concentration (mg/L ) TN NO3-N TKN TP OP
Fig 3. Variations of TN, TKN, NO3-N, TP and OP during the monitoring period.
Table 4. Average levels of nutrients and NO3-N to TP ratio during monitored pond
South Pond North Pond
Parameter
Mean Range Mean Range
TN (mg/L) 1.71 0.90 to 2.90 1.90 0.80 to 4.90 TKN (mg/L) 1.62 0.80 to 2.90 1.16 0.40 to 2.00 NO3–N (mg/L) 0.08 <0.04 to 0.70 0.75 <0.04 to 3.63 TP (mg/L) 0.20 0.06 to 0.69 0.09 0.04 to 0.22 OP (mg/L) 0.05 <0.02 to 0.43 0.02 <0.02 to 0.13 NO3–N to TP ratio 0.4 0.0* to 1.8 9.9 0.0* to 54.8
* The NO3-N concentration was treated as 0 mg/L when it is below the method detection
The south pond had relatively high TP levels, with an average of 0.20 mg/L, ranging from 0.06 to 0.69 mg/L. In comparison, the north pond had an average TP of 0.09 mg/L, ranging from 0.04 to 0.22 mg/L. The low nitrogen and high phosphorus in the south pond was
believed to be the cause of severe growth of BGA in mid-July. The ratio of nitrate-N to TP is one of the important factors that affect phytoplankton community structure. A low nitrate-N to TP ratio would favour BGA growth. In the south pond, this ratio ranges from 0.0 to 1.8, with an average of 0.4, but this ratio was greater in the north pond, ranging from 0.0 to 54.8, with an average of 9.9 (Table 4).
Bacteriological quality
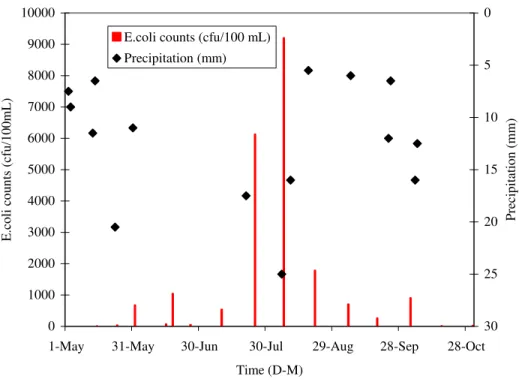
Total precipitation and duration of a rainfall event controls the runoff intensity that in turn affects the chemical and microbiological quality of the stormwater, along with antecedent conditions. As indicators of bacteriological quality of the pond water, total coliform (TC) and E. coli concentrations varied greatly during the monitoring season. In the south pond, TC concentrations ranged from <100 cfu/100 mL to 111,200 cfu/100 mL, and E. coli varied from 0 to 3,654 cfu/100 mL. Fecal streptococcus (FS) level was in a range from
non-detectable to 30,800 cfu/100 mL. The north pond showed similar variation patterns in these bacteriological parameters.
Indicator bacteria were extremely low in early spring despite the initial spring runoff, and many samples contained no detectable E. coli and FS. The numbers started to increase in the middle of May as the weather warmed up, and the first concentration peak occurred in early June following rainfalls May 21, 23 and 31, respectively. A second concentration peak came
on August 7 following a heavy rainfall on August 6 (Fig 4). A significant increase in E. coli level was also observed in the north pond on July 25, 4 days after a rainfall on July 21.
0 1000 2000 3000 4000 5000 6000 7000 8000 9000 10000
1-May 31-May 30-Jun 30-Jul 29-Aug 28-Sep 28-Oct Time (D-M)
E.coli counts (cfu/100mL)
0 5 10 15 20 25 30 Precipitation (mm)
E.coli counts (cfu/100 mL) Precipitation (mm)
Fig 4. E. coli counts during the monitoring season near the inlet location in the north pond. The bacteriological contamination in the pond water, particularly in the inlet areas was closely related to the storm events, as demonstrated by the variation of E. coli counts near the inlet location in the north pond (Fig 4). As both E. coli and FS are originated from fecal sources, counts of these bacteria reflected the degree of contamination level of the pathogens that were carried into the retention ponds by storm runoff.
Similar levels of TC and FS were observed in the north pond. However, significant reductions in both E. coli and FS from the inlet to the outlet indicated that these retention ponds had indeed substantially removed the pathogens. When storm runoff enters the ponds,
the outlet areas, the pathogen level decreases, because the pathogens were dying off in the process. To evaluate the effectiveness of the pond in reducing a contaminant concentration, removal efficiency is calculated using the following equation:
Cinlet – Coutlet
Coutlet
• 100% (1) Efficiency =
Where the efficiency is the pond removal efficiency for a particular contaminant, Cinlet in the
contaminant concentration at inlet area (e.g. indicator bacteria counts), and Coutlet is the
contaminant concentration at the outlet area (e.g. indicator bacteria counts).
Table 5. Bacteriological parameters in the monitored ponds
Parameter South pond North pond
Inlet area Outlet area Efficiency Inlet area Outlet area Efficiency
TC1* 12,636 11,696 7% 15,968 4,032 75%
EC2* 323 80 75% 1,353 102 93%
FS 3* 1,887 257 86% 2,201 454 79%
1 TC: total coliform, 2EC: E. coli, 3FS: fecal Streptococcus, *in cfu/100 mL.
In general, the removal efficiencies ranged from 75% to 93% for the south pond, and 79% to 92% for the north pond (Table 5). In the south pond, similar removal efficiencies, 75% and 86%, respectively were observed for the E. coli and FS, but TC bacteria stayed almost the same near the inlet and outlet locations with a removal efficiency of only 7%. This difference can be caused by many factors, including sampling error and possible regrowth of some strains coliform bacteria, which come from the environment sources, not a fecal origin.
Multi-sensor sonde data
Sonde sensors responded to water quality changes and reflected the physical, chemical and biological processes that occurred in the pond, as affected by the storm events. For example, the temperature sensor recorded daily variation of the water temperature at 1-m depth for the
period of July 14 to 23, 2007, with a maximum around 25 ºC between 21:00 and 23:00 pm and a minimum of 22 to 23 ºC between 9:00 and 11:00 am (Fig 5). This temperature
variation reflected the daily atmospheric temperature changes, but showed a delay response as the heat transfer to the monitored depth. The dissolved oxygen (DO) sensor responded to the DO level in the water, which can be affected by many factors including temperature and biological activities, such as photosynthesis and respiration. Storm events could temporarily disrupt the variation patterns of temperature and DO as illustrated in Fig 5. For instance, a sudden drop in temperature and a disrupted DO pattern on July 21 was a result of a storm event with 17.5 mm rainfall. However, after the storm, the cycles were quickly re-established in several hours. 0.0 5.0 10.0 15.0 20.0 25.0 30.0 35.0
13-Jul 14-Jul 15-Jul 16-Jul 17-Jul 18-Jul 19-Jul 20-Jul 21-Jul 22-Jul 23-Jul 24-Jul
Time (DD-MM)
Temp C DO Conc mg/L
Fig 5. Variation of temperature and DO near the outlet of the south pond. Interruption on July 21 was caused by 17.5 mm rainfall event that day.
Blue green algae (BGA) (also known as Cyanobacteria) and chlorophyll levels in the detention ponds were monitored with the fluorescence-based, continuous measuring sensors during the summer months. Although other diatoms are unicellular organisms and capable of photosynthesis, BGA can grow well under extreme nitrogen deficient environments due to their capability of fixing nitrogen from the atmosphere. Some species produce toxins that pose health risks to the environment and public.
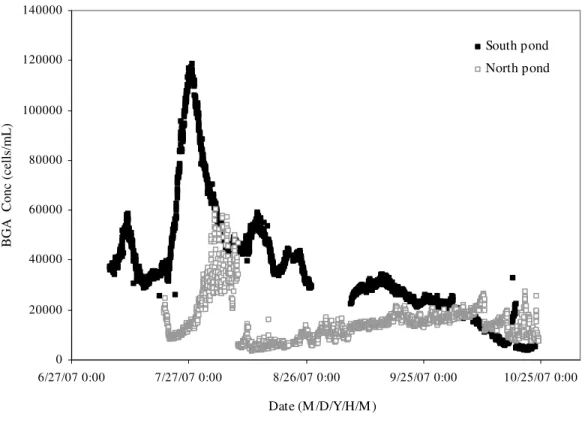
We chose global calibrations for the BGA and chlorophyll sensors, in which BGA population was measured in cells/mL, and chlorophyll concentration was determined in μg/L. As the sensors were located at a consistent depth approximately 1 m below the water surface throughout the monitoring program, the results in general represent the levels of biomass of the diatom group of interest, and less subject to variation of floating plankton on the surface. The peaks of BGA in both detention ponds were observed during late July and early August, corresponding to the high temperatures in that period. The south pond where the level was almost 10 times that of the north pond (Fig 6) indicated that the environment conditions, particularly the low ratio of available nitrogen to total phosphorus favoured the BGA to grow. This observation was consistent with earlier conclusions from different lakes, rivers and seas (Smith, 1983; Stahl-Delbanco et al., 2003; Lagus et al., 2004). As a management practice to control BGA growth by the City, 100 kg of nitrogen fertilizer (NH4NO3) was
applied to the south pond on July 23rd, aiming to promote other diatom growth and to
suppress the BGA. After fertilizer application, BGA levels in the pond continued to increase until July 27, with a peak population around 120,000 cells/mL. After it reached this peak, the population started to decrease sharply to almost one third of its peak level in less than 10 days. Although there were several smaller blooms observed, BGA peak populations were
fluctuating between 3,500 and <6,000 cells/mL. In the north pond, BGA level was
substantially lower than the south pond, with a peak level below 60,000 cells/mL. The BGA population reached a peak level on August 1 and stayed on this peak until August 8. The high available nitrogen supply in the north pond was believed to be a factor that had maintained BGA at a lower level. After the August peak, the BGA population was consistently low (<28,000 cells/mL) in both ponds for rest of the summer months (Fig 6).
0 20000 40000 60000 80000 100000 120000 140000 6/27/07 0:00 7/27/07 0:00 8/26/07 0:00 9/25/07 0:00 10/25/07 0:00 Date (M /D/Y/H/M )
BGA Conc (cells/mL)
South pond North pond
Fig 6. Variation of blue green algae (BGA) near outlet locations during monitoring period.
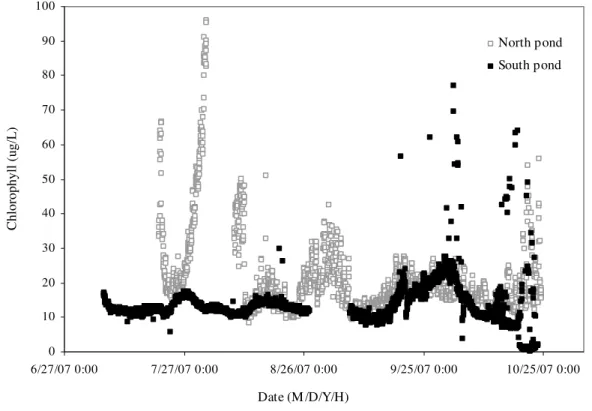
Phytoplankton can be used as an indicator organism for the health of a water body and chlorophyll is essential to the existence of phytoplankton. Therefore, monitoring chlorophyll levels is a direct way of tracking the health of an aquatic system. Typically, surface water with high chlorophyll conditions indicates a strong algal growth and high nutrient level,
levels and also affect other aquatic life and habitats. The north pond had a much higher level of chlorophyll than the south pond (Fig 7). The high nutrient concentrations, particularly nitrate in the pond seems to the major factor for the algal growth. In comparison, low nitrate concentration in the south pond has resulted in lower chlorophyll concentrations, even with a relatively high phosphorus content. Chlorophyll concentration in the south pond did respond to the fertilizer application, showing a gradual increase from July to August (Fig 7).
0 10 20 30 40 50 60 70 80 90 100 6/27/07 0:00 7/27/07 0:00 8/26/07 0:00 9/25/07 0:00 10/25/07 0:00 Date (M /D/Y/H) Chlorophyll (ug/L) North pond South pond
Fig 7. Variation of chlorophyll in the detention ponds during the monitoring period.
It should be pointed out that the multi-sensor sonde with probes and optical sensors placed directly in the water body can suffer from two potential problems. First, it is not possible to check the calibration of each probe without taking the instrument out of the water.
Therefore, measurement drifts can occur between calibrations. Second, the probes need regular maintenance to remove bacterial slimes and algal growths that can interfere with their
performance and occasionally, erroneous results can be produced. Best practice is to bring the sonde back for data download and perform calibration and maintenance biweekly. As the process may take several days to complete, therefore, an additional sonde system may be required.
Although the multi-sensor system can be used for continuous stormwater quality monitoring and measuring pollutant loads, laboratory analysis of the grab samples provides important complementary information and becomes an important component of a comprehensive monitoring program. The combination of these two techniques will supply complete
information for understanding the physical, chemical and biological activities in the detention ponds.
Conclusions
The results from the first year’s monitoring program indicated that a combination of grab sampling and multi-sensor sonde systems provides a good understanding of stormwater quality changes in the detention ponds. Test results from grab samples indicated that the water quality in the south pond was consistent between the inlet and the outlet locations. The south pond had lower average concentrations of suspended solids and major ions in
comparison with the north pond. However, in the north pond significant reductions from the inlet to the outlet areas were observed in alkalinity, total hardness, total dissolved solids and nutrient levels. The relatively higher OP and low nitrate in the south pond had caused more blue-green algal growth during late July and early August. Concentrations of total coliform, E. coli and fecal streptococcocus in both ponds were closely related to the rainfall events that occurred during the monitoring period. The preliminary monitoring results also suggest that
both ponds have some capability to remove certain types of contaminants, particularly the microbial contaminants. The shallow marsh design with emerging water-loving vegetation in the north pond seems to be able to remove nutrients and other urban contaminants as well. Multi-sensor sonde systems provide continuous measurements of water quality changes, including detailed information on how monitored parameters vary with storm events, seasonal changes and biological processes in the aquatic systems. For the first time, BGA and chlorophyll dynamics in these urban detention ponds have been monitored continuously 24/7, which clearly indicated that low ratio of nitrogen to total phosphorus in the south pond is the cause of the severe BGA growth in the hot summer months.
Acknowledgements
We extend our appreciation to Kendra Svingen, David Schmidt, Zheng Cui, Wei Peng and Brad LaFontaine for water sampling and sonde deployment. We also acknowledge the in-kind contribution of the City of Regina, through participation of Susan Harty and the use of the City’s field equipment during the first part of the study.
References:
Bowen, G., Henry, D., and Novak, Z. 1993. Interim stormwater quality control guidelines for new development: results and data. In: Proc. 6th Int. Conf. on Urban Storm Drainage. J. Marsalek and H.C Torno (eds.) Seapoint Publishing, Victoria, BC. pp 1689-1694.
City of Calgary, 2000. Stormwater Management and Design Manual, the City of Calgary Wastewater and Drainage. pp 7-4 & 9-31.
Marsalek, J., Watt, W.E., and Henry, D. 1992. Retrofitting stormwater ponds for water quality control. Water pollu. Res. J. Canada 27(2), 403-422.
Massal, L.R., Snodgrass, J.W., and Casey R.E. 2007. Nitrogen pollution of stormwater ponds: potential for toxic effects on Amphibian embryos and larvae. Applied Herpetology 4, 19-29.
MOEE. 1994. Stormwater management practices planning and design manual. Ontario Ministry of Environment and Energy, Toronto, Ont.
Nazahiyah, R., Yusop, Z.,and Abustan, I. 2007. Stormwater quality and pollution loading from an urban residential catchment in Johor, Malaysia. Water Science and Technology 56(7), 1-9.
US Environmental Protection Agency (EPA). 1983 Results for the national wide urban runoff program Volume 1 – Final Report. Water Planning Division, USEPA, Washington DC.
Urbonas, B. 1993. Assessment of BMP use and technology today. In: Proc. 6th Int. Conf. on Urban Storm Drainage. J. Marsalek and H.C Torno (eds.) Seapoint Publishing, Victoria, BC., pp 1037-1042.
Lagus, A., Suomela, J., Weithoff, G., Heikkila, K., Helminen, H. and Sipura, J. 2004. Species-specific differences in phytoplankton responses to N and P enrichments and the N: P ratio in the Archipelago Sea, northern Baltic Sea. J. Plankton Res. 26, 779-798.
Stahl-Delbanco, A., Hansson, L.A. and Gyllstrom M. 2003. Recruitment of resting stages may induce blooms of Microcystis at low N:P ratios. J. Plankton Res. 25, 1099-1106
Smith, V.H. 1983. Low nitrogen to phosphorus ratios favor dominance by blue-green algae in lake phytoplankton. Science. 221, 669 – 671.