HAL Id: hal-00295713
https://hal.archives-ouvertes.fr/hal-00295713
Submitted on 8 Aug 2005
HAL is a multi-disciplinary open access
archive for the deposit and dissemination of
sci-entific research documents, whether they are
pub-lished or not. The documents may come from
teaching and research institutions in France or
abroad, or from public or private research centers.
L’archive ouverte pluridisciplinaire HAL, est
destinée au dépôt et à la diffusion de documents
scientifiques de niveau recherche, publiés ou non,
émanant des établissements d’enseignement et de
recherche français ou étrangers, des laboratoires
publics ou privés.
Mediterranean using elastic backscatter-Raman lidar,
spectrophotometric and satellite observations in the
frame of the EARLINET project
A. Papayannis, D. Balis, V. Amiridis, G. Chourdakis, G. Tsaknakis, C.
Zerefos, A. D. A. Castanho, S. Nickovic, S. Kazadzis, J. Grabowski
To cite this version:
A. Papayannis, D. Balis, V. Amiridis, G. Chourdakis, G. Tsaknakis, et al.. Measurements of Saharan
dust aerosols over the Eastern Mediterranean using elastic backscatter-Raman lidar,
spectrophoto-metric and satellite observations in the frame of the EARLINET project. Atmospheric Chemistry and
Physics, European Geosciences Union, 2005, 5 (8), pp.2065-2079. �hal-00295713�
www.atmos-chem-phys.org/acp/5/2065/ SRef-ID: 1680-7324/acp/2005-5-2065 European Geosciences Union
Chemistry
and Physics
Measurements of Saharan dust aerosols over the Eastern
Mediterranean using elastic backscatter-Raman lidar,
spectrophotometric and satellite observations in the frame of the
EARLINET project
A. Papayannis1, D. Balis2, V. Amiridis2, G. Chourdakis1,*, G. Tsaknakis1, C. Zerefos3, A. D. A. Castanho4, S. Nickovic5, **, S. Kazadzis2, and J. Grabowski6
1Department of Physics, National Technical University of Athens, Greece
2Laboratory of Atmospheric Physics, Aristotelian University of Thessaloniki, Greece 3Department of Geology, University of Athens, Greece
4Department of Physics, University of S˜ao Paulo, Brazil
5Euro-Mediterranean Center on Insular Coastal Dynamics, University of Malta, Malta 6Department of Physics, Technical University of Poznan, Poland
*now at: Raymetrics S.A., Glyka Nera, Attika, Greece
**now at: Environment Division, World Meteorological Organization, Geneva, Switzerland
Received: 23 December 2004 – Published in Atmos. Chem. Phys. Discuss.: 8 April 2005 Revised: 1 July 2005 – Accepted: 22 July 2005 – Published: 8 August 2005
Abstract. We report on the vertical distributions of
Saha-ran dust aerosols over the N.E. MediterSaha-ranean region, which were obtained during a typical dust outbreak on August 2000, by two lidar systems located in Athens and Thessaloniki, Greece, in the frame of the European EARLINET project. MODIS and ground sun spectrophotometric data, as well as air-mass backward trajectories confirmed the existence of Sa-haran dust in the case examined, which was also successfully forecasted by the DREAM dust model. The lidar data analy-sis for the period 2000–2002 made possible, for the first time, an estimation of the vertical extent of free tropospheric dust layers [mean values of the aerosol backscatter and extinc-tion coefficients and the extincextinc-tion-to-backscatter ratio (lidar ratio, LR) at 355 nm], as well as a seasonal distribution of Saharan dust outbreaks over Greece, under cloud-free condi-tions. A mean value of the lidar ratio at 355 nm was obtained over Athens (53±1 sr) and over Thessaloniki (44±2 sr) dur-ing the Saharan dust outbreaks. The corresponddur-ing aerosol optical thickness (AOT) at 355 nm, in the altitude range 0– 5 km, was 0.69±0.12 and 0.65±0.10 for Athens and Thessa-loniki, respectively (within the dust layer the AOT was 0.23 and 0.21, respectively). Air-mass back-trajectory analysis
Correspondence to: A. Papayannis
performed in the period 2000–2002 for all Saharan dust out-breaks over the N.E. Mediterranean indicated the main path-ways followed by the dust aerosols.
1 Introduction
Tropospheric aerosols arise from both natural sources (wind-borne dust, sea spray, forest fires and volcanic eruptions, etc.) and anthropogenic sources (combustion of fossil fuels, car traffic and biomass burning activities, etc.). With the in-creasing urbanization and industrialization over the whole Mediterranean region and especially along the coastal ar-eas, the content of aerosols particularly in the lower tropo-sphere increases continuously (Lelieveld et al., 2002) lead-ing to high aerosol extinction values over the area (Barnaba and Gobbi, 2004; Matthias et al., 2004). A recent paper by Sciare et al. (2003) investigated the contribution of different aerosol sources in the Eastern Mediterranean Basin, showing that this region is influenced during summertime by a wide range of air-masses originating mainly in Europe and Africa. Aerosols can be emitted directly as particles (primary aerosol) or formed by gas-to-particle conversion processes (secondary aerosol) and can travel over long distances from their source region, as their residence time in the troposphere
is ranging from a few days to a few weeks (e.g. Pandis et al., 1995). Their composition and atmospheric concentrations are highly variable. Particles smaller than 1 µm diameter generally have concentrations ranging from tens to thousands of particles per cm3, while those exceeding 1 µm diameter are usually found at concentrations less than 1 particle per cm3(Hsu et al., 1996; Andreae and Crutzen, 1997; Thomp-son et al., 2001).
Atmospheric particles and mainly the mineral dust parti-cles, influence the earth’s radiation balance and climate in two ways: (a) by reflecting and absorbing, both incoming and outgoing radiation (Seinfeld and Pandis, 1998; Acker-mann and Chung, 1992; Meloni et al., 2004; Seinfeld et al., 2004), depending on their chemical composition, a phe-nomenon termed as “direct aerosol effect”, and (b) by acting as cloud condensation nuclei (CCN) and thereby determine the concentration of the initial droplets, albedo, precipitation formation and lifetime of clouds (Schrope, 2000; Lohmann and Feichter, 2001; Krueger and Grassl, 2002; Satheesh and Krishna Moorthy, 2005), a phenomenon termed as “indi-rect aerosol effect”. These two phenomena are very diffi-cult to quantify and thus large uncertainty exists about the climatic role of aerosols (Charlson et al., 1992; Duce, 1995; Houghton et al., 2001; Lohman and Feichter, 2001; Ander-son et al., 2003). In the case of the direct aerosol effect, it is interesting to note that according to observations and numer-ical modeling the UV-absorbing particles (such as mineral dust) inhibit smog production (Dickerson et al., 1997), which could have major implications for the control of air pollution in large urban sites. Additionally, as large dust particles ab-sorb solar radiation, they can modify the earth’s thermal ra-diation budget, so for an average dust event, it is estimated that the lower atmosphere (1.5–3.5 km altitude) is heated by
∼0.2 K per day. At about 30 dusty days per year, the pres-ence of dust aerosols leads to a regional heating of ∼6 K per year (Alpert et al., 1998). Therefore, dust aerosols play a crucial role in earth’s radiation budget. Additionally, it was found recently that the Saharan air layer (SAL), an elevated layer of Saharan air mixed with mineral dust, may play a cru-cial role in suppressing tropical cyclone activity in the north Atlantic region (Dunion and Velden, 2004).
Every year large quantities of dust are emitted into the at-mosphere during the high wind periods over the desert re-gions (Sahara, Gobi deserts). Strong winds can blow sand, from desert regions, into the free troposphere where it is advected over great distances (Prospero and Carlson, 1972; Prospero et al., 2002; Ginoux et al., 2004). Most of these particles are coarse (diameter ≥1 µm) and are thus deposited close to the source region, while some fraction of the smaller particles (diameter around 0.5–1 µm) can be transported over large distances. An estimation of the emission flux of desert aerosols that is subject to long-range transport is of the or-der of 1500 Tg/yr (Wafers and Jaenicke, 1990). At the global scale, the Sahara desert is the most important source of min-eral aerosols. For the Saharan dust region it is estimated that
every year about several hundred million tons (Prospero et al., 1996) up to one billion tons (D’Almeida, 1986) of desert dust are exported to the tropical North Atlantic Ocean and the Mediterranean Sea (Prospero and Carlson, 1972; Prospero et al., 1993; Prospero, 1999; Rodriguez et al., 2001; Bonasoni et al., 2004).
Aerosol optical properties derived from the Advanced Very High Resolution Radiometer (AVHRR) (Ignatov et al., 1998) classified the Mediterranean Sea as one of the areas with the highest aerosol optical depths in the world, as re-ported by Husar et al. (1997), Prospero et al. (2002), Barnaba and Gobbi (2004) and Perrone et al. (2005), which mostly oc-cur during Saharan dust outbreaks. For this reason over the Mediterranean Sea the Saharan dust events have been studied for more than 20 years, mainly by using satellite data (Du-lac et al., 1992; Jankowiak and Tanr´e, 1992; Moulin et al., 1997a; Moulin et al., 1997b; Prospero et al., 2002; Moulin and Chiapello, 2004). As a consequence, few mostly non-systematic publications exist on the vertical distribution of desert dust particles over the Mediterranean Sea (Hamonou et al., 1999; Di Sarra et al., 2001; Gobbi et al., 2002; Du-lac et al., 2003; de Tomasi et al., 2003; Pappalardo et al., 2003; Balis et al., 2004). Therefore, no systematic data on the vertical profiles, as well as on the temporal and spatial evolution, of Saharan dust layers exist yet over the Eastern Mediterranean Sea, except a limited number of vertical pro-files taken during short campaign periods (Balis et al., 2000; Gobbi et al., 2000; Gobbi et al., 2002, Dulac and Chazette, 2003; Balis et al., 2004).
In the period 2000–2002, 50 cases of Saharan dust aerosol transport to the East Mediterranean Sea were followed by two elastic backscatter-Raman lidar systems in Greece. The first system is located at the National Technical University of Athens (NTUA), Athens (37.9◦N, 23.8◦E) and the second at the Laboratory of Atmospheric Physics, Aristotelian Univer-sity of Thessaloniki (LAP-AUTH), Thessaloniki (40.5◦N, 22.9◦E). These two lidar stations are located at a distance of 400 km one from the other and are part of the coordi-nated European ground-based lidar network, operated in the frame of the EARLINET Project (2000–2003) (B¨osenberg et al., 2001). The lidar data are complemented by satel-lite images of the Moderate Resolution Imaging Spectro-radiometer (MODIS), spectro-photometric (Brewer) data, DREAM dust model results and by air-mass back-trajectory analysis performed by the German Weather Service (DWD). Unfortunately, no AOT data are available in Greece from the Aerosol Robotic Network (AERONET) (Holben et al., 2001) for the period studied (2000–2002) to be intercompared with the AOT lidar data.
In this paper we present a statistical analysis of the Sahara dust events detected in the period from May 2000 up to De-cember 2002. Special emphasis is given on a typical case of Saharan dust aerosols transported to the East Mediterranean region and observed simultaneously by the NTUA and LAP-AUTH lidar systems. Section 2 of this paper gives a brief
presentation of the two Greek lidar systems, as well as a brief description of the MODIS sensor and the DREAM model. Section 3 is focused on lidar, spectrophotometric and satellite data analysis, supported by dust model simulations (DREAM model) and air-mass back trajectory analysis, during a dust event over Greece in August 2000. A synopsis of all li-dar vertical profiles (mean values of the aerosol backscatter and extinction coefficients and the lidar ratio at 355 nm), free tropospheric air-mass back-trajectories ending over Athens and Thessaloniki during Saharan dust events and the sea-sonal distribution of Saharan dust events observed in the pe-riod 2000–2002 over Greece is also given. Finally, Sect. 4 presents our concluding remarks.
2 Instrumentation
2.1 Lidar systems
The lidar system of NTUA is designed to perform contin-uous measurements of suspended aerosols particles in the Planetary Boundary Layer (PBL) and the lower free tropo-sphere. It is based on the second and third harmonic fre-quency of a compact pulsed Nd:YAG laser, which emits si-multaneously pulses of 75 mJ and 130 mJ output energy at 355 nm (implemented on mid-September 2000) and 532 nm, respectively with a 10 Hz repetition rate. The optical receiver is a Cassegrainian reflecting telescope with a primary mir-ror of 300 mm diameter and a focal length f =600 mm, di-rectly coupled, through an optical fiber, to the lidar signal detection box (Papayannis and Chourdakis, 2002). The de-tectors are operated both in the analog and photon-counting mode and the spatial raw resolution of the detected signals is 15 m. The lidar system of AUTH is also based on the second and third harmonic frequency of a compact, pulsed Nd:YAG laser, emitting simultaneously pulses of 120 mJ and 250 mJ output energy at 355 nm (implemented on October 2000) and 532 nm, respectively, with a 10 Hz repetition rate. The re-ceiving telescope has a primary diameter of 500 mm and fo-cal length of f =5000 mm. Phototomultiplier tubes (PMTs) are used to detect the received lidar signals in the analog and the photon counting mode, with a corresponding raw range resolution of 7.5 m (Balis et al., 2000). Both lidar systems were equipped during mid-2001 with a Raman channel work-ing at 387 nm (atmospheric N2channel) for nighttime
opera-tion.
In order to get reliable and quantitative lidar aerosol data several techniques and methods have to be combined. For example, the standard backscatter lidar technique is appro-priate to retrieve aerosol parameters mostly for small optical depths, as in clean areas, assuming a reference height in an aerosol-free area, as for example the upper troposphere. In this case, the Klett inversion technique is used to retrieve the vertical profile of the aerosol backscatter coefficient (baer)at
the respective wavelengths (Klett, 1985). The resulting
aver-age uncertainty on the retrieval of baer(including both
statis-tical and systematic errors and corresponding to 30–60 min. temporal resolution) is of the order of 20–30% (B¨osenberg et al., 1997). To overcome this large uncertainty associ-ated with this technique, the Raman N2lidar technique was
adopted and implemented at both lidar systems. The NTUA and AUTH lidar systems have thus, since mid-2001, the ca-pability to detect signals both by the Raman scattering from the atmospheric N2(at 387 nm) and the elastic backscattering
at 355 and 532 nm.
Using the methodology proposed by Ansmann et al. (1992) the measurement of the elastic-backscatter sig-nal at 355 nm and that of the nitrogen inelastic-backscatter signal at 387 nm permits the determination of the extinction (aaer)and backscatter (baer) coefficients independently of
each other and, thus, of the extinction-to-backscatter ratio, the so-called lidar ratio (LR) at 355 nm. The height profile of the particle backscatter coefficient at 355 nm is determined from the ratio of the elastic to the inelastic nitrogen Raman signal and the extinction-to-backscatter ratio is then, calcu-lated. The uncertainties of the retrieved aaerand baervertical
profiles are of the order of 10–15% (Mattis et al., 2002). The vertical profiles of baerreferring to measurements
per-formed before the local sunset time (∼19:00 UT) were re-trieved by using the Klett technique, assuming a lidar ra-tio value equal to 45 sr. This value is typical for a mixture of dust and marine aerosols at mid-latitudes (Ackermann, 1998). Since the Raman lidar signals have a very low inten-sity, the Raman lidar measurements are possible only during nighttime conditions. Therefore, only 15 (out of the total 50 dust cases followed) lidar ratio profiles are available for each Greek lidar site, concerning the Saharan dust outbreaks in the 2000–2002 period.
The lidar systems of AUTH and LAP and the algo-rithms implemented were successfully inter-compared with the other EARLINET groups as reported by Matthias et al. (2004), B¨ockmann et al. (2004) and Pappalardo et al. (2004). To assure that the lidar measurements are obtained under cloud-free conditions a portable cross-polarizing sys-tem was used to detect the existence of sub-visible clouds in the lidar systems’ field of view (FOV). In such cases the lidar profiles acquired were not taken into account in this study. Thus, the Saharan dust aerosol profiles in this study can be considered as taken only under cloud-free conditions. 2.2 MODIS instrument
The Moderate Resolution Imaging Spectroradiometer (MODIS) was launched in December 1999 on the polar orbiting Terra spacecraft and since February 2000 has been acquiring daily global data in 36 spectral bands from the visible to the thermal infrared (29 spectral bands with 1 km, 5 spectral bands with 500 m, and 2 with 250 m, nadir pixel dimensions). The MODIS aerosol products are only created for cloud-free regions. The
1000 1500 2000 2500 3000 3500 4000 4500 5000 5500 6000 6500 7000 7500 0,000 0,001 0,002 0,003 0,004 0,005 0,006 0,007 0,008 28/08/2000 Athens, 532 nm, 17:00-19:00 UT
Aerosol Backscatter Coefficient (km-1 sr-1)
Altitude (m)
Fig. 1. The average aerosol backscatter coefficient (baer) over
Athens, Greece obtained by lidar at 532 nm on 28 August 2000, averaged between 17:00 and 19:00 UT.
atmospheric optical thickness (AOT) values are retrieved by MODIS at 550 nm for both ocean (best) and land (cor-rected) as described by the MODIS sensor website (http: //modis-atmos.gsfc.nasa.gov/MOD04 L2/format.html). Ac-cording to Kaufman and Tanr´e (1998) the AOT values over the ocean are accurate to within their calculated uncertain-ties (±0.03±0.05*AOT). In dust aerosol regimes, retrieved aerosol optical thickness will have greater error due to non-spherical effects. The AOT values over land are accurate to within their calculated uncertainties (±0.05±0.20*AOT), except in situations with possible cloud contamination, over surfaces with sub-pixel surface water, such as coastal areas and marshes.
2.3 DREAM model
An integrating modeling system, the Dust REgional Atmo-spheric Modeling (DREAM) model was used to simulate the 3-dimensional field of the dust concentration in the tropo-sphere. It is based on the SKIRON/Eta modeling system and the Eta/NCEP regional atmospheric model (Nickovic et al., 2001). The dust model takes into account all major processes of dust life cycle, such as dust production, horizontal and vertical diffusion and advection and wet and dry deposition. The model also includes the effects of the particle size dis-tribution on aerosol dispersion. In DREAM the dust mass is described by particles with four sizes, resulting from the structure of desert soils based on content of clay, small silt, large silt and sand. The model actually numerically solves the Euler-type mass partial differential equation by integrat-ing it spatially and temporally. The dust production is pa-rameterized using near-surface wind and thermal conditions, as well as soil features. The dust production mechanism is based on the viscous/turbulent mixing, shear-free convection diffusion, and soil moisture. In addition to these sophisti-cated mechanisms, very high-resolution databases, including
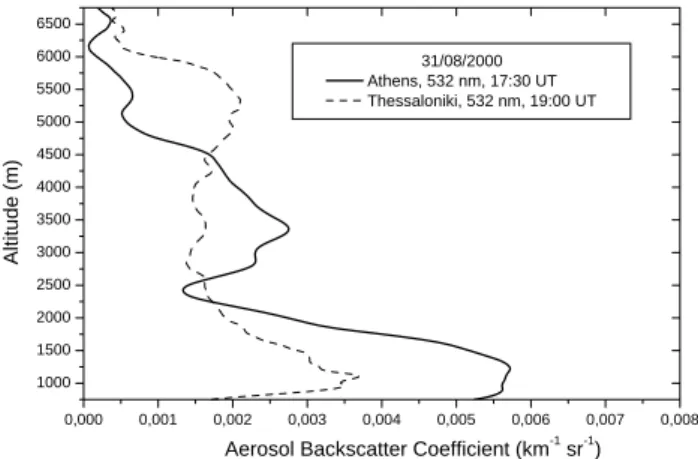
1000 1500 2000 2500 3000 3500 4000 4500 5000 5500 6000 6500 0,000 0,001 0,002 0,003 0,004 0,005 0,006 0,007 0,008 31/08/2000 Athens, 532 nm, 17:30 UT Thessaloniki, 532 nm, 19:00 UT
Aerosol Backscatter Coefficient (km-1 sr-1)
Altitude (m)
Fig. 2. The aerosol backscatter coefficient (baer)over Athens and
Thessaloniki, Greece obtained by lidar at 532 nm on 31 August 2000 at 17:30 and 19:00 UT, respectively.
elevation, soil properties, and vegetation cover, are utilized. Additional insight into the behavior of dust production scheme is obtained by analyzing surface dust fluxes. In DREAM the dust concentration as a surface condition is used. More specifically, the released surface concentration of mobilized particles and the corresponding surface verti-cal flux depends on two groups of parameters: one relates to the structure and state of the soil (soil composition, land cover, soil moisture), while the second group describes the turbulent state of the surface atmosphere, such as kinetic en-ergy dissipation and near-surface thermal stability (Nickovic et al., 2001).
Transport mixing and deposition processes are on-line driven by an atmospheric model and its predicted meteoro-logical parameters. The atmospheric model driver is updated every 24 h with newly observed data, but the simulated dust concentration field produced in the previous-day run initial-izes the dust model at same time intervals.
3 Data analysis
3.1 Analysis methodology
In addition to the regular observations within EARLINET (B¨osenberg et al., 2003), lidar measurements have been per-formed during special events such as Saharan dust outbreaks. The lidar measurements presented at this paper have been performed under “dust alerts” using forecasted information on the occurrence of dust events from dust models (http:// forecast.uoa.gr and http://www.bsc.es/projects/earthscience/ DREAM/). In order to verify the presence of Sahara dust over the measuring sites, we examined for each profile the corresponding 4-day back-trajectories based on the analysis performed by the German Weather Service. In addition, we also examined the corresponding images from the MODIS sensor (AOT values).
(a) (b)
(c) (d)
Fig. 3. The AOT values over Europe as derived at 550 nm by the MODIS sensor on 28 (a), 29 (b), 30 (c) and 31 (d) August 2000.
3.1.1 Case study: 28 to 31 August 2000
This typical case concerns an intense Saharan dust outbreak, which lasted for four days (28 to 31 August 2000) and was successfully followed during two days (28 and 31) by the two Greek lidar stations. Unfortunately, August 29 and 30 were not favorable for lidar measurements due to low scattered clouds over Greece. According to the German Weather Ser-vice meteorological charts this event was associated with a strong cyclonic flow located over Africa, thus causing strong winds over the whole Mediterranean region. The air-masses after having passed over Libya and Tunis, where there may have been enriched in Saharan dust aerosols, directly pene-trated the central Mediterranean region.
Figure 1 shows the average vertical profile of the aerosol backscatter coefficient (baer) (in km−1sr−1) obtained at
532 nm by the NTUA lidar system on 28 August 2000, over Athens between 17:00 and 19:00 UT. This profile shows an enhanced aerosol layer between 3 and 6 km height, centered
over 3.5 km. No lidar measurements are available for the Thessaloniki station that day due to low clouds over that site. Figure 2 shows two profiles of baerobserved on 31
Au-gust 2000 at 532 nm over Athens and Thessaloniki, Greece at 17:30 and 19:00 UT, respectively. In both baer profiles
several distinct aerosol layers are clearly seen in the free troposphere, extending from 2 up to 6 km a.s.l. with a pro-nounced peak of the order of 2–2.5×10⁻³km−1sr−1
ob-served over both sites, but at different heights (around 3.5 km over Athens and around 5.5 km over Thessaloniki). The larger values of baerobtained at altitudes lower than 2 km are
ascribed to the presence of anthropogenic aerosols emitted in the PBL over both cities.
Figures 3a to d show the evolution of the AOT values (ob-tained at 550 nm) over the European continent taken by the MODIS sensor from 28 to 31 August 2000, respectively. Figure 3a shows that very large quantities of aerosol dust (i.e. the AOT values are higher than 0.6) are present along the northern boundaries of the African continent and also
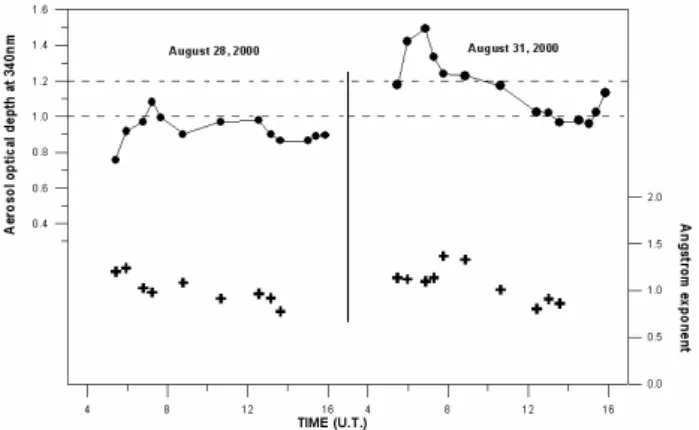
Fig. 4. The AOT and the ˚Angstr¨om coefficient values derived by a double spectrophotometer located at LAP during 28 and 31 August, respectively.
over the Mediterranean Sea, particularly over S. Italy and Greece. These high aerosol dust loadings move eastward the following two days (29 and 30 August), mainly over S. Italy and Greece giving local values of AOT between 0.4–0.6. Figure 3d shows a spectacular filament of Saharan dust aerosol (AOT>0.6) emanating from N. Africa (Tunisia), passing over S. Italy and Greece (31 August). Similar very high aerosol loadings were also measured the same day by the TOMS sensor (not shown) where aerosol index values higher than 2.3 were found over the Ionian Sea, west of the Greek peninsula. The AOT values measured by MODIS are well comparable to the high optical depth values observed over the Saharan region (AOT∼0.6–0.75) by the TOMS sen-sor during March-August months (Torres et al., 2002) in the period 1979–1992.
The AOT and the ˚Angstr¨om exponent values derived by a double Brewer spectrophotometer (working in the UV spec-tral region: 290 up to 360 nm) located at AUTH during 28 and 31 August are presented in Fig. 4. In both days the AOT values measured at 340 nm were higher than 0.8 and reached 1.1 and 1.5 at these two days, respectively, during morning hours. In any case these high AOT values confirm the pres-ence of dust aerosols over Thessaloniki on these two days. If we follow the diurnal evolution of the ˚Angstr¨om exponent values we can see variations between 0.7 and 1.5, clearly dicating variation in the particles size distribution. For in-stance, during the afternoon hours the observed ˚Angstr¨om exponent values dropped down to 0.8–0.9, which means the presence of rather large aerosol particles (coarse mode parti-cles), such as mineral dust particles or sea-salt particles (or a mixture of them) according to Moulin et al. (1997a) and Eck et al. (1999). Similar observations were made by the AVHRR sensor over the Eastern Mediterranean area (data not shown). In our lidar system, the absence of a second wavelength in the UV region (e.g. 355 nm) could not permit us to obtain some extra information about the vertical profile of the
par-ticles size distribution during this dust event. However, ob-servations made over Leipzig, Germany, during Saharan dust episodes (Mattis et al., 2002; M¨uller et al., 2003; Mattis et al., 2004) showed also similar small values of the ˚Angstr¨om ex-ponent derived from sun photometer and a multi-wavelength Raman lidar system. Similar values of the ˚Angstr¨om expo-nent derived from sun photometer observations performed during dust events were also recently reported by Perrone et al. (2005) over Lecce in Southern-eastern Italy.
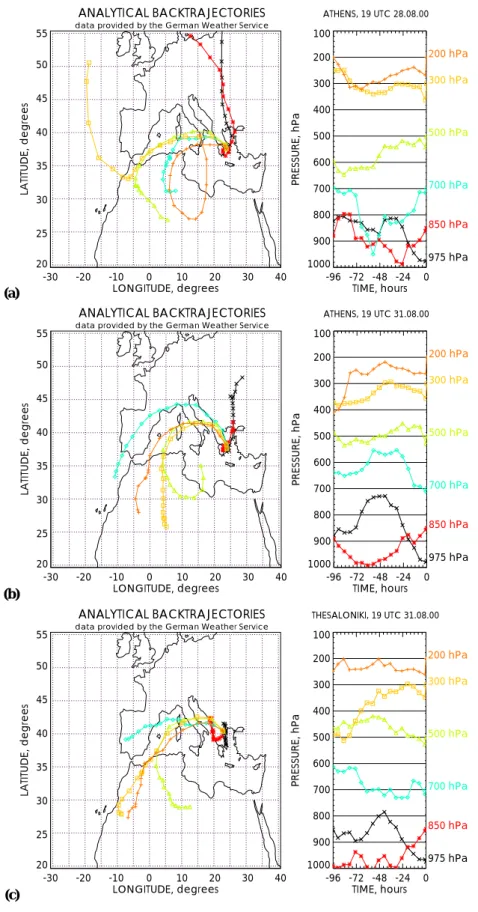
In order to verify the Saharan dust transport to the Eastern Mediterranean region we performed a 4-days air-mass back-trajectory analysis provided by the German Weather Service. The relevant 96-h back trajectory analysis for air-masses end-ing over Athens, Greece at 19:00 UT on 28 and 31 August 2000 is presented in Figs. 5a and b, respectively. Similar tra-jectory analysis was performed for air-masses ending over Thessaloniki on 31 August 2000 at 19:00 UT (Fig. 5c). For both days all air-mass trajectories ending over the two sites at levels between 700-hPa (∼3 km) and 500-hPa (∼5.6 km) originated from the Saharan region at various levels (1–3 km height), where they were enriched with important aerosol loads. These air-masses passed over central Italy and then drifted cyclonically eastward toward Greece. It is also seen on Figs. 5b and c, that the dust aerosols traveling from Thes-saloniki to Athens, on 31 August, have been forced to de-scend by about 2 km while passing over the Aegean Sea.
This dust event was successfully forecasted by the DREAM model over the Mediterranean region. A typical output result valid for 31 August, at 12:00 UT, is given in Fig. 6. The upper part of Fig. 6 shows the vertical cross-section of the dust concentration (µg/m3), the wind flow and the potential temperature (K) along the 10.4◦E axis, while
the lower part shows the dust loading (g/m2)and the wind flow at 3000 m over the Mediterranean region. It is also in-teresting to mention that the maximum height of the high-est dust concentration (∼330 µg/m3)is observed over Italy around 40◦N at 8 km height asl., slightly higher than the top of the dust layer observed over Thessaloniki (located at a similar latitude) that same day. Another very interesting feature shown by the model is the fast uplift of the dust-rich air-masses from 38◦N to 43◦N (along 10.4◦E), which takes place over the Mediterranean Sea. This dust ascent (from 5 to 8 km) could be attributed to the presence of a warm con-veyor belt (WCB) over the Mediterranean region (Eckhardt et al., 2004). For the case examined the agreement between the high values of the MODIS AOT and the DREAM data is quite good mainly over Italy and Greece, where dust loads ranging from 0.05 up to 0.75 g/m2were forecasted.
3.2 Synopsis of lidar (aerosol backscatter and extinction coefficients and lidar ratio) profiles (2000–2002) In order to justify the presence of Sahara dust over the mea-suring sites similar analysis with the example presented in the previous paragraph has been applied to all Raman lidar
(a) -30 -20 -10 0 10 20 30 40 LONGITUDE, degrees 20 25 30 35 40 45 50 55 LATITUDE, degrees 1000 900 800 700 600 500 400 300 200 100 PRESSURE, hPa -96 -72 -48 -24 0 TIME, hours ANALYTICAL BACKTRAJECTORIES
data provided by the German Weather Service
ATHENS, 19 UTC 28.08.00 975 hPa 850 hPa 700 hPa 500 hPa 300 hPa 200 hPa (b) -30 -20 -10 0 10 20 30 40 LONGITUDE, degrees 20 25 30 35 40 45 50 55 LATITUDE, degrees 1000 900 800 700 600 500 400 300 200 100 PRESSURE, hPa -96 -72 -48 -24 0 TIME, hours ANALYTICAL BACKTRAJECTORIES
data provided by the German Weather Service
ATHENS, 19 UTC 31.08.00 975 hPa 850 hPa 700 hPa 500 hPa 300 hPa 200 hPa (c) -30 -20 -10 0 10 20 30 40 LONGITUDE, degrees 20 25 30 35 40 45 50 55 LATITUDE, degrees 1000 900 800 700 600 500 400 300 200 100 PRESSURE, hPa -96 -72 -48 -24 0 TIME, hours ANALYTICAL BACKTRAJECTORIES
data provided by the German Weather Service
THESALONIKI, 19 UTC 31.08.00 975 hPa 850 hPa 700 hPa 500 hPa 300 hPa 200 hPa
Fig. 5. 96-h air-mass back-trajectories ending over Athens, Greece at 19:00 UT (a) on 28 August, (b) 31 August 2000 and over Thessaloniki at 19:00 UT (c) on 31 August 2000.
Fig. 6. Dust concentration (g/m3)(upper part) and dust loading (g/m2)(lower part) forecasted by the DREAM model for 31 August 2000 at 12:00 UT.
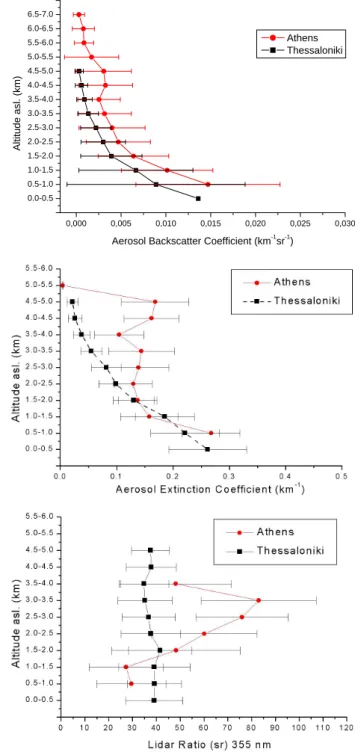
measurements performed during the Saharan dust “alerts” period. For these cases the aerosol backscatter and extinction coefficients, as well as the lidar ratio profiles at 355 nm were calculated for the 2000–2002 period over Athens and Thes-saloniki. In total 15 aerosol profiles (backscatter and extinc-tion coefficient and lidar ratio) were obtained from Raman measurements during nigttime, for each city in this study. The mean baer, aaerand LR profiles up to 5.5–7 km obtained
over Athens and Thessaloniki are shown in Figs. 7a, b and c, respectively. The corresponding standard deviation for the mean profiles is also shown.
In the case of the baer profile over Athens (Fig. 7a) a
dis-tinct dust layer is visible between 3.5 and 5.5 km a.s.l., which has an average value of the order of 3×10⁻³km-1 sr−1. The
baer values are quite high (>3×10⁻³km-1 sr−1)in the first
2 km at both sites, while they are higher in Athens than in Thessaloniki by a factor of ∼1.5, due to greater dust con-centrations normally measured inside the Planetary Bound-ary Layer (PBL) over Athens than over Thessaloniki. This is due to the higher air pollution levels in Athens and to the vicinity of this site to the African desert, thus higher dust loadings are found during Saharan dust events. The baer
pro-file over Thessaloniki closely follows the shape of that over Athens up to 4 km, showing no distinct dust layers in the free troposphere.
In the case of the aaer profile over Athens (Fig. 7b) two
distinct dust layers are visible; the first between 2 and 4 km and the second between 4 and 5.5 km a.s.l., showing an
average aerosol extinction coefficient of 0.15 km−1. The
cor-responding LR profile (Fig. 7c) shows values between 50– 80 sr inside the dust layer (2.5–4 km).
A quite different spatial distribution of the dust aerosols is found on the average profiles of aaerand LR over
Thessa-loniki (Fig. 7b and c), in comparison to the respective profiles over Athens. The mean LR profile over Thessaloniki shows mean values around 40 sr up to 4 km height and also a large standard deviation as in the case of Athens. Let us mention that both aaerand LR profiles over Thessaloniki show higher
values in comparison to Athens below 2–2.5 km. This could be explained by the fact of the usually higher relative hu-midity values found inside the PBL over Thessaloniki. How-ever, the dust layers found over Athens around 2.5 and 4.5 km height are also visible over Thessaloniki, however much less pronounced.
It is important to comment on the large standard deviation values around the baer, aaer and LR profiles, which reflect
the large variability of the aerosol vertical profiles observed during Saharan dust outbreaks over Greece, as well as the low number of cases considered. This could be explained by taking into account several factors: a) the variability of the magnitude of the dust outbreak, depending on the dis-tance from the dust source region and the pathways followed by the dust aerosols before reaching Greece, which would lead to different degrees of dilution along the different tra-jectories or dry deposition, which then would affect the shape of the particles (spheres-spheroids), b) the variability of the dust layer’s height and thickness depending on season and on the prevailing meteorological conditions and finally, c) the mixture between dust particles, maritime and continental polluted air-masses.
The corresponding LR mean values at 355 nm over Athens and Thessaloniki were equal to 53(±1) sr and 44(±2) sr, re-spectively (the numbers given inside the brackets show the corresponding standard error of the mean). It is interesting to comment now on the larger LR values observed over Athens than over Thessaloniki, at altitudes higher than 2.5 km. At first, let us remind that the LR is an indicator of the absorp-tion properties of particles (M¨uller et al., 2000). Therefore, increasing LR values might mean increasing absorption of the particles. Another important factor that might increase the LR for the same aerosol type is the non-sphericity of the particles (Mattis et al., 2002; Ansmann et al., 2003). Athens is closer to the source region therefore there is a larger pos-sibility for large non-spherical particles to be present in the dust layer, relative to Thessaloniki, which is 400 km north of Athens and therefore dry deposition processes might have removed part of these particles.
We also know that the LR values depend on RH values (Ackermann, 1998). However, the RH values are generally quite similar on the height range from 2.5 to 5 km, between the two sites, during Saharan dust outbreaks. Therefore, no difference is expected on the LR due to this factor. Another factor influencing the LR values in the lower troposphere is
0.0-0.5 0.5-1.0 1.0-1.5 1.5-2.0 2.0-2.5 2.5-3.0 3.0-3.5 3.5-4.0 4.0-4.5 4.5-5.0 5.0-5.5 5.5-6.0 6.0-6.5 6.5-7.0 0,000 0,005 0,010 0,015 0,020 0,025 0,030
Aerosol Backscatter Coefficient (km-1sr-1)
Altitude asl. (km)
Athens Thessaloniki
Fig. 7. The mean aerosol backscatter (a), extinction (b) and lidar ratio (c) profiles at 355 nm, obtained over Athens and Thessaloniki, Greece during the period 2000–2002. The standard deviation is also shown.
the local air pollution level. It is known that higher air pol-lution levels usually prevail over Athens than over Thessa-loniki, therefore higher LR are expected under more polluted conditions (M¨uller et al., 2000). Therefore, we believe that all these factors may fully explain the different LR values measured over Thessaloniki and Athens.
Athens 700hPa
-60 -40 -20 0 20 40 LONGITUDE, degrees 10 20 30 40 50 60 70 LA TITUDE , d egrees ANALYTICAL BACKTRAJECTORIESdata provided by the German Weather Service
Thessaloniki 700hPa
-20 0 20 40 LONGITUDE, degrees 30 40 50 60 LA TITUDE , degrees ANALYTICAL BACKTRAJECTORIESdata provided by the German Weather Service
Fig. 8. Air-mass back-trajectories ending (a) over Athens at 700 hPa during 50 Saharan dust events (67 days of observations) and (b) over Thessaloniki at 700 hPa during 17 Saharan dust events (20 days of observations) (2000–2002).
Similar LR values as the ones reported in this paper (rang-ing from 45–60 sr) have been recently reported in the UV spectrum by De Tomasi et al. (2003) during a Saharan dust event on May 2001 over Southern Italy, while those reported by Ansmann et al. (2003) and by M¨uller et al. (2003) during October 2001 over central Europe were higher (50 to 90 sr) within the dust layer. Lidar ratios ranging from 42 to 47 sr at 355 nm were also obtained for desert dust aerosols using numerical Mie theory simulations (Ackerman, 1998). Our results on the average LR values observed at 355 nm over Athens and Thessaloniki during Saharan dust outbreaks are also comparable (if we take the wavelength dependence into account) to the ones reported for dust layers at 532 nm, by M¨uller et al. (2000) and by Sakai et al. (2002), over the In-dian Ocean and Japan, respectively.
The corresponding AOT values derived by the Raman lidar data at 355 nm in the altitude range 0.6–5 km, during Saha-ran dust outbreaks were similar for the two cities and were found equal to 0.69(±0.12) and 0.65(±0.10) for Athens and Thessaloniki, respectively. These values compare very well with the values retrieved by the MODIS sensor over Greece at 550 nm during the Saharan dust outbreaks, which typically are of the order of 0.45–0.55 (Fig. 3), if we take into ac-count for the wavelength dependence of the AOT between 355 nm and 550 nm. Similar mean AOT values retrieved from MODIS observations during Saharan dust events were recently reported by Barnaba and Gobbi (2004) over Greece.
If we calculate the AOT inside the dust layers (between 2.5 and 5 km) we obtain a value around 0.23 over Athens and around 0.21 over Thessaloniki. These values are also similar to the AOT values of 0.21–0.26 at 351 nm, recently reported by De Tomasi et al. (2003) inside the dust layers observed over Southern Italy during a Saharan dust event occurred on May 2001, but slightly lower than the AOT values measured over Leipzig, Germany during a similar dust event occurred on October 2001 (M¨uller et al., 2003).
3.3 Synopsis of air-mass back-trajectories (2000–2002) In this section a synopsis of all back-trajectories ending over Athens and Thessaloniki (at 700 hPa pressure level) during Saharan dust outbreaks in the period 2000–2002 is given. Figure 8a shows all air-mass back-trajectories ending over Athens at level 700 hPa during the 50 observed Saharan dust outbreaks (corresponding to 67 days of observations). A sim-ilar figure (Fig. 8b) is produced for the air-masses ending over Thessaloniki at 700 hPa during the 17 Saharan dust out-breaks (corresponding to 20 days of observations) and for the same time period of measurements. Comparing now these air-mass back trajectory data it is evident that the air-masses rich in Saharan dust particles follow a preferable NE direc-tion starting from the Saharan desert region and ending at the Eastern Mediterranean Sea. This is more evident in the case of Athens where more statistically significant trajectory data are available.
Fig. 9. Seasonal variability of Saharan dust events observed by lidar over Athens (a) and over Thessaloniki (b) during the measuring period of the EARLINET project (2000–2002).
According to Figs. 8a and b for both Greek cities the most important source regions of Saharan dust events are the Northern African countries, namely (with decreasing impor-tance) Algeria, Libya, Tunisia and Morocco. It is interesting to note that similar findings were recently published for the most important source countries of Saharan dust events at the Jungfraujoch site in Switzerland (Collaud Cohen et al., 2004).
In any case from these two figures we can conclude that the western and south-western sectors of Greece are the most preferable sectors followed by the air-masses transported in the free troposphere (between 3 and 5.5 km height) ending over Greece during Saharan dust outbreaks. It is also inter-esting to mention that in the reporting period no Saharan dust transport was observed from Africa to the Eastern Mediter-ranean Sea, through central-northern Europe, during major Saharan dust events, which occurred over central Europe in 2001 and 2002 (Ansmann et al., 2003).
3.4 Seasonal distribution of Saharan dust events (2000– 2002)
Although, the monthly distribution of the Saharan dust trans-port events over the Mediterranean Sea can be obtained from satellite observations, there are only two available publications, on a 11-year (1983–1994) climatology. The first publication is limited to the Western Mediterranean re-gion (Moulin et al., 1997b), while the second refers to the whole Mediterranean Basin (Moulin et al., 1998). Both cli-matic studies have been conducted using METEOSAT visi-ble channel images and mostly under cloud-free conditions. Moulin et al. (1998) have observed that the maximal north-ward transport shifts from the eastern to the western basin during March to August and that during autumn and winter there is very little dust transport.
Our lidar observations over Athens obtained between 2000–2002 (in total 32 months were covered), during Sa-haran dust events, although concern a relatively low num-ber of years compared to the 11-years cycle investigated by
Moulin et al. (1998), showed that the autumn period can also be considered as a period with important Saharan dust trans-port over the Eastern Mediterranean region. The seasonal distribution of Saharan dust events observed over Athens and Thessaloniki during the observation period of the EAR-LINET project (limited to cloud-free conditions) is presented in Figs. 9a and b, respectively. For instance over Athens 14 cloud-free cases have been reported -out of a total number of 50 cases- during the autumn period (September to November 2000–2002). Both Figs. 9a and b show that during the sum-mer and autumn months most of the Saharan dust outbreaks (40–50% of the cases) generally reach the Eastern Mediter-ranean region. This is linked to the synoptic meteorological situation where Greece is influenced by air-masses coming form the western-southwestern directions (Prezerakos et al., 2004). Springtime period (mostly the month of May) is the next favorable period for Saharan dust outbreaks monitoring mostly over Athens. Winter period is of course the less fa-vorable period for such observations, not only due to cloud cover, but also due to the synoptic meteorological situation, where Greece is mostly influenced by air-masses originating from the North Polar region.
We believe that it is also interesting to mention that our re-cent findings have shown a mean number of 18 Saharan dust events per year in the time period May 2000–May 2003 over Athens (B¨osenberg et al., 2003). This of course is not statis-tically significant, due to the small number of years consid-ered in this study. However, this compares favorably well to a mean value of 16 Saharan dust events per year, during an 11-years period (1983–1994), reported by Moulin et al. (1997b) concerning the Ligurian Sea in the Western Mediterranean region.
4 Conclusions
In this paper we presented vertical profiles of Saharan dust aerosols over the Eastern Mediterranean region, obtained over two sites (Athens and Thessaloniki), using elastic
backscatter-Raman lidar systems, in the frame of the Euro-pean EARLINET project. A selected case of Saharan dust transport to the Eastern Mediterranean was analytically pre-sented using lidar, spectrophotometric and satellite obser-vations, complemented by air-mass back-trajectory analysis and dust model data. During the whole period of observa-tions of the EARLINET project (2000–2002) multiple dis-tinct dust layers of variable thickness (200–3000 m) were systematically observed over the Eastern Mediterranean re-gion in the altitude rere-gion between 1.5 and 6.5 km height above sea level. However, the greatest aerosol loading erally occurred between 2 and 5 km. The dust layers gen-erally traveled the distance between the Saharan region and the E. Mediterranean (3000 to 4000 km) in a period of 2–4 days. Athens was more privileged than Thessaloniki in ob-serving a higher number of Saharan dust events since it is located closer to the African continent and generally expe-riences clearer skies. This is evident in the total number of Saharan dust events observed over Athens (50 events) ver-sus 17 events observed over Thessaloniki. A mean number of 18 Saharan dust events per year in the time period May 2000–May 2003 was reported over Athens, but this is not statistically significant due to the small number of years con-sidered.
Back-trajectory analysis performed in the period 2000– 2002 for all Saharan dust outbreaks over the Eastern Mediter-ranean indicated, for the first time, the main pathways fol-lowed by the Saharan dust aerosols from the source areas to the Eastern Mediterranean Sea. This helped us to conclude that the western and south-western sectors of Greece are the most preferable sectors followed by the air-masses trans-ported in the free troposphere (between 3 and 5.5 km height) ending over Greece during Saharan dust outbreaks. We also showed that during the summer and autumn months most of the Saharan dust outbreaks (40–50% of the cases) generally reach the Eastern Mediterranean region. This is linked to the synoptic meteorological situation where Greece is influenced by air-masses coming form the western-southwestern direc-tions.
Another interesting feature revealed by the analysis of combined lidar and satellite data during Saharan dust out-breaks showed that the origin of the dust particles was the lower troposphere over the Saharan region in N-NW Africa and that the MODIS AOT values can reach values higher than 0.6 at 550 nm over the Eastern Mediterranean Sea during important Saharan dust outbreaks. Concerning the aerosol optical properties of the dust layers a mean value of the li-dar ratio at 355 nm, was obtained over Athens (53±1 sr) and over Thessaloniki (44±2 sr) in the period 2000–2002, as de-rived by the Raman lidar data. The corresponding aerosol optical thickness (AOT) at 355 nm, in the altitude range 0.6– 5 km, was found equal to 0.69±0.12 and to 0.65±0.10 over Athens and Thessaloniki, respectively. The mixing of dust particles with sea-salt particles of maritime origin could pos-sibly explain the lower mean LR value (Ackermann, 1998)
observed over Thessaloniki, than over Athens. In addition to that, higher air pollution levels over Athens would lead to higher LR values, as expected under more polluted con-ditions (M¨uller et al., 2000). The presence of more non-spherical particles over Athens may also explain the larger LR values observed in this site compared to those measured over Thessaloniki.
We believe that the lidar data on the dust aerosol vertical profiles presented at 355 and 532 nm are indicative for our area and will be a very important input for regional radia-tive transfer models (RTM) and atmospheric chemistry trans-port models (ACTM) over the Eastern Mediterranean region (Diaz et al., 2000; Lelieveld et al., 2002), as well as for atmo-spheric correction of ocean color imagery data (Moulin et al., 2001). Our lidar ratio observations could also contribute to a better calibration over the Eastern Mediterranean region of the forthcoming two-wavelength space lidar CALIPSO mis-sion. These height-derived dust aerosol profiles can also be used for the corrections of the retrieval of the tropospheric ozone profiles derived from satellite data (i.e. by the Ozone Monitoring Instrument (OMI) on board the recently launched Aura spacecraft) during Saharan dust events.
Similar work on radiative transfer calculations has been reported recently by Wagner et al. (2001) using lidar aerosol profiles obtained during the Indian Ocean Experiment (IN-DOEX) on March 1999. In addition, our lidar data can be also used as input data in operational Saharan dust forecast models and thus will be valuable for long-term studies on the radiative forcing of aerosols in the Mediterranean Sea (Sciare et al., 2003; Meloni et al., 2004). Of course, long-term lidar data are certainly required over the whole Mediterranean re-gion to better evaluate the dust aerosol optical properties in the ultraviolet and visible part of the spectrum, in conjunc-tion with available satellite data and AOT data derived by the AERONET network. This will help to better assess the aerosol radiative properties in this area. These studies, al-ready started in the frame of the EARLINET project, should be continued on a long-term basis, and should be combined with modeling phase functions of aerosols of different shapes and dimensions (Mishchenko et al., 1997).
Acknowledgements. We acknowledge the support of the European Union (contract EVR1-CT1999-40003) and the co-funding by the GSRT-PENED project (contract 01ED-58). Air-mass trajectory analysis was performed by the German Weather Service (DWD), using an IDL code provided by I. Mattis (IFT, Germany). The MODIS data were provided by ESA-NASA. The MODIS data used in this study were acquired as part of the NASA’s Earth Science Enterprise. The MODIS data were processed by the MODIS Adaptive Processing System (MODAPS) and Goddard Distributed Active Archive Center (DAAC) and are archived and distributed by the Goddard DAAC. G. Kallos (UoA, Greece) for providing aerosol dust data from the SKIRON/Eta model.
References
Ackermann, F. A. and Chung, H.: Radiative effects of airborne dust and regional energy budget at the top of the atmosphere, J. Appl. Meteor., 31, 223–236, 1992.
Ackermann, J.: The extinction-to-backscatter ratio of tropospheric aerosol: a numerical study, J. Atmos. Ocean. Techn., 15, 1043– 1050, 1998.
Alpert, P., Kaufman, Y., Shay-El, Y., Tanr´e, D., da Silva, A., Schu-bert, S., and Joseph, J.: Quantification of dust-forced heating of the lower troposphere, Nature, 395, 367–370, 1998.
Anderson, T. L., Charlson, R. J., Schwartz, S. E., Knutti, R., Boucher, O., Rodhe, H., and Heitzenberg, J.: Climate forcing by aerosols – a hazy picture, Science, 300, 1103–1104, 2003 Andreae, M. and Crutzen, P.: Atmospheric Aerosols: Biochemical
sources and role in atmospheric chemistry, Science, 276, 1052– 1057, 1997.
Ansmann, A., Wandinger, U., Riebesell, M., Weitkamp, C., and Michaelis, W.: Independent measurements of extinction and backscatter profiles in cirrus clouds using a combined Raman elastic-backscatter lidar, Appl. Opt., 22, 2257–2264, 1992. Ansmann, A., Bosenberg, J., Chaikovsky, A., et al.:
Long-range transport of Saharan dust to northern Europe: The 11– 16 October 2001 outbreak observed within EARLINET, J. Geophys. Res., 108(D24), 4783, doi:10.1029/2003JD003757, 10.1029/2003JD003, 2003.
Balis, D., Papayannis, A., Galani, E., Marenco, F., Santacesaria, V., Hamonou, E., Chazette, P., Ziomas, I., and Zerefos, C.: Tro-pospheric LIDAR aerosol measurements and sun photometric observations at Thessaloniki, Greece, Atmos. Environ. 34, 925– 932, 2000.
Balis, D., Amiridis, V., Nickovic, S., Papayannis, A., and Zerefos, C.: Optical properties of Saharan dust layers as detected by a Raman lidar at Thessaloniki, Greece, Geophys. Res. Lett., 31, L13104, doi:10.1029/2004GL019881, 2004.
Barnaba, F. and Gobbi, G. P.: Aerosol seasonal variability over the Mediterranean region and relative impact of maritime, continen-tal and Saharan dust particles over the basin from MODIS data in the year 2001, Atmos. Chem. Phys., 4, 2367–2391, 2004, SRef-ID: 1680-7324/acp/2004-4-2367.
B¨ockmann, C., Wandinger, U., Ansmann, A., B¨osenberg, J., Amiridis, V., Boselli, A., Delaval, A., De Tomasi, F., Frioud, M., Grigorov, I., Hagard, A., Horvat, M., Iarlori, M., Komguem, L., Kreipl, S., Larcheveque, G., Matthias, V., Papayannis, A., Pappalardo, G., Rocadenbosch, F., Rodrigues, J. A., Schneider, J., Shcherbakov, V., and Wiegner, M.: Aerosol lidar intercom-parison in the framework of the EARLINET project: Part II – Aerosol backscatter algorithms, Appl. Opt., 43, 977–989, 2004. Bonasoni, P., Cristofanelli, P., Calzolari, F., Bonaf´e, U.,
Evange-listi, F., Stohl, A., Zauli Sajani, S., van Dingenen, R., Colombo, T., and Balkanski, Y.: Aerosol-ozone correlations during dust transport episodes, Atmos. Chem. Phys., 4, 1201–1215, 2004, SRef-ID: 1680-7324/acp/2004-4-1201.
B¨osenberg, J., Timm, R., and Wulfmeyer, V.: Study of retrieval algorithms for a backscatter lidar, Final Report, MPI Report No. 226, pp. 1–66, Hamburg, 1997.
B¨osenberg, J., Balis, D., Flamant, P., Papalardo, G., Papayannis, A., Pelon, J., Schneider, J., Trickl, T., and Visconti, G.: EAR-LINET: A European Aerosol Research Lidar Network, in: Ad-vances in Laser Remote Sensing, edited by: Dabas, A., Loth, C.,
and Pelon, J., 155–158, 2001.
B¨osenberg, J., Matthias, V., Amodeo, A., et al.: EARLINET project: A European Aerosol Research Lidar Network. Contract EVR1-CT1999-40003, Final Report, pp. 1–250, Hamburg, 2003. Charlson, R., Schwartz, S., Hales, J., Cess, R., Coakley Jr., J., Hansen, J., and Hofmann, D.: Climate forcing by anthropogenic aerosols, Science, 255, 423–430, 1992.
Collaud Cohen, M., Weingartner, E., Schaub, D., Corrigan, C., Hen-ning, S., Schwikowski, M., and Baltensperger, U.: Saharan dust events at the Jungfraujoch site: detection by wavelength depen-dence of the single scattering albedo and fist climatology analy-sis, Atmos. Chem. Phys., 4, 2465–2480, 2004,
SRef-ID: 1680-7324/acp/2004-4-2465.
D’Almeida, G. A.: A model for Saharan dust transport, J. Climate Appl. Meteor., 24, 903–916, 1986.
D’Almeida, G. A., Koepke, P., and Shettle, E. P.: Atmo-spheric aerosols, Global climatology and radiative characteris-tics, Hampton, Virginia, 1991.
De Tomasi, F., Blanco, A., and Perrone, M. R.: Raman lidar moni-toring of extinction and backscattering of African dust layers and dust characterization, Appl. Opt., 42, 1699–1709, 2003. Diaz, J., Exposito, F. J., Arbelo, M., Hernandez-Leal, P. A., Torres,
C., and Carreno, V.: Radiative transfer modeling in the UV-VIS region with the presence of Saharan dust mineral desert aerosols, Adv. Space Res., 26, 1009–1012, 2000.
Dickerson, R., Kondragunta, S., Stenchikov, G., Civerolo, K., Dod-dridge, B., and Holben, B.: The impact of aerosols on solar ul-traviolet radiation and photochemical smog, Science, 278, 827– 830, 1997.
Di Sarra, A., di Iorio, T., Cacciani, M., Fiocco, G., and Fua, D.: Sa-haran dust profiles measured by lidar at Lampedusa, J. Geophys. Res., 106, 10 335–10 348, 2001.
Duce, R. A.: Sources, distribution and fluxes of mineral aerosols and their relationship to climate, in: Aerosol Forcing on Climate, edited by: Carlson, R. J. and Heintzenberg, J., Wiley, New York, 43–72, 1995.
Dulac, F., Tanr´e, D., Bergametti, G., Buat-Menard, P., Desbois, M., and Sutton, D.: Assessment of the African airborne dust mass over the Western Mediterranean Sea using Meteosat data, J. Geo-phys. Res., 97, 2489–2506, 1992.
Dulac, F. and Chazette, P.: Airborne study of a multi-layer aerosol structure in the eastern Mediterranean observed with the airborne polarized lidar ALEX during the STAAARTE campaign (7 July 1997), Atmos. Chem. Phys., 3, 1817–1831, 2003,
SRef-ID: 1680-7324/acp/2003-3-1817.
Dunion, J. and Velden, C.: The impact of the Saharan air layer on Atlantic tropical cyclone activity, Bull. Amer. Meteor. Soc., 85, 353–365, 2004.
Eck, T. F., Holben, B., Reid, J. S., Dubovik, O., Smirnov, A., O’Neil, N. T., Slutsker, I., and Kinne, S.: Wavelength depen-dence of the optical depth of biomass burning, urban and dust aerosols, J. Geophys. Res., 104, 31 333–31 349, 1999.
Eckhardt, S., Stohl, A., Wernli, H., Forster, C., and James, P.: A 15-year climatology of warm conveyor belts, J. Climate, 17, 218– 237, 2004.
Ginoux, P., Prospero, J. M., Torres, O., and Chin, M.: Long-term simulation of dust distribution with the GOCART model: corre-lation with the North Atlantic oscilcorre-lation, Environ. Model. Soft., 19, 113–128, 2004.
Gleason, J., Hsu, N., and Torres, O.: Biomass burning smoke mea-sured using backscattered ultraviolet radiation: SCAR-B and Brazilian smoke inter-annual variability, J. Geophys. Res., 103, 31 969–31 978, 1998.
Gobbi, G. P., Barnaba, F., Giorgi, R., and Santacasa, A.: Altitude-resolved properties of a Saharan dust event over the Mediter-ranean, Atmos. Environ., 34, 5119–5127, 2000.
Gobbi, G. P., Barnaba, F., Blumthaler, M., Labow, G., and Herman, J. R.: Observed effects of particles nonsphericity on the retrieval of marine and desert dust aerosol optical depth by lidar, Atmos. Res., 61, 1–14, 2002.
Hamonou, E., Chazette, P., Balis, D., Dulac, F., Schneider, X., Galani, E., Ancellet, G., and Papayannis, A.: Characterization of the vertical structure of Saharan dust export to the Mediterranean basin, J. Geophys. Res., 104, 22 257–22 270, 1999.
Holben, B. N., Tanr´e D., Smirnov, A., Eck, T. F., Slutsker, I., Abuhassan, N., Newcomb, W. W., Schafer, J. S., Chatenet, B., Lavenu, F., Kaufman, Y. J., Castle, J. V., Setzer, A., Markham, B., Clark, D., Frouin, R., Halthore, R., Karneli, A., O’Neill, N. T., Pietras, C., Pinker, R. T., Voss, K., and Zibordi, G.: A emerging ground-based aerosol climatology: aerosol optical depth from AERONET, J. Geophys. Res., 106, 12 067–12 097, 2001.
Houghton, J. T., Ding, W., Griggs, D. J., Noguer, M., van der Lin-den, P. J., and Xiaosu, D.: Climate Change 2001: The Scien-tific Basis, Contribution of Working Group I to the Third Assess-ment Report of the IntergovernAssess-mental Panel on Climate Change (IPCC), Cambridge University Press, 2001.
Hsu, N. C., Herman, J. R., Bhartia, P. K., Seftor, C. J., Torres, O., Thompson, A. M., Gleason, J. F., Eck, T. F., and Holben, B. N.: Detection of Biomass Burning Smoke from TOMS Measure-ments, Geophys. Res. Lett., 23, 745–748, 1996.
Husar, R. B., Prospero, J. M., and Stowe, L.L.: Characterization of tropospheric aerosols over the oceans using the NOAA ad-vanced very high-resolution radiometer optical thickness opera-tional product, J. Geophys. Res., 102, 16 899–16 909, 1997. Ignatov, A., Stowe, L., and Singh, R.: Sensitivity study of the
?ngstr¨om exponent derived from AVHRR over the oceans, Adv. Space Res., 21, 439–442, 1998.
Jankowiak, I. and Tanr´e, D.: Satellite climatology of Saharan dust outbreaks: method and preliminary results, J. Climate, 5, 646– 656, 1992.
Karyampudi, V., Palm, S., Reagan, J., Fang, H., Grant, W., Hoff, R., Moulin, S., Pierce, H., Torres, O., Browell, E. V., and Melfi, S. H.: Validation of the Saharan dust plume conceptual model using lidar, Meteosat and ECMWF data, Bull. Amer. Meteor. Soc., 80, 1045–1075, 1999.
Kaufman, Y., Tanr´e, D., Gordon, H., Nakajima, T., Lenoble, J., Frouin, R., Grassl., H., Herman, B., King, M., and Teliet, P. M.: Passive remote sensing of tropospheric aerosol and atmospheric correction for the aerosol effect, J. Geophys. Res., 102, 16 815– 16 830, 1997.
Kaufman, Y. and Tanr´e, D.: Algorithms for remote sensing of tro-pospheric aerosol from MODIS. NASA MODIS Algorithm The-oretical Basis Document, Goddard Space Flight Center, pp. 85, 1998.
King, M. D., Kaufman, Y. J., Tanr´e, D., and Nakajima, T.: Remote sensing of tropospheric aerosol from Space: past, present, and future, Bull. Amer. Meteor. Soc., 80, 2229–2259, 1999.
Klett, J.: Lidar inversion with variable backscatter to extinction ra-tios, Appl. Opt., 24, 1638–1643, 1985.
Kottmeir, C. and Fay, B.: Trajectories in the Antarctic lower tropo-sphere, J. Geophys. Res., 105, 10 947–10 959, 1998.
Krueger, O. and Grassl, H.: The indirect effect over Europe, Geophys. Res. Lett., 29(19), 1925, doi:10.1029/2001GL014081, 2002.
Lelieveld, J., Berresheim, H., Borrmann, S., et al.: Global air pollu-tion crossroads over the Mediterranean, Science, 298, 794–799, 2002.
Lohmann, U. and Feichter, F.: Can the direct and the semi-direct aerosol effect compete with the indirect effect on a global scale?, Geophys. Res. Lett., 28, 159–161, 2001.
Matthias, V., Freudenthaler, V., Amodeo, A., et al.: Aerosol lidar inter-comparison in the framework of the EARLINET project. 1. Instruments, Appl. Opt., 43, 961–976, 2004.
Mattis, I., Ansmann, A., M¨uller, D., Wandinger, U., and Althausen, D.: Dual-wavelength Raman lidar observations of the extinction-to-backscatter ratio of Saharan dust, Geophys. Res. Lett., 29, doi:10.1029/2002GL014721, 2002.
Mattis, I., Ansmann, A., M¨uller, D., Wandinger, U., and Althausen, D.: Multiyear aerosol observations with dual-wavelength Raman lidar in the framework of EARLINET, J. Geophys. Res., 109, D13203, doi:10.1029/2004JD004600, 2004.
Meloni, D., di Sarra A., Di Iorio, T., and Fiocco, G.: Direct radiative forcing of Saharan dust in the Mediterranean from measurements at Lampedusa island and MISR space-borne observations, J. Geophys. Res., 109, D08206, doi:10.1029/2003JD003960, 2004. Mishchenko, M., Travis, L., Kahn, R., and West, R.: Modeling phase functions for dust-like tropospheric aerosols using a shape mixture of randomly oriented polydisperse spheroids, J. Geo-phys. Res., 102, 16 831–16 847, 1997.
Moulin, C., Lambert, C. E., Dulac, F., and Dayan, U.: Control of atmospheric export of dust from North America by the North Atlantic Oscillation, Nature, 387, 691–694, 1997a.
Moulin, C., Dulac, F., Lambert, C. E., Chazette, P., Jankowiak, I., Chatenet, B., and Lavern, F.: Long-term daily monitoring of Sa-haran dust load over ocean using Meteosat ISCCP-B2 data. 2. Accuracy of the method and validation of Sun photometer mea-surements, J. Geophys. Res., 102, 16 959–16 969, 1997b. Moulin, C., Gordon, H. R., Chomko, R. M., Banzon, V. F., and
Evans, R. H.: Atmospheric correction of ocean color imagery through thick layers of Saharan dust, Geophys. Res. Lett., 28, 5–8, 2001.
Moulin, C., Lambert, C. E., Dayan, U., et al.: Satellite climatol-ogy of African dust transport in the Mediterranean atmosphere, J. Geophys. Res., 103, 13 137–13 144, 1998.
Moulin, C. and Chiapello, I.: Evidence of the control of summer atmospheric transport of African dust over the Atlantic by Sahel sources from TOMS satellites (1979–2000), Geophys. Res. Lett., 31, L02107, doi:10.1029/2003GL018931, 2004.
M¨uller, D., Wagner, F., Althausen, D., Wandinger, U., Ansmann, A., and Heintzenberg, J.: Physical particle properties of the Indian aerosol plume derived from six-wavelength lidar observations on 25 March 1999 of the Indian Ocean Experiment, Geophys. Res. Lett., 27, 1403–1406, 2000.
M¨uller, D., Franke, K., Wagner, F., Althausen, D., Ansmann, A., Heintzenberg, J., and Verner, G. H. L.: Vertical profiling of optical and physical particle properties over the tropical Indian
Ocean with six-wavelength lidar, 2. Case studies, J. Geophys. Res., 106, 28 577–28 595, 2001.
M¨uller, D., Mattis, I., Wandinger, U., Althausen, D., Ansmann, A., Dubovik, O., Eckhardt, S., and Stohl, A.: Saharan dust event over a central European EARLINET-AERONET site, J. Geo-phys. Res., 108(D12), 4345, doi:10.1029/2002JD002918, 2003. Nickovic, S., Kallos, G., Papadopoulos, A., and Kakaliagou, O.: A
model for prediction of desert dust cycle in the atmosphere, J. Geophys. Res., 106, 18 113–18 130, 2001.
Pandis, S., Wexler A., and Seinfeld, J.: Dynamics of tropospheric aerosol. J. Phys. Chem., 99, 9646–9659, 1995.
Papayannis, A. and Chourdakis, G.: The EOLE project: a multi-wavelength laser remote sensing (lidar) system for ozone and aerosol measurements in the troposphere and the lower strato-sphere. Part II: Aerosol measurements over Athens, Greece, In-ter. J. Rem. Sens., 23, 179–196, 2002.
Pappalardo, G., Amodeo, A., Amoruso, S., Mona, L., Pandolfi, M., and Cuomo, V.: One year of tropospheric lidar measurements of aerosol extinction and backscatter, Ann. Geophysics, 46, 401– 413, 2003.
Pappalardo, P., Amodeo, A., Wandinger, U., Matthias, V., Boesen-berg, J., Alpers, M., Amiridis, V., de Tomasi, F., Frioux, M., Iar-lori, M., Komguen, L., Larcheveque, G., Papayannis, A., Schu-macher, R., and Wang, X.: Aerosol lidar intercomparison in the framework of the EARLINET project. 3. Raman lidar algorithm for aerosol extinction, backscatter and lidar ratio, Appl. Opt., 43, 5370–5385, 2004.
Perrone, M. R., Santese, M., Tafuro, A. M., Holben, B., and Smirnov, A.: Aerosol load characterization over south-east Italy for one year of AERONET sun-photometer measurements, At-mos. Res., 75, 111–133, 2005.
Prezerakos, N., Paliatsos, A., Anastasatos, D., and Sassalos, S.: Di-agnosis of the relationship between dust storms and Sahara desert and dust deposit in the South Balkans, Proc. 6th Hellenic Conf. Climat. Atmos. Phys., 786–795, 2004.
Prospero, J. M. and Carlson, T.: Saharan air outbreaks over the trop-ical North Atlantic, Pure Appl. Geophys., 119, 678–691, 1972. Prospero, J. M., Savoie, D. L., Arimoto, R., and Huang, F.:
Long-term trends in African mineral dust concentration over the west-ern North Atlantic: Relationship to North African rainfall, EOS Trans., AGU 74, Fall Meeting, Suppl., 146, 1993.
Prospero, J. M., Barrett, K., Church, T., Dentener, F., Duce, R. A., Galloway, H., Levy II, H., Moody, J., and Quinn, P.: At-mospheric deposition of nutricients to the North Atlantic basin, Biogeochem., 35, 27–73, 1996.
Prospero, J. M.: Long-term measurements of the transport of African mineral dust to the Southeastern United States: Impli-cations for regional air quality, J. Geophys. Res., 104, 15 917– 15 927, 1999.
Prospero, J. M., Ginoux, P., Torres, O., Nicholson, S. E., and Gill, T.: Environmental characterization of global sources of atmo-spheric soil dust identified with Nimbus 7 Total Ozone Mapping Spectrometer (TOMS) absorbing aerosol product, Rev. Geo-phys., 40, 1002, doi:10.1029/2000RG000095, 2002.
Rodriguez, S., Querol, X., Alastey, A., Kallos, G., and Kakaliagou, O.: Saharan dust contributions to PM10and TSP levels in
south-eastern and south-eastern Spain, Atmos. Environ., 35, 2433–2447, 2001.
Sakai, T., Shibata, T., Iwasaka, Y., Nagai, T., Nakazato, M., Mat-sumura, T., Ichiki, A., Kim, Y. S., Tamura, K., Troshkin, D., and Hamdi, S.: Case study of Raman lidar measurements of Asian dust events in 2000 and 2001 at Nagoya and Tsukuba, Japan, Atmos. Environ., 36, 5479–5489, 2002.
Salomonson, V., Barnes, W., Maymon, P., Montgomery, H., and Ostrow, H.: MODIS – Advanced facility instrument for studies of the earth as a system, IEEE Trans. Geosc. Rem. Sens., 27, 145–153, 1999.
Satheesh, K. and Krishna Moorthy, K.: Radiative effects of natural aerosols: A review, Atmos. Environ., 39, 2089–2110, 2005. Schrope, M.: Trouble in the Greenhouse, Nature, 407, 10–12, 2000. Sciare, J., Bardouki, H., Moulin, C., and Mihalopoulos, N.: Aerosol sources and their contribution to the chemical composition of aerosols in the Eastern Mediterranean Sea during summertime, Atmos. Chem. Phys., 3, 291–302, 2003,
SRef-ID: 1680-7324/acp/2003-3-291.
Seinfeld, J. H. and Pandis, S. N.: Atmospheric Chemistry and Physics: From Air Pollution to Climate Change, J. Wiley and Sons Inc., New York, USA, 1998.
Seinfeld, J. H., Carmichael, G., Arimoto, R., et al.: ACE-ASIA, Regional climatic and atmospheric chemical effects of Asian dust and pollution, Bull. Amer. Meteor. Soc., 85, 367–380, 2004. Stohl, A.: Computation, accuracy and application of trajectories-a
review and bibliography, Atmos. Environ., 32, 947–966, 1998. Stohl, A.: A one-year Langrangian “climatology” of airstreams
in the northern hemisphere troposphere and lowermost strato-sphere, J. Geophys. Res., 106, 7263–7279, 2001.
Stowe, L. L., Ignatov, A. M., and Singh, R. R.: Development, vali-dation and potential enhancements to the second-generation op-erational aerosol product at the National Environmental Satel-lite, Data, and Information Service of the National Oceanic and Atmospheric Administration, J. Geophys. Res., 102, 16 923– 16 934, 1997.
Thompson, A. M., Witte, J., Hudson, R., Guo, H., Herman, J., and Fujiwara, M.: Tropical tropospheric ozone and biomass burning, Science, 291, 2128–2132, 2001.
Torres, O. and Barthia, P. K.: Impact of tropospheric aerosol ab-sorption on ozone retrieval from backscatter ultraviolet measure-ments, J. Geophys. Res., 104, 21 569–21 577, 1999.
Torres, O., Barthia, P. K., Herman, J. R., Sinyuk, A., Ginoux, P., and Holben, B.: A long-term record of aerosol optical depth from TOMS observations and comparison to AERONET mea-surements, J. Atmos. Sci., 59, 398–413, 2002.
Wafers, M. and Jaenicke, R.: Aerosols, Pergamon Press, NewYork, 1990.
Wagner, F., M¨uller, D., and Ansmann, A.: Comparison of radia-tive impact of aerosols derived form vertically resolved (lidar) and vertically integrated (sun photometer) measurements: exam-ple of the Indian aerosol plume, J. Geophys. Res., 106, 22 861– 22 870, 2001.
Wolfe, R., Nishihamaa, M., Fleiga, A., Kuypera, J, Roya, D., Storeyb, J., and Pattg, F.: Achieving sub-pixel geolocation ac-curacy in support of MODIS land science, Rem. Sens. Environ., 83, 31–49, 2002.