HAL Id: hal-01829903
https://hal.archives-ouvertes.fr/hal-01829903
Submitted on 4 Jul 2018
HAL is a multi-disciplinary open access
archive for the deposit and dissemination of
sci-entific research documents, whether they are
pub-lished or not. The documents may come from
teaching and research institutions in France or
abroad, or from public or private research centers.
L’archive ouverte pluridisciplinaire HAL, est
destinée au dépôt et à la diffusion de documents
scientifiques de niveau recherche, publiés ou non,
émanant des établissements d’enseignement et de
recherche français ou étrangers, des laboratoires
publics ou privés.
Relationship between phytoplankton efficiency and the
proportion of bacterial production to primary
production in the Mediterranean Sea
P. Conan, C. Turley, E Stutt, Mireille Pujo-Pay, France van Wambeke
To cite this version:
P. Conan, C. Turley, E Stutt, Mireille Pujo-Pay, France van Wambeke.
Relationship between
phytoplankton efficiency and the proportion of bacterial production to primary production in
the Mediterranean Sea.
Aquatic Microbial Ecology, Inter Research, 1999, 17 (2), pp.131-144.
�10.3354/ame017131�. �hal-01829903�
AQUATIC MICROBIAL ECOLOGY
Aquat Microb Ecol l Published May 2 1
Relationship between phytoplankton efficiency and
the proportion of bacterial production to primary
production in the Mediterranean Sea
P.
Conan',', C. ~ u r l e ~ ~ ,
E. stutt2,
M. Pujo-Pa?, F.
Van wambeke4
'Centre d'oceanologie de Marseille, OSU-LOB, UMR6535, Campus de Lurniny, Case 901, F-13288 Marseille Cedex 09, France 2Plyrnouth Marine Laboratory, Citadel Hill, Plymouth PL1 2PB, United Kingdom
3Laboratoire dwOceanographie Biologique, laboratoire Arago, BP 44, F-66651 Banyuls-sur-Mer Cedex, France 4Laboratoire de Microbiologie Marine. CNRS case 907, Campus de Luminy. F-13288 Marseille Cedex 09, France
ABSTRACT: Biomass and production of phytoplankton and heterotrophlc bacteria were measured dur- ing July 1995 along 3 onshore-offshore transects in the NW Mediterranean Sea (Gulf of Lions). The trophic status of the investigated stations varied from weakly oligotrophic to mesotrophic. Two distinct groups of stations were separated when examining the relationships between primary producers, bac- teria and nutrients. The 2 groups of stations exhibited a different relationship between the ratio of inte- grated bacterial production to integrated primary production (IBP/IPP) and IPP. However, there was no longer a Mference between the 2 groups when taking into account the phytoplankton efficiency (PE; i.e. IPP in mg C m-' h-' divided by integrated chlorophyll in mg m-2) instead of IPP. Indeed, the most striking feature was a highly significant power fit of IBP/IPP versus PE, for a larger set of data collected in the Mediterranean s e a despite large differences in location, season, physical structure, nutrient and biological status of the stations (IBP/IPP = 2 5 . 1 ~ ~ - ' ~ ' ) . For a large range of PE (i.e. higher than 1.0 rng C mg-' chl h-') the ratio remained below 25%, but increased dramatically for lower values of PE. This relationship may help to explain the considerable variation (2 to 190%) in bacterial production/primary production ratio previously found in the world's oceans.
KEY WORDS: Phytoplankton . Bacteria . Primary production . Bacterial production . Phytoplankton efficiency . Productivity
INTRODUCTION
The Mediterranean Sea is characterised by 2 differ- ent systems as described by Thingstad & Rassoulzade- gan (1995). The first occurs in winter, in frontal zone or upwelling areas a n d is characterised by a high new production, large organisms and high sedimentation rates due to the presence of large particles. In the sec- ond system, which occurs during summer and in off- shore waters, phosphate is a limiting factor for phyto- plankton and bacterial growth. It is characterised by small organisms and a storage of carbon, nitrogen and maybe phosphorus in dissolved organic forms, exported at the end of the stratification period (Copin-
Montegut & Avril 1993, Conan 1996, Conan e t al. 1998). The capacity of autotrophic organisms to fix inorganic carbon could be achieved by considering the phytoplankton efficiency (PE), defined as the ratio between primary production a n d chlorophyll concen- tration (Parsons et al. 1984). In saturating light condi- tions, this ratio is also named the 'assimilation number'. Although the chlorophyll concentration of a cell is extremely variable, this ratio could be approximated a s a n index of the physiological state of phytoplankton. The PE varies with species and/or environmental and trophic conditions (Le Bouteiller & Herbland 1984, Schiewer 1984, Videau et al. 1994). Indeed, values of PE in cultures of different algae lie in the range from 1 to 21 mg C mg-' chl h-' or even from 0.1 to 35.0 mg C mg-' chl h-' in natural populations of phytoplankton.
132 Aquat Microb Ecol17: 131-144, 1999
Maximum values of PE were measured in coastal waters of temperate and low latitudes whereas mini- mum values came from high latitudes and from olig- otrophic areas.
The role of the microbial food web (Azam et al. 1983) in the regulation of carbon transfer is important (Joiris et al. 1982, Keller & Riebesell 1989, Ducklow & Carlson 1992, Christaki & Van Wambeke 1995) and must be considered to better define mass budgets (Kirchman et al. 1992, Bronk et al. 1994, Pujo-Pay et al. 1997). In the euphotic zone, the proportion of primary production required to support bacterial production (BP/PP ratio) varies from 2 to 190% (Ducklow & Carlson 1992) and is around 40% in most environments (Cole et al. 1988). Such variations remain largely unexplained. In terms of budgets, bacteria are generally considered as a weak or even zero exportation vector of matter (Duck- low et al. 1986, Sherr et al. 1987).
Dissolved organic matter becomes available for bac- terial utilisation through phytoplankton exudation and lysis, grazing and release by zooplankton and also by physical disaggregation of detrital particles. The origin and the coupling between sources of phytoplankton- derived material and its consumption by bacteria play a main role in the variability of the BP/PP ratio. Dis- solved organic carbon (DOC; Larsson & Hagstrom 1982), nitrogen (DON; Jsrgensen et al. 1993, Pujo-Pay et al. 1997) and phosphorus (DOP; Jackson & Williams 1985) originating from phytoplankton are important controls in bacterial growth (Azam et al. 1993). Due to their high affinities for nutrients, their high surface area/biovolume ratios, their low N/P ratios (-9/1), bac- teria can sequester particulate nitrogen and phospho- rus. Bacteria may also compete with phytoplankton for key nutrients such as phosphate or nitrate (Kirchman et al. 1992). Jansson (1988) argues that an increase in DOC release by phosphate-limited phytoplankton is induced by the competition against bacteria for phos- phate. This kind of relationship could be particularly important in the Mediterranean (impoverished in phosphate), where grazing rates which may balance the system (Thingstad & Rassoulzadegan 1995) remain high throughout the year (Lefevre et al. 1997).
Here we explore a potential phytoplankton-bacterial relationship through the rate of primary production and bacterial production and through their ratio. This study takes place in the Gulf of Lions (NW Mediter- ranean Sea), where there is large scale variability in productivity from oligotrophy to mesotrophy (Conan et al. 1998). We compare these potential relationships with other Mediterranean data available from the liter- ature and from other sources (unpubl, data). We also discuss the ~nechanisms that could regulate the parti- tioning of fluxes of primary production between the microbial and the metazoan food web.
METHODS
Primary production, chlorophyll and nutrient con- centrations, bacterial biomass and production rates were measured and related to the physical structure of the water column at stations along 3 onshore-offshore transects in the NW Mediterranean (Fig. 1, Table 1) during a cruise from 30 June to 6 July 1995 on the RV 'Suroit'.
Sample collection. Physical parameters were mea- sured with a CTD probe (Seabird 911+) coupled to a electronically operated rosette of 8 l volume Niskin bottles for taking seawater samples. All the production casts were carried out before sunrise.
Nutrients. Subsamples of 10 m1 were taken in a polyethylene scintillation vial and immediately frozen at -20°C. On land, unfiltered samples were rapidly thawed and analysed for nitrate (NO3, standard error 0.1 PM), nitrite (NOz, standard error 0.02 pM) and phosphate (PO,, standard error 0.02 pM) according to classical methods on an automated Technicon analyser (Strickland & Parsons 1972, adapted by Treguer & Le Corre 1975).
Nitrate and phosphate vertical turbulent diffusion were calculated by the formula F = K,,dc/dz where dc/dz is the vertical nutrient gradient and K,, is the tur- bulent diffusion coefficient (Denman & Gargett 1983).
Fig. 1. Map of NW Mediterranean Sea showing the station positions along the 3 transects sampled during the Euromarge cruise. NMC is the North Mediterranean Current (general
Conan et al.: Relationship between bactenal and primary production
Table 1. Sampling dates, location and water depth of stations sampled during the Euromarge cruise
Station Sampling Position Depth
no. date (1995) (lat./long.) ( m )
B5 30 Jun 42" 24 0' N, 3' 44.0' E 1000 B2 1 Jul 42" 34.0' N. 3' 17.0' E 88 S5 2 Jul 40" 9.5' N, 3" 31.5' E 970 S2 3 Jul 40" 2.0' N. 3" 38.0' E 120 M3 5 Jul 43" 2.0' N. 5" 12.5' E 950 M1 6 Jul 43' 10.0' N, 5" 12.5' E 85
K, was calculated from 0 . 2 5 ~ (1/N2) where N Z = (g/pw) (dp/dz), E is the dissipation of the turbulent energy, Nis the stratification coefficient, g is the gravitational acceleration, p is the density, o is the earth angular rotating speed and dp/dz is the density gradient. We use a E of mZ s-3 (Dillon & Caldwell 1980), which results in a
K,
falling in the broad range between 1.5 and 3.9 X I O - ~ m-' S-' for our stations. This is in agree- ment with the calculated range for this area given by Minas & Codispoti (1993).Chlorophyll and primary production. Chlorophyll concentration was analysed according to the fluorimet- ric method (Holm-Hansen & Riemann 1978) using a Turner Designs 10.005R fluorimeter, after filtration of 250 m1 of subsample onto a Whatman GF/F 25 mm filter.
The assessment of primary production (PP) using I4C (Steemann-Nielsen 1951) was carried out from dawn to dusk (10 to 12 h) by using a new semi-automated in situ apparatus called Let-go (Dandonneau & Le Bouteiller 1992, Conan 1996). On deployment, this sys- tem takes 15 water samples (about 250 ml) at pre- defined depths and automatically injects 1 m1 of radio- labelled solution (NaH14C03 = 25 pCi). The incubation chambers are made of transparent or black poly- methacrylate for measurements of light and dark car- bon fixation, respectively. At the end of the incubation, the Let-go is hauled onboard and the samples are transferred into clean dark bottles, previously washed for 72 h with 0.5 M HC1 and carefully rinsed many times with deionised water. Total introduced radioac- tivity (dpml) was measured after incubation by placing 250 p1 of sample in a polyethylene scintillation vial with 250
1.11
of ethanolamine and 1 m1 of deionised water. Each sample was then immediately filtered onto a Whatman GF/F filter (25 mm diameter) under low pressure ( < 5 mm Hg), rinsed with 500 p1 of 0.5 M HC1 and dried at 40°C for 12 h. Dried filters were stored at ambient temperature. On land, samples were counted (dpmz) in a Beckman Scintillation Counter after the addition of 10 m1 of scintillation cocktail solution (Aquasol). The quantity of fixed carbon per hour (PP inmg C m-3 h-') was calculated using the formula PP = (dpm2/dpml) (Vp/V,) A 1.05(l/t), where Vp is the vol- ume of sample taken for determination of total radioac- tivity, V, is the volume of sample, A is the concentration of carbonates in seawater (about 25000 mg C m-3), 1.05 is the isotopic fractionation between I2C and I4C and t is the incubation time expressed in hours. Daily
production rates were estimated by PP X 12. The
phytoplankton efficiency (PE) is defined as the ratio between PP and chlorophyll concentration, PP/CHL, expressed in mg C mg-' chl h-' (Parsons et al. 1984, Falkowski & Woodhead 1992). In this paper, we also use a derived ratio, i.e. for integrated quantities (IPP/ICHL).
Bacterial abundance and biomass. Bacteria were enumerated by a direct count method using epifluores- cent microscopy and the DAPI fluorochrome (Porter & Feig 1980). After preserving the samples in 0.2 pm pore size filtered 2 % glutaraldehyde (final volume), they were sonicated on ice for 60 s on a 50% on-off cycle at 75 W on a Vibracell 20 kHz ultrasonicator, which ensured the dispersion of cells without disrup- tion. An appropriate volume (to ensure 20 to 30 cells per field) of sample was stained with 0.2 pm filtered DAPI solution (1 mg 1-' final concentration) for 10 min before filtering onto a black 0.2 pm pore size Nucle- pore filter. The filter was mounted on a slide with non- fluorescent immersion oil and a coverslip and was stored frozen until enumeration on land. The standard error for 3 replicates from 30 and 60 m depth was 10.3 and 10.2%, respectively. This whole procedure was carried out at sea to ensure that we did not underesti- mate cell numbers because of the dramatic loss of epi- fluorescent detectable bacteria that has been found during storage of the fixed seawater samples from the NE Atlantic (Turley & Hughes 1992, 1994, Vosjan & Van Noort 1998). Similar losses were observed in sea- water samples from the Mediterranean (C. Turley pers. obs.), confirming the need to carry out sample preser- vation, staining, filtering and mounting on slides pro- cedure at sea, shortly after sampling.
Bacterial biomass (BB) was calculated from the num- bers of bacteria and the relatively constant cell to car- bon values (with a mean around 20 fg C cell-') for nat- ural free-living bacterial assemblages (Lee & F.uhrman 1987).
Measurement of bacterial protein synthesis. Protein synthesis was determined by the incorporation of 3H- leucine into trichloroacetic acid (TCA) insoluble macro- molecular material (Kirchman 1993). The amounts of 3H-leucine incorporation into the cold TCA insoluble material are generally not significantly different to the hot TCA insoluble material (Chin-Leo & Kirchman 1988) in aquatic samples. We therefore used the ice- cold extraction method for greater convenience for use
134 Aquat Microb Ecol
at sea. Three 5 m1 replicates from each depth received 10 nM 3H-leucine (final concentration). One of the replicates had already received glutaraldehyde ( 2 % final concentration) and acted as the dead control. Samples were incubated in the dark at in situ temper- atures for a predetermined period (2 to 5 h) which lies in the linear period of incorporation. After this period the live incubations were terminated with glutaralde- hyde a n d all samples were filtered onto 0.2 pm pore size 25 mm diameter Nuclepore filters a n d extracted in the filter tower with 5 % ice-cold TCA for 5 min fol- lowed by five 1 ml rinses with 5 % ice-cold TCA. Filters were placed in scintillation vials; when dry, 5 m1 Beck- man Ready Safe scintillation cocktail was added and their radioactivity counted on a Beckman LS 1800 liquid scintillation counter. Counting efficiency was corrected for quenching by the external standard channels ratio method. The standard error calculated from the replicates ranged between 1.8 a n d 7.4 % with a mean standard error for this cruise of 4.1 %. O n a pre- vious cruise in the N W Mediterranean, w e found no difference in 3H-leucine incorporation rate between additions of 5 or 10 nM 3H-leucine (final concentra- tion). We therefore felt justified that the addition of 10 nM on this cruise more than ensured that kinetic saturation of leucine uptake was achieved (Turley et al. 1996).
Rates of bacterial production (BP) were calculated from leucine incorporation rates using a conversion factor of 0.15 X 10¹⁸ cells mol-' leucine (Bjmnsen & Kuparinen 1991) and 20 fg C cell-' (Lee & Fuhrman 1987). This is the same as the conversion factor of 3.1 kg C mol-' recommended by Kirchman (1993) which is based on the following best estimates: a n iso- tope dilution of 2, a ratio of cellular carbon to protein of 0.86 a n d the fraction of leucine in protein of 0.073. Daily BP was calculated as 24 X hourly BP.
Statistical analysis. All the integrated values are deduced according the classical trapezoidal method. Principal Component Analysis (PCA) was carried out on 26 independent variables, taken from the upper 80 m where much of the variation occurred, from each station in order to demonstrate relationships between stations a n d to assess covariance between variables which may explain any separation or grouping of sta- tions. The variables describe the hydrological a n d biotic conditions in this dynamic part of the water col- umn and were standardised to zero mean and unit variance. On the basis of the PCA analysis, the data from the upper 80 m was split into 2 groups of stations and analysis of variance (ANOVA) was used to test for significant differences between variables. Multiple lin- e a r regression analysis of the 2 data sets representing the 2 groups of stations was also carried out in order to s e e if they contained key variables which could
explain much of the total variability (Conan et a1 unpubl.).
RESULTS
The 3 transects (Fig. 1) are fully described in Conan
et al. (unpubl.). Here, we only illustrate each station (Fig. 2) by vertical profiles of salinity, phosphate (PO4), chlorophyll concentration (CHL), bacterial biomass (BB), primary production (PP) and bacterial production (BP). On each transect, 1 station is representative of a coastal situation (B2, S2, M1) whereas the other station is representative of a n offshore situation (B5, S5, M3). The Banyuls transect (Fig. 2a) is characterised by low surface salinity ( ~ 3 6 . 5 ) at Stn B5, which clearly indi- cates continental freshwater inputs. The weak surface increase (Fig. 2a) in CHL (0.8 mg m-3), BB (16.0 mg C m-3), phosphate (-0.1 p M ) and the high PP (-70 mg C m-3 d-') and BP (> 5.6 mg C m-3 d-l) are also indicative of the Rhone river influence (Lefevre et al. 1997). Con- trary to the other transects (Fig. 2b,c), the Banyuls one is characterised by detectable phosphate concentra- tions (-0.05 FM) over the whole water column (Fig. 2a).
Along the Balearic transect, a well-stratified water column is encountered. Indeed, a sharp increase in salinity (from <37.50 to >38.00) is observed between 20 a n d 50 m at both stations (Fig. 2b). This indicates a clear 2-layered system with a surface water layer orig- inating from the Atlantic via the Strait of Gibraltar up to a Mediterranean water layer. Such an injection of Atlantic water between the Balearic islands is common at this time (Millot 1987). Nutrients are depleted down to 50 m at these 2 stations. The CHL distributions showed a well-defined deep chlorophyll maximum (DCM) a t 60 m (1.2 mg m-3). The same relative pattern is observed for BB but with concentrations also high in surface water (10 to 16 mg C m-3) with a peak at 40 m for Stn S5 (Fig. 2b). PP was relatively low in surface water (6 and 10 mg C m-3 d-' at Stns S5 and S2 respec- tively) and then decreased gradually before a sec- ondary weak peak at 60 m, coinciding with the DCM (4 a n d 10 mg C m-3 d-' at Stns S5 and S2 respectively). BP was also highest in the upper mixed layer (1.6 to 2.4 mg C m-3 d-'), decreasing to 0.2 mg C m-"-' at 100 m.
The 2 Stns M1 and M3 offshore of Marseilles (Fig. 1) were ch.aracterised by salinity close to 38.00 (Fig. 2c), typical of Modified Atlantic Water (Millot 1987, Conan & Millot 1995). Stn M3 had low nutrient concentrations down to 100 m (<0.03 PM in phosphate) whereas the phosphacline appeared a t 60 m for Stn M1. CHL distri- butions were characterised by a large peak over the superficial water layer (with a maximum of about 0.8 mg m-3 at 80 m for Stn M3 and 50 m for Stn M l ) . BB
Conan et al.. Relationship between bacterial and primary production - Salinity 36.5 37.5 - CHL (mg.m3) 1 2 0.0 0.2
- - - -
P04 (PM)-
Salinity 36.5 37.5 0.0 2.5 5.0 - - - - BP ( m g ~ m" d.')- - - BB (rng m")
- Salinity - CHL (mg m-3) 0 1 2 - - - - P04 (PM)Fig. 2. Vertical profiles of salinity, phosphate (PO, in PM); chlorophyll (CHL in mg m-3), bacterial biomass (BB in mg m-3); primary production (PP in mg C m-3 d-') and bacterial production (BP in mg C m-3 d-l) for (a) Banyuls stations (B2 and B5), (b) Balearic stations (S2 and S5) and (c) Marseilles stations (M1 and M3) sampled during 30 June to 6 July 1995 on the Euromarge cruise
Aquat Microb Ecol l ? : 131-144, 1999
was quite homogeneous in the euphotic zone (10 to 16 mg C m-3). PP (4 to 8 mg C m-3 d-') a n d BP (0.3 to 1 . 4 m g C m-3 d-') were homogeneous and low at Stn M 3 , but showed a pronounced surface peak at Stn M1 ( 4 3 to 52 mg C m-3 d-l for PP and 2.5 to 4 . 0 mg C m-3 d-' for BP).
Statistical separation of stations
A wide range of environmental conditions were observed during the cruise as illustrated in Fig. 2. This is confirmed by the statistical analysis of the data set,
carried out in Conan et al. (unpubl.). The main author's conclusion is that the stations separate into 2 distinct groups (see text in Fig. 3a,b). The first 2 principal com- ponents of the PCA (principal component analysis) account for 72 % of the total variance. The first compo- nent, which accounts for virtually half the variance, separates Stns M1, B5 and B2 (Group 1) from Stns M3, S2 a n d S5 (Group 2).
The PCA confirms that stations from Group 1 (i.e. M1, B5, B2) had a shallow nitracline, higher salinity and high PP but not a corresponding proportional increase in variables related to bacteria (BP, BB) and richness (nutrients, CHL). In contrast, Stns S2, S5, and
Component 1 (49% of Total Variance)
BBm @
I
IPP
0.2
- & S Is00.6 -0.4 -0.2 -0.2
Component 1 (47% of Total Variance) -
0 0.2 0.4 0.6 0.8
Fig. 3 (extracted from Conan et al. unpubl.). Principal component analysis (PCA) of 26 independent variables measured in the upper 80 m of each station on the Euromarge cruise (a] to demonstrate relationships between stations and (b) to assess covari- ance between variables. Variables were standardised to zero mean and unit variance Variables used were: top of thermocline (T/Ct], bottom of thermochne [T/Cr), top of pycnocline (P/Ct), bottom of pycnocline (P/Cr), top of nitracline (N/Ct), delta clines (D/C), which is the difference between top of nitracline and top of phosphacline, maximum concentration of nitnte (N02m), depth of NO2 maximum (N02d), chlorophyll concentration at deep chlorophyll maximum (CHLm), depth of deep chlorophyll maximum (CHLd), maximum value of bacterial biomass (BBm), depth of BBm (BBd), maximum value of primary production (PPm), depth of PPmax (PPd), maximum value of bacterial productivity (BPm), depth of BPmax (BPd), integrated temperature (0 to 80 m) (IT), integrated salinity (IS), integrated nitrate (IN03), integrated phosphate (IP04), integrated nitrite (IN02), integrated chlorophyll (ICHL), integrated bacterial biomass (IBB), integrated total biomass (ITOTB), integrated primary production (IPP) and
Conan et al.: Relationship between bacterial and primary production
Table 2. Histogram showing the vertical turbulent diffusion fluxes of nitrate and phosphate in the surface layer. Actual values are shown on the left for phosphate and on the right for nitrate in pm01 m-2 d-'
to a lesser extent M3, had a deeper nitracline, lower salinity and a more proportional relationship between PP and variables related to BP and BB and most nutri- ent variables and CHL. The groups of stations are therefore distinguished by their different relationships between PP, heterotrophic production and nutrient concentrations in the upper mixed layer during the sample period.
Another way to illustrate the differences between the 2 groups used by Conan et al. (unpubl.) is to con- sider the nutrient vertical turbulent diffusion fluxes in the surface layer (Table 2). Group 1 ( M l , B5, B2) was characterised by higher fluxes (maximum rates lie from 20 to 60 pm01 m-2 d-' in phosphate and from 200 to 1000 pm01 m-' d-' in nitrate) and/or closer to the sur- face (between 50 and 80 m) compared to those of Group 2 (S5, S2, M3). For example, Stns M1 and B2 showed weak diffusion values at 30 m depth. The deepest maximum flux for Group 1 is calculated for Stn B5, also characterised by non-turbulent diffusion flux up to 50 m, but we have previously described sur- face RhBne inputs for this station. Finally, the upper layer (0 to 50 m) of stations in Group 1 received more inorganic nutrients (nitrate and phosphate) than the upper layer of stations in Group 2.
Diffusion flux D e p t h ( m ) P O , 3 o m PO, 4 0 m 50 m NO3 60 m 80 m
Relationship between primary production and bacterial production
On a volumetric basis for the euphotic layer, there are highly significant linear relationships (p 1 0.001) between log (BP) and log (PP) in both groups (Fig. 4a). Group 1 has a more extensive range of values for BP and PP than Group 2. However, the 2 relationships are not statistically different and could be combined in a general linear regression (see text in Fig. 4 for further details). This indicates that, despite the statistical sep-
Station
aration of the 2 groups by the PCA (i.e. key variables to explain the total variability of the 2 groups are differ- ent, Conan et al. unpubl.), there is the same kind of link between PP and BP in the 2 considered groups. This hypothesis is confirmed by the analysis of the BP/PP ratio, which is significantly related to PE by a power relationship (I1 order: BP/PP = 20.89 r2 = 0.33, p 5 0.001) with no longer a difference between the 2 groups (Fig. 4b). In fact, the power relationship means that there is a relatively constant BP/PP ratio (10 to 30%) for a wide range of PE (i.e. for PE > 0.5 mg C mg-' chl h-'). Below this PE value, the BP/PP ratio increases dramatically to reach locally more than 150%.
In terms of integrated quantity (i.e. on an area1 basis), the relationships between the IBP/IPP ratio and IPP are different in the 2 groups (Fig. 5). In Group 1 (Stns M1, B5 and B2), IBP/IPP and IPP were linearly related (I1 order: IBP/IPP = -0.05IPP
+
60.52, r2 = 0.99, p 5 0.001) while in Group 2 (Stns S2, M3 and S5) they were best fitted by a power relationship (I1 order: IBP/IPP = 8.5 X 1041PP-'-39, r2 = 0.89, p>
0.1). Both rela- tionships indicate that as IPP decreases, the proportion of IBP to IPP increases. However, the variation is con- stant in Group 1 regardless of the IPP value, whereas in Group 2, IBP remains between 10 and 2 0 % of IPP until IPP becomes low (200 to 300 mg C m-' d-l). Below this range, the proportion of IBP to IPP increases dra- matically (Fig. 5). Hence in the case of mid primary production rates, such as for Stns S2 and B2, a large difference in the IBP/IPP ratio can be seen in the 2 groups. In such a case, the IBP/IPP ratio is more than 30 % in Group 1 compared to about 10 % in Group 2. With respect to the lower and upper limits of the IPP range presented in Fig. 5, we could remark that the IBP/IPP ratios are finally close in the 2 groups (-50% for less than 300 mg C m-2 d-' and -10 % for more than 1100 mg C m-' d-'). M1 N 0 , P 0 4 . ... .. , . ,. ... . .. . . .. . .. . ... .. .. .. . 2 } 74 0 0 l19 7 0 5 0 2 6 4 -1 1010 B5 N 0 3 P 0 4 .. ... . ... . .. . ... . .. . .... ... .... . 2 1 88 155 27kPT7 M3 NO3 . . . , , , , . , , , . , , . . . 1 , 2 , 0 01
23 3B
363 B2 N 0 3 P 0 , .. . ... . .. . ... . . . ,,.. , ... ...., .. 2Q
56 09
265 1 9 a 4 ~ 3S5
N 0 3 P 0 4 . , . . , , . . ... , , , . , , . . . 2 1 110 2 0 l19 01
35 S2 N O , P O , . . . 1 ) 5 1 0 160MH
330138 Aquat Microb Ecol 17: 131-144, 1999
/
0 8 16-I
1
Log (PP) r n g ~ . m ~ 3 . d . 1 PE (mg~.mgchl~'.h")Fig. 4. (a) Plot of log bacterial production (BP) against log primary production (PP) from the upper 80 m for the 2 groups of sta- tions separated by PCA (Fig. 3a). The relationship between both these variables is significantly linear in both groups. (m) Data from stations in Group 1 ( M l , B5 and B2); (-) linear regression line (log BP = 0.561ogPP - 0.35, r2 = 0.72, p IO.OO1); ( 0 ) data from stations in Group 2 (S2, M3 and S5); ( - - - - ) regression Line (IogBP = 0.601ogPP - 0.44, r2 = 0.52, p 5 0.001). ANOVA test compar- ing the 2 lines indicates that there is no statistical difference (Fz, 30 = 2.6, p t 0.05) between the 2 regressions. The data from the 2 groups were therefore combined and fitted a linear regression (logBP = 0 57logPP - 0.39, r2 = 0.68, p
<
0.001). The reduced major axis regression (I1 order) is logBP = 0.64logPP - 0.40, r2 = 0.68, p 5 0.001. (b) Plot of the ratio of BP/PP against the phyto- plankton efficiency (PE). A highly significant power relationship (BP/PP = 2 3 . 3 4 ~ ~ - ' . ~ ~ , r2 = 0.33, p 5 0.001) was evident with no split between the 2 groups of stations. The reduced major axis regression (I1 order) was BP/PP = 2 0 . 8 9 P E - ~ . ~ ~ , r2 = 0.33, p 5 0.001DISCUSSION
Primary production and bacterial production Dissolved organic matter originating from phyto- plankton is a n important substrate for bacterial growth in most marine environments (Larsson & Hagstrom 1982, Azam e t al. 1993, Pujo-Pay e t al. 1997), especially in systems with reduced external influence as in open ocean case. However, the true proportion of matter originating from PP used to support BP is generally unknown and nearly impossible to measure directly. This is explained by the difficulty in separating the various sources used by heterotrophic bacteria for their growth and/or by the difficulty in quantifying accu- rately the phytoplankton release, which is known to vary from about 0 to more than 80% of PP depending on physiological and environmental conditions (Myk- lestad 1977, Wood & Van Valen 1990) and with algal or bacterial assemblages (Malinsky-Rushansky & Le- grand 1996). It is therefore common to consider the BP/PP ratio to characterise a potential flux between the bacterial a n d phytoplankton compartment (Ducklow & Carlson 1992). However, PP and BP are not necessarily coupled on the time-scale and/or space-scale of the observations (Azam et al. 1993, Kirchman et al. 1995).
During the Euromarge cruise, the encountered hydrological and meteorological conditions were sta- ble a n d typical for that area at that time (Millot 1987, Conan & Millot 1995, Conan 1996, Conan e t al. 1998).
In the 'Results' section, we have seen that the factors which controlled PP and BP could be the same in the 2 groups defined by the PCA (Fig. 4a,b) but they must have acted in a different way to explain a linear rela- tionship in Group 1 and a power relationship in Group
2 between the IBP/IPP ratio and IPP (Fig. 5). In order to
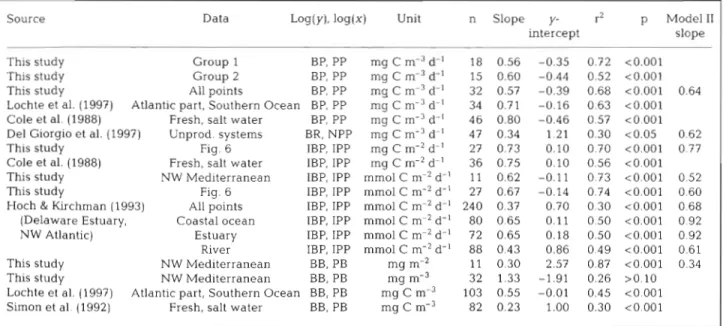
provide a better overview, we compared the observed relationships with those found in the literature (Table 3 ) . When considering the bacterial and phyto- plankton biomass, a broad range of values were found in the different studies (Table 3: Simon et al. 1992, Lochte et al. 1997, this study). On the contrary, when considering the production on a volumetric basis, we found a weak range of values for the slope and the y-
intersection of the linear regression, 0.6 to 0.8 and -0.2 to -0.5 respectively (Table 3: Cole et al. 1988, Del Gior- gio et al. 1997, Lochte et al. 1997, this study). More obvious on an area1 basis, the same relationship was found in this study and by Cole et al. (1988). A weak range was also defined for the oceanic sample in this study and by Hoch & Kirchman (1993) with respect to the slope of the linear regression (0.5 to 0.7). In fresh water, this last range could be slightly higher (>0.9, Table 3).
The PP, BP, CHL and BB distributions clearly indi- cate higher maximum values located closer to the sur- face in Group 1 than in Group 2 (Fig. 2 ) . These key variables revealed a trophic gradient between the 2 groups. In Group 2, stations were characterised by more pronounced oligotrophy than those of Group 1,
Conan et al.. Relationship between bacterial and pr.imary production 139
0 600 1200
IPP (mg~.m-2.d")
Fig. 5. Plot of the ratio of integrated BP/integrated PP (i.e. IBP/IPP) against IPP for the 2 groups of stations. (m) Data from Group 1 (Stns M1, B5 and B2), which best fit a linear regres- sion line (-) (IBP/IPP = -0.05IPP + 60.59, r2 = 0.99, p 10.001, or for the reduced major axis regression: IBP/IPP = -0.05IPP + 60.52, r2 = 0.99, p < 0.001). ( 0 ) Data from Group 2 (Stns S2, M3 and SS), which best fit a power regression (...) IBP/IPP = 5 X ~ O ~ I P P - ' . ~ * , r2 = 0.89, p 5 0.100 or IBP/IPP = 8.5 X 10⁴ I P P - ' . ~ ~ , r2 = 0.89, p 6 0.100 for the reduced major axis
regression
which could b e considered as mesotrophic stations. Indeed, there is some evidence that stations in Group 1 received more nutrient inputs than those in Group 2, via turbulent vertical diffusive processes (Table 2), from bottom and/or from coastal influence (Fig. 1). Stns M1 a n d B2 w e r e less than 90 m d e e p (Table 1) a n d Stn B5 received RhBne river inputs (Fig. 2). These addi-
tional nutrient inputs certainly explain t h e wide
observed range of PP (Fig. 4) a n d t h e higher variability
of t h e BP/PP ratio in Group 1. For Stns S2, S5 a n d M3,
t h e nutrients originate only from a relatively w e a k a n d
d e e p turbulent vertical diffusion (Table 2) a n d from regenerative processes. So, phytoplankton a n d bacte- ria need to compete for nutrients.
Only few data a r e available in the Mediterranean
Sea concerning simultaneous estimates of PP a n d BP.
Those w e have found have been included in Fig. 6a.
They fit into the 2 relationships already defined in
Fig. 5, with little c h a n g e in the regression formula a n d
statistics (Group 1: IBP/IPP = -0.04IPP
+ 57.50; Group
2: IBP/IPP = 882.5 IPP-0.67). In Fig. 6 a , t h e stations com-
ing from t h e Algerian basin could not b e integrated i n a n y regressions. However, the differences between the 2 groups of stations a n d e v e n t h e unexpected high ratios of the stations from t h e Algerian basin disappear o n considering t h e relationship b e t w e e n t h e IBP/IPP ratio a n d t h e phytoplankton efficiency (PE), also named 'assimilation number', in optimum light condi-
tions (Fig. 6b). T h e r e is a highly significant power rela-
tionship between these 2 physiological variables
(IBP/IPP = 25.1 r2 = 0.71, p 5 0.001).
Thus, despite large differences in location, season and/or physical, nutrient a n d biological status of the
stations, a close relationship could b e found between
IBP a n d the physiological state of t h e phytoplankton. This relationship indicates that w h e n phytoplankton
a r e efficient in carbon production (i.e. PE 2 1.5 m g C
mg-' chl h-'), about 16 to 25% of PP in t h e 0 to 80 m
water column is sufficient to support t h e BP either
Table 3. Linear regression statistics for various data sets. Variables are BP, PP (bacterial, primary production), IBP, IPP (integrated BP and PP), BB, PB (bacterial and phytoplankton biomass), BR (bacterial respiration), NPP (net PP)
Source Data Log(y), log(x) Unit n Slope y- r2 p Model I1
intercept slope
This study Group 1 BP, PP mg C m-3 d-' 18 0.56 -0.35 0.72 <0.001
This study Group 2 BP, PP mg C m-3 d-' 15 0.60 -0.44 0.52 <0.001
This study All points BP, PP mg C m-3 d-l 32 0.57 -0.39 0.68 <0.001 0.64 Lochte et al. (1997) Atlantic part. Southern Ocean BP, PP mg C m-3 d-' 34 0.71 -0.16 0.63 <0.001 Cole et al. (1988) Fresh, salt water BP, PP mg C m-3 d-' 46 0.80 -0.46 0.57 <0.001 Del Giorgio et al. (1997) Unprod. systems BR, NPP mg C m-3 d-' 47 0.34 1.21 0.30 <0.05 0.62 This study Fig. 6 IBP, IPP mg C m-2 d-' 27 0.73 0.10 0.70 <0.001 0.77 Cole et al. (1988) Fresh, salt water IBP, IPP mg C m-2 d-' 36 0.75 0.10 0.56 <0.001 This study NW Mediterranean IBP, IPP mm01 C n1r2 d-' 11 0.62 -0.11 0.73 <0.001 0.52 This study Fig. 6 IBP, IPP mm01 C n1r2 d-' 27 0.67 -0.14 0.74 <0.001 0.60 Hoch & Kirchman (1993) All points IBP, IPP mm01 C m-2 d-' 240 0.37 0.70 0.30 <0.001 0.68 (Delaware Estuary, Coastal ocean IBP, IPP mm01 C m-2 d.' 80 0.65 0.11 0.50 ~ 0 . 0 0 1 0.92 NW Atlantic) Estuary IBP, IPP mm01 C m-2 dLl 72 0.65 0.18 0.50 <0.001 0 92
River IBP, IPP mm01 C m-2 d-' 88 0.43 0.86 0.49 <0.001 0.61 This study NW Mediterranean BB, PB mg m-' 11 0.30 2.57 0.87 <0.001 0.34 This study NW Mediterranean BB, PB mg m-3 32 1.33 -1.91 0.26 >O.lO Lochte et al. (1997) Atlantic part, Southern Ocean BB, PB mg C me3 103 0.55 -0.01 0.45 < 0 001 Simon et al. (1992) Fresh, salt water BB, PB mg C m-3 82 0.23 1.00 0.30 < 0 001
Aquat Microb Ecol 17: 131-144, 1999 042 A A P27
-
-- 120--
120 0 7 , O 0 600 1200 0 2 4 IPP (mg~.rn-2.d-') PE (rngc.rngchrl.h-')Fig. 6. (a) Plot of the ratio of IBP/IPP against IPP for all stations on the Euromarge cruise (as in Fig. 5) plus data from the Marseilles transect (M3n: November 1993; M l p , M3p, M5p and M7p: November 1994, Bianchi 1996); plus data off Crete in the eastern Mediterranean Sea: D2 and D4 in March (m), February (f) and September (S) 1995 (Van Wambeke et al. 1996, Psarra et al. 1996); plus data in the Alboran Sea A 1 to A6 (Fernandez et al. 1994, Videau et al. 1994); plus data along the Algerian Current in the southwestern Mediterranean Sea: p14, p27, p42, p54, p70, p77 (Mediprod V1 report). The new data fell into either or bolh of the relationships defined in Fig. 5, with the exception of stations indcated by A. ( 0 ) Group 2 (n = 20: IBP/IPP = 336.7 IPP-O r2 = 0.57, p 5 0.001, or with a reduced major axis regression: IBP/IPP = 882.5 IPP-0.67, r2 = 0.57, p 5 0.001). ( 0 ) Group 1 (n = 10: IBP/IPP = -0.04 IPP
+
57.13, r2 = 0.97, p I 0.001, or, with a reduced major axis regression: IBP/IPP = -0.04IPP + 57.50, r2 = 0.97, p I 0.001). (b) Plot of IBP/IPP against the phytoplankton efficiency for the stations shown in Fig. 6a. The data no longer separate into 2 dis-tinct groups and now best fit a power regression (IBP/IPP = 2 5 . 0 ~ E - O . ~ ~ , r2 = 0.71, p < 0.001 or with a reduced major axis regres-
sion IBP/IPP = 25.1 r2 = 0.71, p I 0.001). A second axis on the right shows equivalent estimates of integrated bacterial car- bon demand (IBCD) expressed as percentage of IPP and is based on a carbon conversion efficiency of 40% (Bjerrnsen &
Kuparinen 1991)
directly through phytoplankton release or indirectly through a range of other routes such as 'sloppy' feed- ing and release by zooplankton (Jumars et al. 1989), dissolution of faecal pellets, egestion of digestive vac-
uoles and cell lysis including lysis by viruses (Baines &
Pace 1991). On the other hand, when phytoplankton
become less efficient (i.e. PE S 1.5 mg C mg-' chl h-'),
an increasing proportion of PP could be used by bacte- ria (Fig. 6b). To justify such a PP and BP coupling, the transfer of photosynthetic-derived material to bacteria must take place on a coherent time scale (i.e. hours to day).
Short time-scale coupling between primary production and bacterial production
The DOC pool can be divided into refractory, semi-
labile and highly labile pools (Billen & Servais 1989).
The highly labile pool (turnover from hours to days) represents a small percentage of the whole DOC pool (Kirchman et al. 1991). By assuming that only direct phytoplankton release and herbivory losses (due to heterotrophic nanoflagellate and ciliate grazing) con- stitute the main phytoplankton-derived labile DOC produced in the euphotic zone, we can estimate the contribution of these 2 sources in the BP/PP ratio (Table 4 ) .
Excluding all methodological and biological arte- facts, a mean of 10 to 14% of the total PP is directly
released (Baines & Pace 1991, Ducklow & Carlson
1992). Assuming that bacteria grow on this released
material with an efficiency of 40% (Bjsrnsen & Kupari-
nen 1991) or 5 0 % (Coveney & Wetzel 1989), bacterial
assimilation represents 4 to 7 % of PP (Table 4). Duck-
low & Carlson (1992) established that the DOM release
by zooplankton could represent a maximum value of
25 % of its ingestion. It is also recognised that PP could
contribute from 22 to 100% of the total ingestion of heterotrophic nanoflagellates and ciliates (Rassoul-
zadegan et al. 1988, Ducklow & Carlson 1992). More-
over, Christaki & Van Wambeke (1995) obtained a
growth bacterial efficiency of 34 % on such a hetero-
trophic release material in an experimental microcosm. With such a yield, herbivory loss processes could rep-
resent 2 to 904 of PP (Table 4). So, the contribution of
both direct DOC release by phytoplankton and her-
bivory losses to BP represents a range from 6 to 16 % of
PP. The percentages found at numerous stations (Fig. 6a) lie in this range, especially for those charac- terised by a PP higher than 400 mg C m-2 d-' or in Fig. 6b for those characterised by a PE higher than 1.5 mg C mg-' chl h-'. This 6 to 16% range is in agree-
ment with the estimation of 5 to 15 % of the total net PP
obtained experimentally by Fernandez et al. (1994) in, the Mediterranean Sea. This is therefore an indication
Conan et al.: Relationship between bacterial and primary production
of the rapid processes fuelling BP from PP, i.e. pro- (Fig. 6a) can account for all or more than the concur- cesses which could justify a phytoplankton-bacteria rent estimates of PP (Carlson et al. 1996). This may be coupling on a short time-scale (range from hours to due to temporal and/or spatial variation in the supply
day), of phytoplankton-derived material and bacterial
uptake of DOC and/or to the variability of bacterial growth efficiency according to the DOC origin and size (Middleboe & Sondergaard 1993, Carlson & Ducklow 1996).
Longer time-scale coupling between primary production and bacterial production
In most cases, the grazing rate is not tightly coupled with the intensity of PP. Then, the algal cells lysis con- tribute to the pool of small suspending particulate organic matter (POM) and colloids (Ducklow et al. 1995). Bacteria are known to be one of the major con- tributors to the decomposition of POM to DOM through extracellular enzyme production (Billen 1990, Hoppe 1991). Hydrolysis of senescent phytoplankton cells also contributes to the labile DOC pool as does the slower hydrolysis of the significant fraction of semi- labile DOC (Carlson et al. 1996).
Low bacterial growth efficiencies (5 to 30%) have been obtained in oligotrophic environments (Carlson &
Ducklow 1996) or even in most of the fresh- and marine water systems (10 to 25%) (Del Giorgio et al. 1997) including the Mediterranean Sea (Sempere et al. 1995). In such a case, bacterial carbon demand
Table 4 . Estimation of the potential contribution of both her- bivory losses (right panel) and direct DOC release by phyto- plankton (left panel) to bacterial production (see text for
further details)
4 0 % or 50%
I
25 %bacterial efficiency maximum release
1
Variability of phytoplankton efficiency
4 to 798
Most of the stations characterised by a PE higher than 1.0 or 1.5 mg C mg-' chl h-' (Fig. 6b) lie around the theoretical percentage found above for short-term linkage through release and grazing. Those stations with higher percentages (IBP/IPP up to 60%) have a low PE. The PE is known to vary between 0.1 and 35.0 mg C mg-I chl h-' (cf. 'Introduction') but it gener- ally lies in the range from 0.5 to 15.0 mg C mg-' chl h-'. Its variations are related to light and nutrient condi- tions (Schiewer 1984), to phytoplankton cell size (i.e. lower PE in smaller cells), and to water column stabil- ity and are therefore low in oligotrophic waters (Videau et al. 1994). The PE generally decreases with depth and from the beginning to the end of a spring bloom (Baamstedt 1985), and also during the summer (Le Bouteiller & Herbland 1984). In the NW Mediter- ranean Sea, the PE lies from 0.1 to 7.0 mg C mg-' chl h-', with maximum values in April to June and mini- mum values at the end of the summer (Conan 1996).
The PE is known to characterise the potential of the chlorophyll pool to fix inorganic carbon. It roughly characterises the physiological state of the phytoplank- ton compartment. Finally, the PE could be considered as a good index of the trophic state of the system according to Falkowski & Woodhead (1992). In this way in Fig. 6b, it is obvious that the distribution of the stations along the line of the power relationship char- acterises a relative richness, that is to say, an increas- ing oligotrophy from the right towards the left of the figure. Since the relationship between the IBP/IPP ratio and PE combines data throughout the year, from coastal and offshore stations and from greatly different geographical areas (NW and E Mediterranean), it can be viewed as an evolution of the relationship with time or with space. For example, Stn M3 (see Fig. 6b) exhib- ited the full range of the relationship between the IBP/IPP ratio and PE when sampled on 3 different occasions. Such variations indicate an evolution from mesotrophy to oligotrophy and vice versa, i.e. from autotrophic to heterotrophic system. This is in agree- ment with the results of the time series study carried out at this station (Conan 1996, Conan et al. 1998). There was also a decrease in the PE on an offshore 2 t 0 9 %
\
'
/
A
1
Z
142 Aquat Microb Ecol 17: 131-144. 1999
(M7p and M5p)
-
inshore (M3p and M l p ) transect dur- ing November, which reversed during July ( M 1 and M3).Biogeochemical significance of the power relationship
A high proportion of PP could b e released a s Doh1 under oligotrophic or stress conditions a n d could then support a variable fraction of BP, which means a close coupling between phytoplankton release a n d bacterial uptake. In contrast, the contribution of PP to BP is reduced when there are allochthonous inputs of sub- strate or when phytoplankton growth is efficient (i.e. a weak proportion of PP is release as DOM). The biogeo- chemical consequence of a high BP/PP ratio is that there may be less material available for higher trophic levels of the marine foodweb and/or for export to the deeper ocean a n d benthos.
Conclusion
Despite the large variations in hydrodynamic, nutri- ent trophic status and biodiversity, on various time and space scales, there is a persistent significant relation- ship between the IBP/IPP ratio and PE. At higher PE, 10 to 25% of IPP is sufficient to support IBP in the euphotic zone. This percentage results essentially from direct phytoplankton release and grazing by zooplank- ton. These 2 processes are then sufficient to support bacterial growth if the efficiencies of 34 to 50% are valid with those DOM. However, at lower PE, the per- centage of IPP needed to support IBP can increase up
to 60%. In those cases (and/or for lower bacterial effi-
ciencies), other processes such a s cell lysis, POM hydrolysis, external inputs of substrate by turbulent vertical diffusion and/or by advection presumably become increasingly important compared to direct phytoplankton release and grazi.ng alone. This link between BP and the physiologi.cal state of the phyto- plankton may explain the extremely wide range of IBP/IPP ratios previously found in other studies (see review of Ducklow & Carlson 1992).
Acknowledgements. Our thanks to the offlcers and crew of the RV 'Suroit' and to X. Durrieu de Madron, who was lead scientist for this Euromarge cruise and supplied the CTD data reported here. This research was undertaken in the frame- work of the Mediterranean Targeted Project (MTP) - Euro- pean Microbiology of Partialate Systems (EMPS) and EUROMARGE-NB projects, supported by the European Com- mission's Marine Science and Technology (MAST) Pro- gramme under contracts MAS2-CT94-0090 and MAS2-93- 0053. Thanks to C Videau, S. Psarra, M . Minas for providing some additional data used to demonstrate the relationship in
Fig. 6. Thanks also to P. Raimbault for assistance with the nutrient analysis, J. Harris for statistical advise, G. Ruddy for inspired discussion and M. Bianchi, whose coordination of the EMPS project facilitated this work. Finally we thank the reviewers for their comments which helped improve this manuscri.pt.
LITERATURE CITED
Azam F, Fenchel T. Field JG, Gray JS, Meyer-Reil LA, Thingstad F (1983) The ecological role of water-column microbes in the sea. Mar Ecol Prog Ser 10:257-263 Azam F, Smith DC, Steward GF, Hagstrom A (1993) Bacteria-
organic matter coupling and its significance for oceanic carbon cycling. Microb Ecol28:167-179
Baamstedt U (1985) Spring-bloom dynamics in Kosterfjorden, western Sweden: variat~on in phytoplankton production and macrozooplankton characteristics. Sarsia 70(1):69-82 Baines SB, Pace ML (1991) The production of dissolved organic matter by phytoplankton and its importance to bacteria: patterns across marine and freshwater systems Limnol Oceanogr 36:1078-1090
Bianchi M (1996) European microbiology of parti.culate sys- tems. Final report, Vol I, Marseilles
Billen G (1990) Delayed development of bacterioplankton with respect to phytoplankton: a clue for understanding their trophic relationships. Arch Hydrobiol Beih Ergeb Limnol34:191-201
Billen G, Servais P (1989) Modelisation des processus de degradation bacterienne de la matiere organique en milieu aquatique. In: Bianchi M, Marty D, Bertrand JC, Caumette P, Gauthier M (eds) Micro-organismes dans les ecosystemes oceaniques. Masson, Paris, p 219-245 Bjornsen PK, Kuparinen J (1991) Determination of bacterio-
plankton biomass, net product~on and growth efficiency in the Southern Ocean. Mar Ecol Prog Ser 71:185-194 Bronk DA, Glibert PM, Ward BB (1994) Nitrogen, uptake, dis-
solved, organlc nitrogen release, and new production. Sci- ence 265:1843-1846
Carlson CA, Ducklow HW (1996) Growth of bacterioplankton and consumption of dissolved organic carbon in the Sar- gasso Sea. Aquat ~Microb Ecol 10:69-85
Carlson CA, Ducklow HW, Sleeter TD (1996) Stocks and dynamics of bacterioplankton in the northwestern Sar- gasso Sea. Deep-Sea Res I1 43:491-515
Chin-Leo G. Kirchman DL (1988) Estimating bacterial pro- duction in marine waters from the simultaneous incorpo- ration of thymidine and leucine. Appl Environ Microb 54: 1934 - 1939
Christaki L', Van Wambeke F (1995) SimuIated phytoplankton bloom input in top-down manipulated microcosms: com- parative effect of zooflagellates, ciliates and copepods. Aquat Microb Ecol 9:133-147
Cole JJ, Findlay S, Pacc hlL (1988) Bacterial procluclion in fresh and saltwater ecosystems: a cross-system overview. hlar Ecol Prog Ser 43:l-10
Conan P (1996) Variabilite et bilan de la production primaire e n zone c6tiere (Mediterranee Nord occidentale; entree du golfe du Lion) e n relation avec les systemcs biologique, chimique et hydrodynamique (Courant Nord Mediter- raneen). PhD thesis. Universite d'Aix-Marseille I1 Conan P, Millot C (1995) Variability of the Northern Current
in the Western hlediterranean Sea from February to June 1992. Ocean01 Acta 18:193-205
Conan P, Pujo-Pay M , Ra~mbault P. Leveau M (1998) Variabil- ite spatio-temporelle des systemes physique, chimique et
Conan et al.: Relationship between bacterial and primary production 143
biologique en Mediterranee Nord occidentale (golfe du Lion) entre 1992 et 1994. I. Flux de matiere (N. P, chloro- phylle) a travers une radiale Nord-Sud. 11. Cycle et bilan
de la productivite (14C) a la station centrale. Oceanol Acta 21(6):751-782
Copin-hilontegut G, Avril B (1993) Vertical distribution and temporal variation of dissolved organic carbon in the North-Western Mediterranean Sea. Deep-Sea Res 40: 1963-1972
Coveney MF, Wetzel RG (1989) Bacterial metabolism of algal
extracellular carbon. Hydrobiologia 173:141-149
Dandonneau Y, Le Bouteiller A (1992) A simple and rapid device for measuring planktonic primary production by in
situ sampling, and C14 injection and incubation. Deep-
Sea Res 39:795-803
Del Giorgio PA, Cole JJ, Cimbleris A (1997) Respiration rates
in bacteria exceed phytoplankton production in unpro-
ductive aquatic systems. Nature 385:148-151
Denman KL, Gargett AE (1983) Times and space scales of ver-
tical mixing and advection of phytoplankton in the upper
ocean. Limnol Oceanogr 28:801-815
Dillon TM, Caldwell DR (1980) The batchaloo spectrum and dissipation in the upper ocean spectrum. J Geophys Res 87:9601-9613
Ducklow HW, Carlson CA (1992) Oceanic bacterial produc-
tion. Adv Microb Ecol 12:113-181
Ducklow HW, P u r d ~ e DA, Willlams PJLeB, Davies JM (1986)
Bacterioplankton: a sink for a carbon in a coastal marine plankton community. Science 232:865-867
Ducklow HW, Quinby HL, Carlson CA (1995) Bacterioplank- ton dynamics in the equatorial Pacific during the 1992 El
Nifio. Deep-Sea Res I1 42:621-638
Falkowski PG, Woodhead AD (1992) Primary productivity
and biogeochemical cycles in the sea, Vol 43. Environ-
mental Science Research, New York
Fernandez M, Bianchi M, Van Wambeke F (1994) Bacterial
biomass, heterotrophic production and utilization of dis-
solved organic matter photosynthetically-produced in the
Almeria-Oran front. J Mar Sys 5.313-325
Hoch MP, ffirchman DL (1993) Seasonal and inter-annual
variability in bacterial production and biomass in a tem-
perate estuary. Mar Ecol Prog Ser 98:283-295
Holm-Hansen 0, Riemann B (1978) Chlorophyll a determina-
tion: improvements in methodology. Oikos 30:438-447 Hoppe HG (1991) Microbial extracellular enzyme activity: a
new key parameter in aquatic ecology. In: Chrost RJ (ed)
Microbial enzymes in aquatic environments. Springer-
Verlag, New York, p 60-83
Jackson GA, Williams PM (1985) Importance of dissolved
organic nitrogen and phosphorus to biological nutrient
cycling. Deep-Sea Res 32:223-235
Jansson M (1988) Phosphate uptake and utilization by bacte-
ria and algae. Hydrobiologia 170:177-185
Joins C, Billen G, Lancelot C, Daro MH, Mommaerts JP, Ber-
tels A, Bossicart M, Nijs J, Hecq J H (1982) A budget of car-
bon cycling in the Belgian coastal zone: relative roles of zooplankton, bacterioplankton and benthos in the utiliza-
tion of primary production. Neth J Sea Kes 16:260-275 Jergensen NOG, Kroer N, Coffin RB, Yang XH, Lee C (1993)
Dissolved free amino acids, combined amino acids, and
DNA as sources of carbon and nitrogen to marine bacteria.
Mar Ecol Prog Ser 98:135-148
Jumars PA, Penry DL, Baross JA, Perry MJ, Frost BW (1989)
Closing the microbial loop: dissolved organic carbon path-
way to heterotrophic bactena from incomplete ~ngestion,
digestion and absorption in animals. Deep-Sea Res 36:
483-495
Keller AA, Riebesell U (1989) Phytoplankton carbon dynamics
during a winter-spring diatom bloom in an enclosed marine ecosystem: primary production, biomass and loss
rates. Mar Biol 103:131-142
Kirchman D (1993) Leucine incorporation as a measure of bio-
mass production by heterotrophic bacteria In Kemp PF,
Sherr BF, Sherr EB, Cole JJ (eds) Handbook of methods in
aquatic microbial ecology. Lewis Publishers, Boca Raton,
p 509-512
Kirchman DL, Suzuki Y, Garside C, Ducklow HD (1991) High
turnover rates of dissolved organic carbon during a spring
phytoplankton bloom. Nature 352:612-614
Kirchman DL, Moss J , Keil RG (1992) Nitrate uptake by heterotrophic bacteria. Does it change the f-ratio? Arch
Hydrobiol Beih Ergeb Limnol 37:129-138
Kirchman DL, Rich JH, Barber RT (1995) Biornass and bio-
mass production of heterotrophic bacteria along 140°W in
the Equatorial Pacific: effect of temperature on the micro-
bial loop. Deep-Sea Res I1 42:603-619
Larsson U, Hagstrom
A
(1982) Fractionated phytoplanktonprimary production, exudate release and bacterial pro-
duction in a Baltic eutrophication gradient. Mar Biol 67:
57-70
Le Bouteiller A, Herbland A (1984) Carbon fixation and pro- ductivity index in relation to chlorophyll and light in the equatorial Atlantic Ocean. Oceanogr Trop 19.161-179
Lee S, Fuhrman JA (1987) Relationships between biovolume
and biomass of naturally derived marine bacterioplank-
ton. Appl Environ Microbiol53:1298-1303
Lefevre D, Minas HJ, Minas M, Robinson C, Williams PJLeB,
Woodwdrd EMS (1997) Review of gross community pro-
duction, primary production, net community production
and dark respiration in the gulf of Lions. Deep-Sea Res 44: 801-832
Lochte K, Bjsrnsen PK, Giesenhagen H, Weber A (1997) Bac-
terial standing stock and production and their relation to
phytoplankton in the Southern Ocean. Deep-Sea Res 44:
321-340
Malinsky-Rushansky NZ, Legrand C (1996) Excretion of dis- solved organic carbon by phytoplankton of different sizes
and subsequent bacterial uptake. Mar Ecol Prog Ser 132:
249-255
Mediprod V1 Report (1991) Production pelagique de la Medi-
terranee Sud-occidentale (courant algerien). Mesures
hydrologiques, chirniques et biologiques (Campagne Mediprod V1, juin 1990). Campagnes Oceanographiques Fran~aises (COF-IFREMER). Vol 16, Brest
Middelboe M, Sondergaard M (1993) Bacterioplankton growth yield: seasonal variations and coupling to sub- strate lability and P-glucosidase activity. Appl Environ Microb 59:3916-3921
Millot C (1987) Circulation in the western Mediterranean Sea. Oceanol Acta 10:143-149
Minas HJ, Codispoti LA (1993) Estimation of primary produc- tion by observation of changes in the mesoscale nitrate field. ICES Mar Sci Symp 19?:215-235
Myklestad S (1977) Production of carbohydrates by marine planktonic diatoms. 11. Influence of the N/P ratio in the growth medium on the assimilation ratio, growth rate, and production of cellular and extracellular carbohydrates by Chaetoceros affinis var. willei (Gran) Hustedt and Skele- tonema costatum (Grev) Cleve. J Exp Mar Biol Ecol 29: 161-179
Parsons TR, Takahashl M, Hargave B (1984) Biological oceanic processes, 3rd edn. Pergarnon Press, Oxford Porter KG, Feig YS (1980) The use of DAPl for identifying and
144 Aquat Microb Ecol
Psarra S, Tselepides A, Ignatiades L, Dafnomili E (1996) Pri- mary production estimates in the Cretan Sea. In: Tselepi- des A, Papadopoulou KN, Polychronaki T (eds) Flnal report CINCS: pelagic-benthic coupllng in the olig- otrophic Cretan Sea. IMBC, p 46-53
Pujo-Pay M, Conan P, Raimbault P (1997) Excretion of dis- solved organic nitrogen by phytoplankton assessed by wet oxidation and N-l5 tracer procedures. Mar Ecol Prog Ser 153:99-111
Rassoulzadegan F, Laval-Peuto M, Sheldon RW (1988) Parti- tioning the food ration of marine ciliates between pico- and nanoplankton. Hydrobiologia 159:75-88
Schiewer U (1984) In vitro primary productivity (phytoplank- ton efficiency) of phytoplankton from the Darss-Zingst estuary. Limnol Oceanogr 15575-579
Sempere R, Van Wambeke F, Arzoumanian H, Chambaud AL, Talbot V, Mazaudier D (1995) Biodegradability of dis- solved and colloidal organic matter in Mediterranean waters. In: Bricaud A (ed) Structure and dynamics of oligo- troph.ic ecosystems: evolution of concepts. JGOFS-France, Villefranche-sur-Mer, p 36-37
Sherr EB, Sherr BF, Albright LJ (1987) Bacteria: link or sink? Science 235188-89
Simon M. Cho BC. Azam F 11992) Siqnificance of bacterial . , -biomass in lakes and ocean: comparison to phytoplankton biomass and bioqeochemical implications. Mar Ecol Prog
-
Ser 86:103-110Steemann-Nielsen E (1951) Measurement of the production of the organic matter in the sea by mean of carbon 14. Nature 167:684-685
StricMand JDH, Parsons TR (1972) A practical handbook of seawater analysis, 2nd edn. Bull Fish Res Board Can 167 Thingstad TF, Rassoulzadegan F (1995) Nutrient limitations, microbial food webs, and 'biological C-pumps': suggested Editorial responsibility: William Li,
Dartmouth, Nova Scotia, Canada
interactions in a P-limited Mediterranean. Mar Ecol Prog Ser 11?:299-306
Treguer P, Le Corre P (1975) Manuel d'analyses des sels nutn- tifs dans I'eau de mer. Laboratoire d1Oceanographie Chirmque Universite de Bretagne Occidentale, Brest, p 110
Turley CM, Hughes DJ (1992) Effect of storage on direct esti- mates of bacterial numbers. Deep-Sea Res 39:375-394 Turley CM, Hughes DJ (1994) The effect of storage tempera-
ture on the enumeration of epifluorescence-detectable bacterial cells in preserved seawater samples. J Mar Biol Assoc UK ?4:259-262
Turley CM, Stutt ED, Harris JRW, Ruddy G (1996) Final EMPS report from participant no 5: Plymouth Marine Laboratory. In: Bianchi M (ed) European Microbiology of Particulate Systems (EMPS) final report to the MAST 11-Mediter- ranean Targeted Project, Vol 11, Section 5, Marseilles Van Wambeke F, Christaki U, Bianchi M (1996) Bacterial pro-
duction estimates in the Cretan Sea. In: Tselepides A, Papadopoulou KN, Polychronaki T (eds) CINCS: pelaglc- benthic coupling in the oligotrophic Cretan Sea MTP Final Report, IMBC, Marseilles, p 59-67
Videau C, Sournia A, Prieur L, Fida M (1994) Phytoplankton and primary production characteristics at selected sites in the geostrophic Almeria-Oran front system (SW Mediter- ranean Sea). J Mar Syst 5:235-250
Vosjan JH, Van Noort GJ (1998) Enumerating nucleoid-visi- ble marine bacterioplankton: bacterial abundance deter- mined after storage in formalin fixed samples agrees with isopropanol rinsing method. Aquat Microb Ecol 14: 149-154
Wood AM, Van Valen LM (1990) Paradox lost? On the release of energy-rich compounds by phytoplankton. Mar Microb Food Webs 4(1):103-116
Submitted: February 14, 1998; Accepted: September 14, 1998 Proofs received from author(s): April 21, 1999


![Fig. 3 (extracted from Conan et al. unpubl.). Principal component analysis (PCA) of 26 independent variables measured in the upper 80 m of each station on the Euromarge cruise (a] to demonstrate relationships between stations and (b) to assess](https://thumb-eu.123doks.com/thumbv2/123doknet/14792965.602261/7.889.182.726.382.907/extracted-principal-component-independent-variables-euromarge-demonstrate-relationships.webp)