HAL Id: hal-00298057
https://hal.archives-ouvertes.fr/hal-00298057
Submitted on 21 Nov 2006
HAL is a multi-disciplinary open access
archive for the deposit and dissemination of
sci-entific research documents, whether they are
pub-lished or not. The documents may come from
teaching and research institutions in France or
abroad, or from public or private research centers.
L’archive ouverte pluridisciplinaire HAL, est
destinée au dépôt et à la diffusion de documents
scientifiques de niveau recherche, publiés ou non,
émanant des établissements d’enseignement et de
recherche français ou étrangers, des laboratoires
publics ou privés.
past
J. A. Dearing
To cite this version:
J. A. Dearing. Climate-human-environment interactions: resolving our past. Climate of the Past,
European Geosciences Union (EGU), 2006, 2 (2), pp.187-203. �hal-00298057�
www.clim-past.net/2/187/2006/
© Author(s) 2006. This work is licensed under a Creative Commons License.
of the Past
Climate-human-environment interactions: resolving our past
J. A. Dearing
Department of Geography, University of Liverpool, UK
Received: 19 June 2006 – Published in Clim. Past Discuss.: 23 August 2006
Revised: 1 November 2006 – Accepted: 3 November 2006 – Published: 21 November 2006
Abstract. The paper reviews how we can learn from the past
about climate-human-environment interactions at the present time, and in the future. It focuses on data sources for envi-ronmental change at local/regional and regional/global spa-tial scales, and shows the scope and limitations of each. It re-views alternative methods for learning from the past, includ-ing the increasinclud-ing use of simulation models. The use of mul-tiple records (observational, palaeoenvironmental, archaeo-logical, documentary) in local case-studies is exemplified in a study from China, where independent records help unravel the complexity of interactions and provide a basis for as-sessing the resilience and sustainability of the landscape sys-tem. Holocene global records for Natural Forcings (e.g. cli-mate and tectonics), Human Society and Ecosystems are re-viewed, and the problems of reconstructing global records of processes that are only recorded at local scales examined. Existing regional/global records are used to speculate about the veracity of anthropogenic forcing of global climate, with specific consideration of the Ruddiman theory. The paper concludes that a full understanding of causes of earth sys-tem change through (at least) the Holocene can come only through the most rigorous reconstructions of climate, human activities and earth processes, and importantly their interac-tions, at all locations and at all scales. It follows that we need to promote inter-scale learning: regionalisation and general-isation of existing data would be useful first steps. There is now a need to develop long-term simulation models that can help anticipate complex ecosystem behaviour and environ-mental processes in the face of global environenviron-mental change – and resolving our past is an essential element in that en-deavour.
Correspondence to: J. A. Dearing
1 Introduction
It is tempting to draw our perspectives of climate-human-environment interactions from either the destructive impact of humans on their local environment or the impact of ‘natu-ral’ forces on societies: resource exploitation on the one hand versus climate determinism on the other. Both types of im-pact are still often exemplified, but new scientific ideas and evidence increasingly make this dichotomy less useful. For example, complexity theory, with related concepts such as nonlinear change, feedback and regime shifts (e.g. Scheffer and Carpenter, 2003; Schneider, 2004) suggests that human activities and environmental change should be viewed to-gether as a co-evolutionary and adaptive process (cf. Holling, 2001; Lenton et al., 2004). Positive feedback loops may lead to a conditioning of landscapes that makes them more sensi-tive to new perturbations. Hence, some historical societies, like those on Easter Island, became more prone to collapse through continuing resource depletion and ecological degra-dation (e.g. Diamond, 2005). Others, such as the Akkadian society of Mesopotamia, became increasingly vulnerable to climate perturbations as their dependence on irrigated cul-tivation increased (Weiss, 2001). Further ideas stem from new palaeoecological and archaeological information about the beginnings and extent of human activities in the past. In some instances, these may change previous conceptions of undisturbed ecosystems and the beginnings of agriculture. Recent data syntheses show that measurable human impact on equatorial forest may date to at least 3500 cal yr BP in the Amazon Basin and the Congo, and to 7000–8000 cal yr BP in SE Asia (Willis et al., 2004), the earliest maize cultiva-tion in the Andes has recently been extended by more than one millennium to 4000 cal yr BP (Perry et al., 2006), and the earliest Asian rice cultivation is now dated to 10 000– 14 000 cal yr BP in the middle Yangtze region and possibly to 9000 cal yr BP in India (Yasuda, 2002).
Fig. 1. A schematic illustration of the potential interconnections
between Natural Forcings, Human Society and Ecosystems for ter-restrial systems. Bi-directional arrows represent potential flows of energy, matter and information between the three state systems that may define externally-driven causality and feedback. Circular ar-rows within each box represent internal dynamical processes (Dear-ing, 2006a).
In other studies, piecing together data from different lo-calities has permitted new theories about the early human role in effecting change across regional/global spatial scales. For example, Miller et al. (2005) argue that human use of fire in Australia was the most likely driver of major vegeta-tion change and megafaunal extincvegeta-tion, 50 000–45 000 years ago. This conclusion is not just central to a complete un-derstanding of anthropological and environmental change in Australia; it also gives credence to the view that early hu-man impacts were able to transform key environmental pro-cesses over extra-local scales. In this case, it was not only the flora and fauna that were affected but also, by implica-tion, soil properties, microclimates, regional hydrology and land-atmospheric carbon fluxes. The potential spatial scale of climate-human-environment interactions is extended even further by Ruddiman’s analysis (2003) of interglacial ice core records of CO2 and CH4. He claims that Holocene rises in these gases signify the earliest cumulative effect of local im-pacts (cf. Turner et al., 1990), which were sufficient to pro-duce systemic, or global, effects on the atmospheric system – ultimately feeding back to global society in modern times. Alongside new lines of empirical palaeoenvironmental ev-idence have come changes in our conceptualisation of the hu-man role. At the first PAGES OSM, held in London in 1998, B. Messerli and co-authors introduced the idea of environ-mental change moving from a state of nature-domination to one of “human-domination” (Messerli et al., 2000); a change characterised by a shift from locally adapted and integrated processes dominated by negative feedback loops to cumu-lative impact driven by positive feedback. The timing and nature of the switch differs from location to location, but their key point was that understanding climate-human-environment relationships within “human-dominated”
sys-tems requires local scale studies. In contrast, P. Crutzen’s (2002) idea for the “human-dominated” Anthropocene era applies to a date, around 300 years ago, when human activity at a global level first measurably affected the global climate, as defined by rising concentrations of greenhouse gases in ice cores. Both are valid, compelling and useful definitions, yet utilise the notion of human-domination of earth processes at quite contrasting spatial scales.
These new senses of climate-human-environment in-teraction both clarify and mystify our levels of under-standing. Through a growing number of case studies (Dearing et al., 2006a) we gain new insight about the vari-ability of the nature of interactions, but realise that gener-alisation may be difficult. The sharpness of our focus may be strongly determined by the spatio-temporal scale under observation. There may be problems of scale mismatch be-tween social or ecological processes within the same system (e.g. Cumming et al., 2006). Methods and concepts that assume simple causation may be invalid, yet we have few guidelines as to how to deal with the challenges presented by complex socio-ecological systems (e.g. Dearing, 2006a, b). At least to some extent, the functioning of modern land-scapes and the trajectory of the future may be directly con-tingent on the past (Foster et al., 2003) – but how far back in time? Reviews of environmental changes over the last 250 years (e.g. Steffen et al., 2004) offer powerful images of recent rates of change, but may not capture the trajectories of “slow” adaptive cycles that are key to understanding re-silience (Holling and Gunderson, 2002).
Viewing our present earth system and its societies as a point on a long-term trajectory may be an appropriate per-spective but there is no agreed protocol about how we should learn from the past about its future direction (Dearing et al., 2006b). As a result, there is currently no conceptual, method-ological or empirical framework for capturing the full set of climate-human-environment relationships that extends from local to global scales. Until one emerges, we surely risk pro-ducing conflicting and apparently irreconcilable conclusions about the causes and consequences of environmental change. This paper tries to shed some light on how we might tackle these issues. As a basic construct to aid discussion, the main components of interest for terrestrial systems are mapped on to a simple diagram (Fig. 1); three domains representing Nat-ural Forcings (e.g. climate and tectonics), Human Society, and Ecosystems linked by two-way arrows to represent feed-back and interactions, with circular arrows representing in-ternal change, self-organisation or autogenic processes. In-ternal self-organisation processes are familiar themes in cli-mate, social and ecological lines of study, but we do not al-ways possess the tools to unravel these in the presence of ex-ternally driven effects, which may lead to their omission in explanation. Thus, the figure provides a cognitive template for understanding environmental change since the start of hu-man activities; for any zone it may help define alternative hypotheses and questions about the nature of environmental
Table 1. Palaeoenvironmental conditions and processes.
Climate – T (◦C) and P (mm), water balance
Atmospheric pollution loadings – heavy metals, acidity
Aquatic ecosystem – algae, larvae, fish, macrophytes
Terrestrial ecosystem – land cover, deforestation, cultivation, fire history
Lake trophic status/phosphorus – eutrophication Surface water pH – acidification
Minerogenic fluxes – soil erosion, alluviation, colluviation, sediment yield Carbon fluxes – accumulation/erosion
Geochemical fluxes – plant nutrient transport, weathering Water fluxes – river discharge/flood regime
change. When did society first affect the global atmosphere through gas emissions? To what extent have human ac-tivities modified local climate? How has climate deter-mined social behaviour? The paper considers the scope and desirability of studying interactions across different spatial scales. These are dealt with by considering the extremes of large “local/regional” scales (100–104km2) and small “re-gional/global” scales (104–106km2), before discussing the problems of reconciling the different viewpoints and per-spectives of the past. Existing regional/global records are used to speculate about the veracity of anthropogenic forcing of global climate, with specific consideration of the Ruddi-man (2003) theory.
2 Local/regional spatial scales
Humans continue to experience the impacts of environmental change directly at a local/regional scale, through for example meteorological extremes, flooding, sea-level rise, drought, soil erosion, fire and pollution. As such, there is a need for a full understanding of climate-human-environment in-teractions for cities, landscapes, catchments, coastal zones and ecosystems, and the production of tools and protocols that can offer sustainable management policies in the face of changing climate and social change. At this scale, two sets of questions about vulnerability and adaptation can be applied to all locations on earth:
– How sensitive or resilient are modern ecosystems and
socio-ecological systems to increased stresses from hu-man activities and climate?
– What are the appropriate sustainable management
strategies for the future?
2.1 Learning from the past
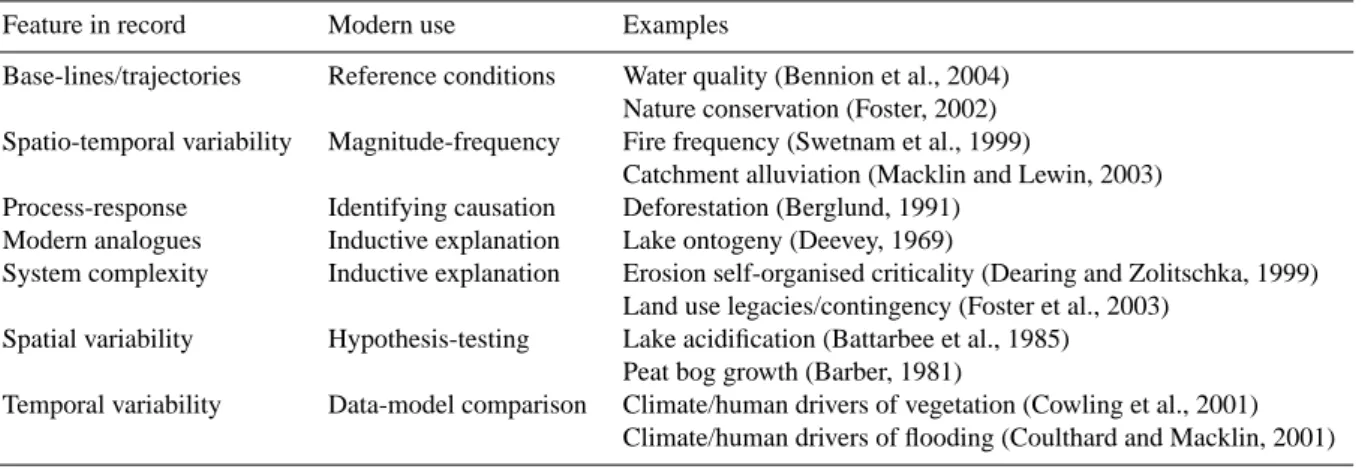
One approach to answering these questions comes through learning from the past, using local/regional case-studies that reconstruct environmental changes over timescales longer than those represented by instrument observations. This is the basis for research conducted within the PAGES Fo-cus 5 programme “Past Ecosystem Processes and Human-Environment Interactions” (http://www.liv.ac.uk/geography/ PAGESFocus5/). Palaeo-studies of environmental archives (e.g. peat, lake sediment, fluvial sediment, estuarine sedi-ments, tree-rings) have now produced a very large number of proxy records which together provide a comprehensive list of environmental conditions and processes that can be poten-tially reconstructed (Table 1), though only rarely for all in the same locality. Analysis of the proxy records provides the ba-sis for hypothesizing about the causes and effects of change. Table 2 shows that there are several modes of analysing lo-cal/regional records in order to learn from the past (Dearing, 2006b; Dearing et al., 2006a; Oldfield and Dearing, 2003).
Perhaps the simplest mode is the assessment of differences between present conditions and some period in the past that represents less disturbed conditions. This type of analysis has become an increasingly common part of environmental regulation, where there is often a demand to identify and de-scribe a “base-line” or “pre-impact” condition that can be used as a reference condition or rehabilitation target. With prospective climate change there may be a need to consider whether such conditions and targets can be assumed station-ary (e.g. Battarbee et al., 2005a). But as a general approach, the concept of “reference conditions” is now well-developed in studies of lake water quality (e.g. Bennion et al., 2004) where the chemical and biological status of a lake prior to recent human impact can be inferred from the lake sediment record. Where the reconstructed record provides a high reso-lution time series, it may be possible to define an envelope of temporal variability against which to compare modern
Table 2. Different modes of learning from the past (after Dearing et al., 2006a).
Feature in record Modern use Examples
Base-lines/trajectories Reference conditions Water quality (Bennion et al., 2004) Nature conservation (Foster, 2002) Spatio-temporal variability Magnitude-frequency Fire frequency (Swetnam et al., 1999)
Catchment alluviation (Macklin and Lewin, 2003) Process-response Identifying causation Deforestation (Berglund, 1991)
Modern analogues Inductive explanation Lake ontogeny (Deevey, 1969)
System complexity Inductive explanation Erosion self-organised criticality (Dearing and Zolitschka, 1999) Land use legacies/contingency (Foster et al., 2003)
Spatial variability Hypothesis-testing Lake acidification (Battarbee et al., 1985) Peat bog growth (Barber, 1981)
Temporal variability Data-model comparison Climate/human drivers of vegetation (Cowling et al., 2001) Climate/human drivers of flooding (Coulthard and Macklin, 2001)
time-series. In this way, it may be possible to assess whether the magnitude and frequency of, say, local flooding changed in the 20th century. The reconstruction of fire frequencies be-fore and after human impact has provided the basis for be-forest and rangeland management (e.g. Swetnam et al., 1999).
Of course, time series of data reflect not just the contin-uous changes in a single process or condition, but the op-eration and behaviour of the wider system. Thus multivari-ate data sets (often comprising multiple proxy records) of-fer the possibility to define system dynamics and to seek cause-effect explanations through inference or experiment. Understanding the complexity of current systems in terms of threshold states and nonlinearities is often stated as a high priority if we are to avoid environmental surprises at local and global levels (e.g. Amsterdam Declaration, 2001). Long timescales of observed and reconstructed data often enable, uniquely, these nonlinearities to be identified (e.g. Dearing and Zolitschka, 1999). In all these cases, learning from the past assumes that the present is simply the latest point in time. An exception is the use of modern analogues, where a past set of conditions closely resembles a present state, or projected future state. Such an approach has been success-fully used to estimate the rate of tree recolonisation for forest management (Foster, 2002). These modes of explanation are essentially inductive, but where alternative explanations ex-ist for a given phenomenon it may be argued that the great-est value of past records lies with the generation and tgreat-est- test-ing of alternative hypotheses, either by compartest-ing different records within an experimental framework (e.g. Battarbee et al., 1985), or by making comparisons between model simu-lations and observed/reconstructed data (e.g. Anderson et al. 2006).
2.2 Learning from modelling
The use of empirical data from local/regional case-studies may provide a sound basis for formulating management strategies, but maximising the information contained in past
records demands complementary modelling; the last of the tabulated categories of learning from the past (Table 2). Fol-lowing Deevey’s (1969) adage of “coaxing history to conduct experiments”, a wealth of information may be gained from the past through the testing of post hoc hypotheses by mod-elling. Indeed, where the aim is to explain or evaluate alter-native hypotheses for long-term processes, like base cation leaching, soil erosion or vegetation change, these are often the only methods available. Comparisons of model output for the past with palaeoenvironmental data may help untangle the relative roles of, for example, climate and human activity on vegetation change, and may be the only means for testing the ability of a model to simulate rarely occurring thresholds. Simulation modelling of complex landscape and ecosystem conditions at sub-global scales is therefore a key comple-ment to empirical studies of climate-human-environcomple-ment in-teractions (Dearing, 2006a; Dearing et al., 2006b) and may be used together with palaeoenvironmental data in different ways. In their review, Anderson et al. (2006) show the grow-ing success in model-data comparisons across palaeoecol-ogy, palaeoelimnology and palaeohydrology.
Models are often used to isolate an individual forcing by controlling for other variables. In these cases, human activ-ities are often dealt with implicitly. Models are run with no human drivers and compared against reconstructed records to gauge human impact. For example, Heiri et al. (2005) compare the outputs of a forest succession model with pollen diagrams in Switzerland to show that the fluctuations in tree-line after ∼4500 cal yr BP can not be explained by climate alone, and human impact is likely. In Denmark, Cowl-ing et al. (2001) show that the shift from Tilia to Fagus at Draved forest over the last 500 years (and also throughout NW Europe), modelled using FORSKA2, was unlikely to be controlled by climate only, again implicating human activi-ties. Other models seek to assess human impact by driving a model with a proxy that reflects human activity, like the changing openness of the landscape. For example, Coulthard et al. (2005) use a cellular hydro-geomorphological model
driven by records for regional rainfall (peat humification) and landscape openness (non-arboreal pollen), weighted in dif-ferent combinations, in order to assess the sensitivity of ero-sion and fluvial sediment transport in upland UK catchments to climate and land cover change. Despite the existence of lake sediment and soil chronosequence records of Holocene chemical trends (e.g. Renberg, 1990; Engstrom et al., 2000) there have been only few attempts to link these to weather-ing models. However, a mineral-weatherweather-ing model ALLO-GEN (Boyle, 2006) shows promise in simulating soil min-eral depletion in observed soil chronosequences, river wa-ter quality data and lake sediment data though further suc-cess will require better parameterization of mineral: water contact and DOC. In contrast, recent surface water acidifi-cation models are well developed. For example, lake wa-ter pH at Round Loch, Scotland, has been modelled back to ∼AD 1800 by Battarbee et al. (2005) using the MAGIC model and compared with the reconstructed record and short monitored record. In this case, discrepancies between the different records highlight a need for development of the model to include better simulation of key processes. Sim-ulation models for future climate, popSim-ulation and resources, and classifications of functional patterns in social systems (e.g. “syndromes of change”: L¨udeke et al., 2004) or typolo-gies of catchment systems (Meybeck, 2003) will continue to demand an improved understanding of socio-ecological sys-tems at local/regional scales as an essential element of gener-ating tools and strategies for sustainable management (Dear-ing et al., 2006b). As such, we can expect a significant shift from explaining the past per se to using verified dynamic models to anticipate the complexity of future environmen-tal conditions. As high resolution observational and recon-structed time-series become longer, or more available, they will provide not only crucial insight into complex interac-tions but also unique checks on the performance of dynamic models.
These modes of learning from the past, including the use of data-model comparisons, apply particularly to observed and reconstructed data expressed as time-series of quantita-tive data. But frequently, palaeoenvironmental records may be complemented with qualitative or semi-quantitative data drawn from archaeological and documentary archives. 2.3 Integrating different archival records
Tackling the complex and changing relationships between Natural Forcings, Human Society and Ecosystem domains is facilitated by the use of “parallel” records of change drawn from independent archives (e.g. observational time-series, palaeoenvironmental reconstruction, archaeological records, documented history). Utilising the full range of independent records maximises the opportunity to identify drivers and re-sponses, and so determine causality. In some locations it may be possible to combine archives and methods in order to anal-yse independent records for all three interacting domains.
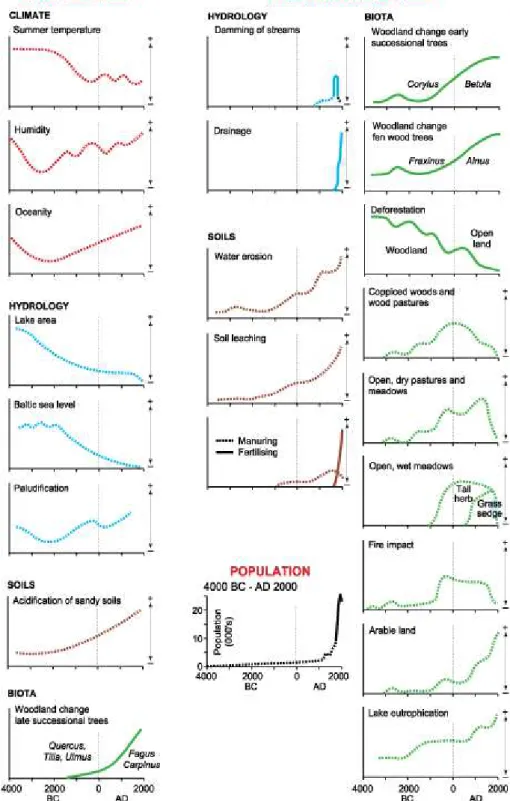
The first study of this type was, perhaps, the reconstruction of the cultural landscape in southern Sweden (Sk˚ane) over the last 5000 years (Berglund, 1991). Palaeoecological, ar-chaeological and historical data from several sites were com-bined in order to reconstruct trends in climate, hydrology, soils, biota and the human population (Fig. 2). The study at-tempted to describe changes in society and the landscape in order to better understand human-environment interactions through time and to provide a sound foundation for the man-agement of the natural environment, cultural landscapes and ancient monuments. It posed questions about the effects and spatial patterns of human influence on vegetation change set within a broad hypothesis for the development of agrarian landscapes driven by technology, population and environ-mental carrying capacity. The graphs represent one of the most comprehensive sets of long-term trends for any region. In the original study, they were used to provide a narrative of environmental change and causation, but could now be used as the means to drive and test regional simulation models. One of the methodological lessons learned from this project was the benefit of multi- and inter-disciplinary study, produc-ing where possible multiple data sets or proxies for similar phenomena. This allows independent analysis of, say, the impact of climate on vegetation or society without the circu-lar arguments that can undermine conclusions.
This lesson has been applied to a recent study of socio-ecological change in Yunnan Province, SW China. Centred on lake Erhai and its 2500 km2catchment (Elvin et al., 2003; Shen et al., 2006), the intention of this study is to understand in more detail the nature of past climate-human-environment interactions, and the implications for future sustainable man-agement. Thus independent regional climate records are provided by speleothem oxygen isotope records and marine alkenone records; lake sediment analyses and archaeological studies of alluvial fan sequences provide proxy records for vegetation and land cover, erosion and river discharge; and documented environmental history provides complementary information about human activities. A brief review of the millennial-scale results shows that interactions through the Holocene are divided into four phases (Fig. 3): an early phase where vegetation establishment and development follows the trends in mean temperature and precipitation; a second phase where climate seasonality plays a stronger role in determin-ing vegetation and river discharge, and where there may be the first signs of significant human impact; a third phase where human activity begins to exert a greater effect than climate on local environmental processes; and a final phase where human activity becomes the main control on vegeta-tion and hydrology. The climate records are also compared to the independent reconstructions of deduced and recorded human activities, and proxy records of erosion and flooding. For example, there is a strong suggestion that land manage-ment between ∼2500 cal yr BP and ∼500 cal yr BP, particu-larly involving the introduction of irrigation and wet paddy field cultivation, created a hydraulic and hydrological system
Fig. 2. Local/regional case-studies: southern Sweden. Trajectories of human actions and environmental conditions over the past 5000 years
for southern Sweden drawn from palaeoecological, archaeological and environmental history reconstructions (Berglund, 1991).
that suppresses flood peaks. Overall the evidence suggests that on millennial timescales the timing and length of distur-bance phases is not in phase with the trends or fluctuations in temperature or precipitation: changes in erosion and flooding
appear to be strongly mediated by human modification of the catchment.
The Erhai catchment system appears to have been in a phase of “human-domination” (cf. Messerli et al., 2000) for
Fig. 3. Local/regional case-studies: Yunnnan Province, SW China. Millennial-scale climate-human-environment records in the lake Erhai
catchment over the past 12 000 years: (a) regional climate proxies comprising summer monsoon intensity proxies from oxygen isotope analyses of speleothems at Dongge Cave (Wang et al., 2005; Dykoski et al., 2005) and sea surface temperature curve for the South China Sea based on alkenone analysis of marine core 17940 (Pelejero et al., 1999); (b) summer precipitation proxy (Tsuga pollen taxa); (c) open landscape/disturbed land proxies (Poaceae and disturbed land taxa); (d) soil erosion proxy (lake sediment magnetic susceptibility); (e) peak river discharge proxy (lake sediment sand fraction) with two lines depicting long term trends of low and high flood maxima. Vertical dotted lines A, B, C delimit different four time zones in which the role of climate in driving vegetation and hydrology differ (see text). Vertical shaded bars define different periods of major documented human activity (from left to right): Bronze Age culture; Han irrigation technology; Nanzhou and Dali Kingdoms; the late Ming/Qing environmental crisis (compiled from Elvin et al., 2003; Shen et al., 2006, and unpublished material).
at least 5000 years, but there is no strong evidence before or after this time for complete social collapse. Far more evi-dent is the environmental degradation and social degenera-tion seen in the last 500 years driven by failure to maintain carrying and adaptive capacities in the face of population ex-pansion. Importantly, the records show that major environ-mental processes have different trajectories, timespans, rates of change and levels of historical contingency. For example, at the present time, the trajectory of topsoil erosion seems to have been declining over many decades, if not centuries, while that of gullying may have started to increase again dur-ing the past few decades. In contrast, flooddur-ing shows no clear trend over the past few centuries because it seems to be responding to shorter term (annual–decadal) climate vari-ability and land use. In terms of the sustainvari-ability of lo-cal agriculture (subsistence and market) the largest environ-mental threat over the past 1500 years has come from high magnitude-low frequency flooding of lower dry farmed ter-races and the irrigated valley plain, and this threat continues today. Such flooding may be driven or exacerbated in the fu-ture by: continued use of high altitude and steep slopes for grazing and cultivation that generate high runoff from unpro-tected slopes, particularly in the northern basins; reduction or poor maintenance of paddy field systems, engineered flood defences, river channels and terraces; and increased sum-mer monsoon intensities. A recent review (Dearing et al., 2006c) of centennial-scale socio-environmental interactions emphasizes the theoretical sustainability of modern agricul-tural systems. Many are approaching, or have reached, a state of hyper-coherence or “brittleness” where continued re-silience to external perturbations becomes increasingly diffi-cult and costly. The reconstructed history of the Erhai region using all available archival information suggests that a state of minimum resilience may have already been reached, and provides the foundation for formulating new and appropriate land management strategies.
3 Regional/global spatial scales
The rise of earth systems research has set new agenda about the relative roles of human and natural drivers of cli-mate change at regional/global scales (e.g. Tarasov et al., 2005). However, learning from the past about climate-human-environment interactions at these scales – regions, continents, the globe – is arguably more challenging than for local/regional scales. A key problem is the scarcity of certain Holocene datasets for global processes, and the difficulties of upscaling empirical data. For recent decades, the period of maximum instrumentation, there are records or estimates of many earth system processes operating at the global scale: global warming, disruption of nutrient cycles, atmospheric pollution, UV radiation, land-cover change, habitat destruc-tion and species invasions (e.g. Steffen et al., 2004; Hibbard et al., 2006). But the availability of longer records
(centen-nial and millen(centen-nial) is heavily skewed towards specific types of data.
3.1 Atmospheric/climate records
High resolution series of gases, dusts, salts and acids from ice cores (Fig. 5) have provided an exceptionally strong ba-sis for reconstructing aspects of hemispheric and global cli-mate change (e.g. Fisher and Koerner, 2003), and hypothe-sizing the likely climate drivers. Most recently, the Antarc-tic ice core curves for CO2 and CH4, showing rises since the early-mid Holocene (Fig. 4a) that may be unique within OI stages 5, 7, 9 and 11, have provoked strenuous debate about the role of anthropogenic forcings through modifica-tion of global vegetamodifica-tion cover (Joos et al., 2004; Ruddi-man, 2003, 2005; Ruddiman and Thomson, 2001). Ice cores, marine sediments and to a lesser extent, loess records, pro-vide the global framework for studying long term climate change. At sub-global scales, the distribution of recon-structed climate records is not normally sufficiently dense to reveal the spatial scale of climate heterogeneity through time, and thus questions must remain about the locational bias of global records and the validity of downscaled region-alisation of global records for application to local/regional case-studies of environmental change. For some climate phe-nomena like monsoon intensity there are an increasing num-ber of high resolution series based on stable isotope anal-ysis of speleothems at sub-global scales (Fig. 3a), and for some shorter and more recent periods during the Holocene there are compilations of reconstructed climate parameters (e.g. temperature) at hemispheric scales (e.g. Moberg et al., 2005). Thus, notwithstanding the problems of spatial repre-sentation and downscaling, and the challenges of combining records from different archives, regional/global-scale climate records are, when compared with the other domains of Hu-man Society and Ecosystems, fairly well represented. 3.2 Human activities
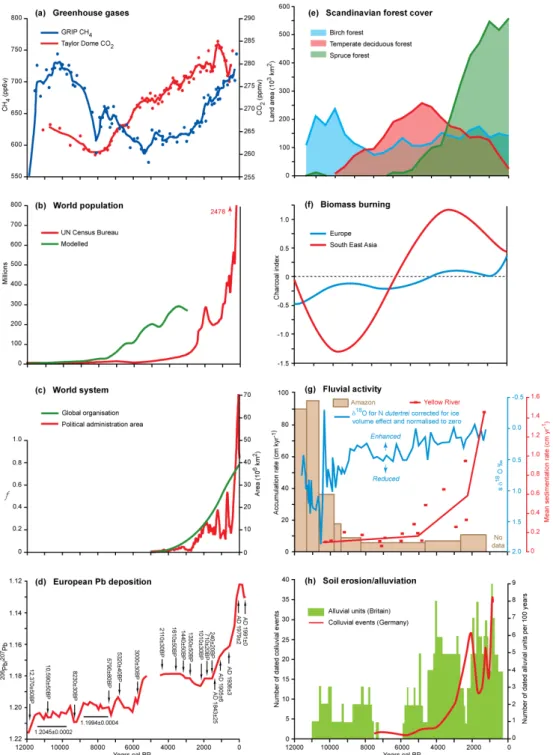
For human activities, independent global data may be gen-erated from widely dispersed and heterogenous archives, but over the long term they are scarce or time-limited. The UN Census Bureau (2006) estimates the global human popula-tion curve back to 12 000 cal yr BP that shows increases from 5000 cal yr BP up to AD 1970 and AD 2000 of ∼300-fold and ∼500-fold respectively (Fig. 4b), but a comparison be-tween the UN estimates and one population model (e.g. Wirtz and Lemmen, 2003) shows more than an order of magni-tude difference between 8000 and 5000 cal yr BP (Fig. 4b). Linked to human activities worldwide is the growth of colonised land area. One cartographic estimate (Taagepera, 1997) of changing cumulative political area over the late-Holocene shows a value of ∼0.15 million km2 (∼0.1% to-tal dry land) 5000 years ago rising to ∼42 million km2(32% total dry land) in 1975 (Fig. 4c). Interestingly, this rise
Fig. 4. Regional/global scale Holocene records of atmospheric/climate, human and environmental processes. (a) Ice core records of
green-house gases methane and carbon dioxide, with 3pt smoothed curves added (Blunier et al., 1995; Inderm¨uhle et al., 1999; IGBP PAGES/World Data Center for Paleoclimatology, NOAA/NGDC Paleoclimatology Program, Boulder CO, USA; (b) Human population (UN Census Bu-reau, 2006; Wirtz and Lemmen, 2003); (c) Political administrative units (from data in Taagepera, 1997) and theoretical trend of global organisation (Devezas and Modelski, 2003); (d) European Pb deposition (Swiss peat sequence), showing shift in206Pb/207Pb ratio from 5500 BP and 3000 BP onwards representing wind erosion and Pb mining respectively (Shotyk et al., 1998); (e) Forest change in Scandinavia based on multiple pollen diagrams (Holmvquist et al., in preparation, 2006); (f) Biomass burning in Europe and SE Asia based on charcoal proxy records (Carcailllet et al., 2002); (g) Water (blue) and sediment (brown) discharge for the Amazon basin (Maslin et al., 2000), based on changes in δ18O in fan sediments and deltaic accumulation rates, and sediment discharge in in the Yellow River basin, China, based on alluvial accumulation rates (Xu, 1998); (h) Soil erosion intensity in Germany based on frequency of OSL dated colluvial sequences (Lang, 2003), and river activity in Britain based on frequency of14C dated alluvial units (Macklin, 1999).
Fig. 5. Regionalisation of past records. An example of an organisational matrix for the regionalisation of global case–studies within PAGES
Focus 5. Each cell represents a region for which high quality (well-dated, high resolution) multi- and inter-disciplinary palaeoenvironmental data (including sedimentary, archaeological, instrument and documentary data as appropriate/available) already exist and where synthesis of information for different environmental systems (e.g. lakes, fluvial) and/or at different scales is feasible. Blank cells could be targeted for new studies, with priorities set by criteria such as: high biodiversity status; fragile and/or degraded regions; projected climate and/or human impacts; and regions coincident with other IGBP Core Projects (Dearing et al., 2006b).
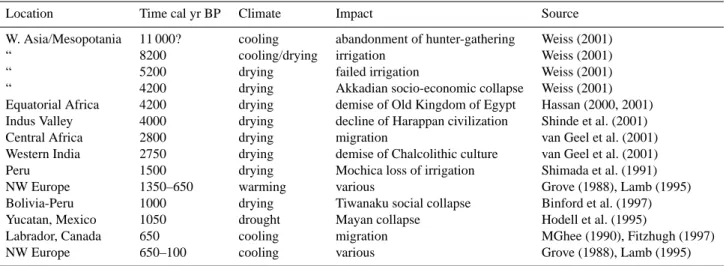
of ∼280 fold is very close to the figure for the rise in hu-man population (UN data) over the same period. Assum-ing that agricultural area is roughly linked to the number of people it has to support (cf. Ruddiman, 2003), these curves can provide a guide as to when and where agricultural ar-eas are expanding or contracting. Over millennia, however, this link breaks down as technology modifies the efficiency of agriculture. Archaeological, historical and palaeoenviron-mental evidence also point to numerous historical periods when civilizations were either rising or falling in terms of their populations and power, or to “dark age” periods of ap-parent quiescence. Some argue for the presence of an in-ternally generated cyclical dynamic (e.g. Friedman, 2006), while others demonstrate social demise through direct and indirect impacts of epidemics and climate (Table 3). There are a few estimates from the world system history commu-nity of changing global social processes over long timescales, such as globalisation and democratisation (Modelski and Perry, 2002), which are likely to be internally organized rather than driven by external processes. For example, one suggestion is that the evolution of the world system since 5000 cal yr BP can be understood as a logistical curve de-scribing a millennial-scale learning process. Devezas and Modelski (2003) utlise population and urbanisation data to argue that there is an emergent world system process of
macroorganization that, at the modern time, is 80% complete (Fig. 4c). The lack of long term data for human activities at regional/global scales suggests that strengthening the links between Earth System Science and World System History (cf. Hornborg et al., 2006) would be mutually beneficial. 3.3 Ecosystems
For many ecological processes and conditions, Holocene records at regional/global scales are also lacking or severely constrained. One exception is for atmospheric pollution, where numerous records from peat, lake sediment and ice cores provide reconstructions of industrial contaminants. For example, the peat-based Holocene record of Pb isotopes and Pb loadings in the Jura mountains (Shotyk et al., 1998) tracks well the rise of the use of Pb in Europe (Fig. 4d), the ini-tial switch from natural sources to smelted sources taking place about 3000 BP, with a very rapid rise in Pb pollution over the last 1000 years. For global and regional histories of vegetation cover, biomass and biomass burning, essen-tial for testing and driving carbon and climate models, we might expect to turn to the numerous pollen diagrams that exist worldwide. But the dual challenges of transforming proxy data to quantitative estimates of vegetation cover and of upscaling local records still present barriers to progress (e.g. Brovkin et al., 2005). These are well illustrated at the
Table 3. Examples of direct climate impact on human societies inferred from palaeoenvironmental evidence (mainly cited by Catto and
Catto 2001; deMenocal, 2001).
Location Time cal yr BP Climate Impact Source W. Asia/Mesopotania 11 000? cooling abandonment of hunter-gathering Weiss (2001)
“ 8200 cooling/drying irrigation Weiss (2001)
“ 5200 drying failed irrigation Weiss (2001)
“ 4200 drying Akkadian socio-economic collapse Weiss (2001) Equatorial Africa 4200 drying demise of Old Kingdom of Egypt Hassan (2000, 2001) Indus Valley 4000 drying decline of Harappan civilization Shinde et al. (2001) Central Africa 2800 drying migration van Geel et al. (2001) Western India 2750 drying demise of Chalcolithic culture van Geel et al. (2001) Peru 1500 drying Mochica loss of irrigation Shimada et al. (1991) NW Europe 1350–650 warming various Grove (1988), Lamb (1995) Bolivia-Peru 1000 drying Tiwanaku social collapse Binford et al. (1997) Yucatan, Mexico 1050 drought Mayan collapse Hodell et al. (1995)
Labrador, Canada 650 cooling migration MGhee (1990), Fitzhugh (1997) NW Europe 650–100 cooling various Grove (1988), Lamb (1995)
landscape level by the combination of observations and nu-merical modelling approaches used by the POLLANDCAL community (e.g. Brostr¨om et al., 2004; Gaillard et al., 2000; Sugita et al., 1999) to calibrate pollen spectra against con-temporary vegetation at the level of estimating the degree of openness or forest cover. Recent advances with neural net-work analyses of ∼308 pollen diagrams from Scandinavia (Holmqvist et al., 20061) provides time series of estimated land area covered by six different ecological functional units (e.g. Pine or Spruce forest) (Fig. 4e). Despite representing only ∼106km2 or ∼0.7% of the total global dry land area (excluding Antarctica), the results show the future possibil-ity of producing continental scale or hemispheric estimates of land cover, and hence biomass, through the Holocene from pollen data. Biomass burning can potentially be estimated from Holocene descriptions of fire regime, deduced from counts of radiocarbon dated charcoal in soils and charcoal counts in dated sediments. Carcaillet et al. (2002) aggregate data from ∼100 sites worldwide to derive millennial-scale Holocene curves for fire frequency in Europe, South Amer-ica, Central AmerAmer-ica, North America and Oceania (Fig. 4f). Although the regional curves show strong differences, the authors argue that global biomass burning has intensified during the late Holocene, especially in Europe, equatorial South America and southeast Asia, probably linked to agri-cultural development. For testing hydrological models, ma-rine sediment records (stable isotopes, accumulation rates) and deltaic stratigraphy provide Holocene records of river discharge, sediment discharge (Fig. 4g) and channel change (e.g. Stouthamer, 2001). It seems feasible that these could be compiled to produce continental-scale data for fluvial ac-1Holmqvist, B. H., Bradshaw, R. H. W., and Berglund, B. E.: Holocene dynamics of Scandinavian forest types: a new pollen mapping approach, in preparation, 2006.
tivity. However, for some other processes operating in cas-cading systems, the inherent spatial-dependency invalidates linear upscaling of data. For example, data for the frequency of OSL dates in colluvium from S. Germany and14C dated alluvial units in Britain (Fig. 4h) provide reasonably accu-rate regional views (103–105km2) of the timing or inten-sity of soil erosion and sediment delivery events. But they also serve to demonstrate that downslope measures of soil or sediment losses are mediated by upslope catchment stor-age and long-term changes in the preservation of sediment sequences at a site. Dearing and Jones (2003) compile lake and marine records of sediment delivery to show that while the record of particulate transport to the global coastline is estimated as having doubled since human activities began (Milliman and Syvitski, 1992), the figure masks the high variance and movement of >90% of eroded sediment at lo-cal slo-cales. For other processes key to our understanding of the earth system, like weathering, there is scant empiri-cal data for Holocene changes at regional/global sempiri-cales. At catchment scales, a number of Holocene lake sediment-based time-series of pH and water chemistry exist, reconstructed from microfossil transfer functions and geochemical analy-sis (e.g. Engstrom et al., 2000; Renberg, 1990). As discussed above, they clearly have the potential to provide the basis for testing new numerical weathering models at local/regional scales (Boyle, 2006), but at present the challenges to upscal-ing seem dauntupscal-ing.
3.4 Global records and the Ruddiman theory
Comparison of Holocene global records has been most re-cently scrutinised in the debate over anthropogenic forc-ing of atmospheric gasses. Ruddiman (2003) used ar-chaeological, palaeoecological and historical records to support his hypothesis that the apparently anomalous
increases in Antarctica ice core CO2and CH4records from
∼8000 cal yr BP and ∼5000 cal yr BP respectively are related
to the impacts of early agriculture: forest clearance and irri-gated rice farming. Ruddiman argues further that CO2 oscil-lations during the last 1000 years are better explained by the abandonment of farms and the regrowth of forest in western Eurasia driven by disease epidemics curtailing human activi-ties rather than by solar-volcanic forcings. Ruddiman volun-teers the need for further work, particularly in reducing the temporal uncertainties in the ice core records, but even as it stands the evidence in the papers provides a tantalising and alternative theory for Holocene climate change. In addition to Ruddiman’s published attempts to compare the ice core curves to records for land use change and epidemics, there is additional circumstantial evidence (Fig. 4) from existing datasets and models: the rise in C02concentrations is coinci-dent with the take-off in modelled global populations (Wirtz and Lemmen, 2003); the curves appear to track broad fea-tures for charcoal in Europe and the tropics (Carcaillet et al., 2003). But so far, the lack of empirical data for key variables at a global scale, like biomass, has reduced the chance of suc-cessful hypothesis-testing. As a result, the acceptance or re-jection of the theory seems to lie either with the accuracy and precision of carbon modelling through the Holocene (Joos et al., 2004), or the strength of similarity between the Holocene and that part of the ice core record which represents the stage 11 “Holocene” analogue – which in turn seems to hang on the choice of age-model (cf. Broecker and Stocker, 2006; Ruddiman, 2005). Both of these approaches are essential and valid, but may not in themselves provide sufficient ex-planation, particularly in terms of answering not so much the question “did humans drive CO2emissions?” but rather “by how much?” The loss of biomass between 8000 cal yr BP and AD 1800 needed to produce the “anomalous” 40 ppm CO2is
∼50% (Broecker and Stocker, 2006) based on calculations
by Joos et al. (2004), but Ruddiman’s recent revision of a direct anthropogenic emission of 14 ppm CO2, in line with the record of carbon isotope changes, would suggest a much lower biomass reduction of 17–20%. One can make several observations about whether this level of loss is plausible:
1. The human population probably rose by two orders of magnitude during this period, and clearly there is plenti-ful evidence from pollen diagrams, archaeological find-ings and environmental history for forest clearance, par-ticularly in Europe, W. Asia and E. Asia. Calcula-tions based on environmental history suggest losses of 7–8 M km2 of closed forest and ∼2–3 M km2 of open woodland/scrub, representing overall reductions since the early Holocene of 14–15% by 1970 (Matthews, 1983) and ∼20% by 2000 (Matthews et al. 2000). Given the rapid land cover transformation during 19th and 20th century, these estimates of biomass reduc-tion would fall far short of the 17–20% reducreduc-tions up to 1800, as required by Ruddiman’s theory. However,
Matthews et al. (2000) also argue that the older stud-ies were based on coarse resolution vegetation and land use databases that may underestimate historic forest loss considerably. The World Conservation Monitoring Cen-tre (WCMC) developed a higher resolution map of po-tential forest cover for 8000 years ago. Comparison of this map with current forest cover indicates that nearly 50 percent of the earth’s pre-agricultural forest cover may have been cleared (Matthews et al., 2000). Thus there is great uncertainty in the calculation of past and present biomass, especially in the quantification of past forest area in terms of canopy area and hence estimates of actual aerial biomass. In these respects, the ongo-ing endeavours of the POLLANDCAL community and calls for a new global initiative to quantify past forest cover (Tarasov et al., 2005) are particularly welcome. 2. The marked difference in curve shapes, convex
(up-wards) for CO2 and concave (upwards) for human population argues for nonlinear connections, if any. (Figs. 4a, b). Certainly, there should be disproportion-ately lower releases of gases as agricultural efficiency increases. For example, farmers following annual or multi-cropping systems can support up to two orders of magnitude more people per unit area than under the for-est fallow system. But farming and forfor-est clearance at a location through the Holocene may also have varied in terms of spatial intensity. Global land use models that simulate C budgets may calculate over relatively coarse spatial scales (e.g. 1◦
×1◦: equivalent to 5000–
11 000 km2 between 0◦ and 70◦ latitude). Thus given
the difficulties of quantifying the patchiness of forest clearance (Matthews et al., 2000), how do we know that total biomass losses typical of early agriculture are not underestimated by these means? In a similar vein, Rud-diman and Thomson (2001) argued for the need to find reliable records of the area of rice farmed. These uncer-tainties argue for the quantification of the local C bud-gets of early agricultural systems (e.g. early paddy field sytems) and how they change to the present time. 3. Since the ratio of soil C to vegetation C is typically
>1 and may reach ∼3 in grassland replacing forests,
and >10 in croplands (House et al., 2002), it follows that atmospheric C may have been strongly affected by processes affecting soil organic matter: accelerated soil erosion following clearance, herbivore grazing, burn-ing and ploughburn-ing. These can be expected to dramat-ically raise C losses to atmosphere through respira-tion/decomposition, particularly in the early phases of disturbance when soil C is often maximal and during the relatively warm early Holocene. There are insuffi-cient data to estimate quantitatively the likely impact, but there are some useful pointers. For example, Ped-ersen et al. (2002) cite evidence that shows 66% of flu-vially transported particulate OM is respired, and recent
calculations (Bellamy et al., 2005) of modern soil C losses in the UK show remarkably rapid losses (0.6% yr over ∼25 years), especially in soils with initially high C concentrations.
4. In some regions, we may have underestimated the role of early human actions in driving changes in biomass, exemplified in two recent studies. In one example, from western Asia, Roberts (2001) concludes that grazing caused the suppression of natural forest regeneration during the early Holocene, and by implication the stand-ing regional biomass. Thus, in addition to activities that transformed land cover from one type to another, as with deforestation, human activities may have also modified natural processes which would have normally led to a greater CO2drawdown. If widespread, unidentified for-est suppression would lead to a significant underfor-estima- underestima-tion of potential biomass under undisturbed condiunderestima-tions. For a second example, one can observe that the role of pastoralists in studies of the mid-Holocene switch at
∼5500 BP from a relatively humid to an arid Saharan
re-gion (Claussen et al., 1999; deMenocal et al., 2000) has largely been ignored. This is despite archaeological evi-dence (Hassan, 2002) for the presence of cattle pastoral-ism spreading out from the Egyptian Sahara after 8000– 7000 cal yr BP, which by 6000 cal yr BP had spread to large parts of S and E Algeria, N Niger, S Libya, N Chad and NW Sudan. While the southward displace-ment of the monsoon is not in doubt, there must remain the question of the extent to which grazing pressures accentuated the natural vegetation changes that in turn led to an irreversible change in microclimate (cf. Foley et al., 2003). This has implications too for our under-standing of the climate system. Models of recent deser-tification point strongly to the combined effects of dry-ing trends and grazdry-ing (Wang and Eltahir, 2000), yet the bi-stability of the Saharan ecosystem is held up as an ex-ample of “natural” nonlinear switching between steady states. How do we know that the switch would have been so rapid and irrevocable without the conditioning effects of pastoralists?
4 Discussion
The sections above support the view that a full understand-ing of causes of earth system change through (at least) the Holocene can come only through the most rigorous recon-structions of climate, human activities and earth processes, and importantly their interactions, at all locations and at all scales. To some, especially whose training and natural lean-ings are towards solely palaeoclimate, social change or eco-logical processes this assumption may be too open-ended – or too daunting a task to contemplate. But to argue that early human effects may be safely ignored in palaeoclimate re-constructions, or to assume that human activities were
in-significant, runs counter to the voluminous amount of lo-cal/regional data world-wide for early and measurable re-sponses to human activity in, for example, pollen diagrams, reconstructed water quality or erosion records, and presup-poses that we understand the magnitude of upscaled and cu-mulative effects on global processes. Similarly, to ignore cli-mate change as a potential element in affecting social be-haviour is to refute not just the growing number of regional and global palaeoclimate reconstructions which show that Holocene climate varied across a wide frequency range, but also the equally strong archaeological/anthropological evi-dence for climate being implicated in social change, and even collapse, on all the continents (except Antarctica) – espe-cially in marginal agricultural environments.
Palaeoenvironmental information has been derived from numerous environmental archives, covering large parts of the world, but it is often not compiled or fully analysed in re-lation to other, often more recent, datasets. One suggestion from PAGES Focus 5, soon to be revised as the “Past Human-Climate-Ecosystem Interactions”(PHAROS) programme, is to produce syntheses of palaeoenvironmental data at regional levels, or for common ecosystems and landscapes, which to-gether may capture long term (100–102years) ecosystem dy-namics and contemporaneous forcings. A draft scheme for organising regional syntheses shows a two-dimensional ma-trix defined by zonal and azonal geographical regions, and simple measures of the intensity and duration of past human impact (Fig. 5). It is hoped that this will allow cataloguing of regions where sufficient information and data already exist, and to prioritise new regions where new records and syn-theses are required, under criteria such as: “fragile human landscapes”, “threatened human landscapes”, and “climate hotspots”. Three further aspects of international environmen-tal change research would be addressed by these syntheses.
First, an improved ability to scale-up local case-studies through coordinated regionalisation would allow generali-sation or transfer of findings across larger geographical ar-eas and ecosystems, giving compatibility with the scale of real and modelled environmental drivers (e.g. environmen-tal regulation, downscaled GCM outputs). This has already been attempted for global vegetation/biomass maps for cho-sen time periods (e.g. BIOME 6000) through the biomization of pollen diagrams (Prentice et al., 1996). For other envi-ronmental processes, compilation of empirical data may pro-vide useful generalisations of spatially-dependent process re-sponses, such as soil erosion following disturbance (Dearing and Jones, 2003). If it is desirable to generate global records of other environmental processes and conditions, like land use/cover and biomass burning, there may be no alternative to detailed compilation and mapping of historical data.
Second, a full inventory of past environmental processes and human-environment interactions could make a contri-bution towards ranking past and present system states, for example, in terms of sensitivity or resilience to particular combinations of climate and human impact. Success in
this respect may require the development and application of new methods (Redman and Kinzig, 2003) for analysing long term histories: identifying slow-large and fast-small scales of change (Gunderson and Hollling, 2002); rates of change in key process variables (e.g. Dodson and Mooney, 2002); changes in variance as an indicator of tipping points (e.g. Brock and Carpenter, 2006); or parameter “distances” from pre-impact states.
And thirdly, such syntheses can provide the datasets needed for developing and testing predictive models. There is an urgent need to develop long-term simulation models that can help anticipate complex ecosystem behaviour and environmental processes in the face of global environmental change. Where such timescales are greater than the length of time over which instrument observations exist, palaeoenvi-ronmental data will represent the only means for driving and testing a simulation model. Indeed, where historically moni-tored data for ecosystems and processes are deficient or non-existent, palaeoenvironmental proxy data from lake, flood-plain, estuarine and organic sediments will normally repre-sent the closest alternatives in terms of data type, precision and temporal resolution (e.g. Dearing et al., 2000a). A major initiative in this respect is the ESSP initiative “Integrated His-tory and Future of People on Earth” (IHOPE, 2006; Costanza et al., 2006) which aims to produce an integrated history of the earth and society in order to further the construction and testing of simulation models for the future. The challenge therefore exists for palaeoclimate and palaeoecological com-munities to generate the requisite data, levels of understand-ing and modellunderstand-ing tools that can help resolve climate-human-environment interactions – both in the past and for the future. Acknowledgements. This paper is based on a presentation given
at the PAGES OSM Meeting in Beijing, August 2005, for which I would like to acknowledge receipt of travel funds from the Royal Society, UK. Parts of this paper have previously been covered in other publications, notably Anderson et al. (2006); Dearing (2006), Dearing et al. (2006a, b). In this respect I would like to acknowledge N. Roberts’ idea for the regionalization matrix in Fig. 5, and discussions particularly with J. Anderson, R. Battarbee, J. Boyle, R. Dikau, H. Bugmann, M.-J. Gaillard, I. Laroque and F. Oldfield. R. Bradshaw and J. Boyle made comments on the text, and R. Bradshaw kindly provided unpublished data for Fig. 4e. I thank two anonymous referees for their insightful comments. Thanks go to S. Mather and S. Yee for producing the figures. I thank the following publishers for permission to reproduce material for figures: Fig. 2 reprinted with permission from Oikos; Fig. 3a (part). reprinted from Earth and Planetary Science Letters, 233, Dykoski et al., A high resolution, absolute-dated Holocene and deglacial Asian monsoon record from Dongge Cave, China,, 71–86. Copyright 2005, with permission from Elsevier; Fig. 4c (part) reprinted from Technological Forecasting and Social Change, 70, Devezas, T. and Modelski, G., Power law behavior and world system evolution: A millennial learning process, 819–859. Copyright (2003), with permission from Elsevier; Fig. 4d reprinted with permission from Science, 281, Shotyk, W., et al., History of atmospheric lead deposition since 12 370 14C yr BP from a peat
bog, Jura Mountains, Switzerland, 1635–1640. Copyright 1998 AAAS; Fig. 4f reprinted from Chemosphere, 49, Carcaillet, C., et al., Holocene biomass burning and global dynamics of the carbon cycle, 845–863. Copyright (2002), with permission from Elsevier; Fig. 4g (part) reprinted from Journal of Quaternary Science, 15, Maslin, M. A. et al., Paleoreconstruction of the Amazon freshwater and sediment discharge using sediments recovered form Site 942 on the Amazon Fan, 419–434. Copyright 2000. Copyright John Wiley & Sons Limited. Reproduced with permission. This material is not included in the Creative Commons licence and may not be reproduced unless and until specific permission is obtained from John Wiley & Sons, Ltd; Fig. 4g (part) reprinted from Geografiska Annaler, 80, Xu, J., Naturally and anthropogenically accelerated sedimentation in the lower Yellow River, China, over the past 13 000 years, 67–78, with permission from Blackwell Publishing. Figure 4h (part) reprinted from Catena, 51, Lang, A., Phases of soil erosion-caused colluviation in the loess hills of South Germany, 209–221, Copyright (2003), with permission from Elsevier; Fig. 4h (part) reprinted from Journal of Quaternary Science, 14, Macklin, M. G., Holocene river environments in prehistoric Britain, 521–530. Copyright 2003. Copyright John Wiley & Sons Limited. Reproduced with permission. This material is not included in the Creative Commons licence and may not be reproduced unless and until specific permission is obtained from John Wiley & Sons, Ltd. Edited by: H. Wanner
References
Anderson, N. J., Bugmann, H., Dearing, J. A., and Gaillard-Lemdahl, M.-J.: Linking palaeoenvironmental data and models to understand the past and to predict the future, Trends in Ecol-ogy and Evolution, doi:10.1016/j.tree2006.09.005, 2006. Amsterdam Declaration: http://www.sciconf.igbp.kva.se/
Amsterdam Declaration.html, 2001.
Barber, K. E.: Peat stratigraphy and climatic change, AA Balkema, Rotterdam, 1981.
Battarbee, R. W., Flower, R. J., Stevenson, A. C., and Rippey, B.: Lake acidification in Galloway: a palaeoecological test of com-peting hypotheses, Nature, 314, 350–352, 1985.
Battarbee, R. W., Monteith, D. T., Juggins, S., Evans, C. D., Jenk-ins, A., and Simpson, G. L.: Reconstructing pre-acidification pH for an acidified Scottish loch: a comparison of palaeolimnology and modelling approaches, Environ. Pollut., 137, 135–149, 2005. Bellamy, P. H., Loveland, P. J., Bradley, R. I., Lark, R. M., and Kirk, G. J. D.: Carbon losses from all soils across England and Wales 1978–2003, Nature, 437/8, 245–248, 2005.
Bennion, H., Fluin, J., and Simpson, G. L.: Assessing eutrophica-tion and reference condieutrophica-tions for Scottish freshwater lochs using sub-fossil diatoms, J. Applied Ecology, 41, 124–138, 2004. Berglund, B. E. (Ed.): The Cultural Landscape During 6000 Years
in Southern Sweden (Ecological Bulletin 41), Blackwell, Ox-ford, 1991.
Binford, M. W., Kolata, A. L., Brenner, M., Janusek, J. W., Seddon, M. T., Abott, M., and Curtis, J. H.: Climate variation and the rise and fall of an Andean civilization, Quat. Res., 47, 235–248, 1997.
Blunier, T., Chappellaz, J. A., Schwander, J., Stauffer, B., and Ray-naud, D.: Varaiations in atmospheric methane concentration
dur-ing the Holocene epoch, Nature, 374, 46–49, 1995.
Boyle, J. F.: Simulating long-term weathering loss of primary sili-cate minerals from the soil using ALLOGEN: comparison with soil chronosequences, lake sediment and river solute flux data, Geomorphology, in press, 2006.
Brock, W. A. and Carpenter, S. R.: Variance as a leading indicator of regime shift in ecosytem services, Ecology and Society, 11, 9, 2006.
Broecker, W. S. and Stocker, T. F.: The Holocene CO2 rise: an-thropogenic or natural?, EOS Transactions of the American Geo-physical Union, 87, 27–29, 2006.
Brostr¨om, A., Sugita, S., and Gaillard, M.-J.: Pollen productivity estimates for reconstruction of past vegetation cover in the cul-tural landscape of Southern Sweden, The Holocene, 14, 371– 384, 2004.
Brovkin, V., Bendtsen, J., Claussen, M., Ganopolski, A., Kubatzki, C., Petoukhov, V., and Andreev, A.: Carbon cycle, vegeta-tion and climate dynamics in the Holocene: Experiments with the CLIMBER-2 model, Global Biogeochem. Cycles, 16, 1139, doi:10.1029/2001/GB001662, 2002.
Carcaillet, C., Almquist, H., Asnong, H., Bradshaw, R. H. W., Carri´on, J. S., Gaillard, M.-J., Gajewski, K., Haas, J. N., Haberle, S. G., Hadorn, P., M¨uller, S. D., Richard, P. J. H., Richoz, I., R¨osch, M., S´anchez Goni, M. F., von Stedingk, H., Stevenson, A. C., Talon, B., Tardy, C., Tinner, W., Tryterud, E., Wick, L., and Willis, K. J.: Holocene biomass burning and global dynam-ics of the carbon cycle, Chemosphere, 49, 845–863, 2002. Catto, N. and Catto, G.: Climate change, communities, and
civi-lizations: driving force, supporting player, or background noise?, Quat. Int., 123–125, 7–10, 2004.
Claussen, M., Kubatzki, C., Brovkin, V., Ganoposki, A., Hoelz-mann, P., and Pachur, H. J.: Simulation of an abrupt change in Saharan vegetation in the mid-Holocene, Geophys. Res. Lett., 26, 2037–2040, 1999.
Costanza, R., Graumlich, L., and Steffen, W.: Integrated History and future Of People on Earth, Dahlem Workshop Report 96, The MIT Press, Cambridge MA, in press, 2006.
Coulthard, T. J. and Macklin, M. G.: How sensitive are river sys-tems to climate and land-use changes? A model-based evalua-tion, J. Quat. Sci., 16, 347–351, 2001.
Coulthard, T. J., Lewin, J., and Macklin, M. G.: Modelling differen-tial catchment response to environmental change, Geomorphol-ogy, 69, 222–241, 2005.
Cowling, S. A., Sykes, M. T., and Bradshaw, R. H. W.: Palaeovegetation-model comparisons, climate change and tree succession in Scandinavia over the past 1500 years, J. Ecology, 89, 227–236, 2001.
Cumming, G. S., Cumming, D. H. M., and Redman, C. L.: Scale mismatches in social-ecological systems: causes, consequences and solutions, Ecology and Society, 11, 14, 2006.
Crutzen, P. J.: The geology of mankind, Nature, 415, 23, 2002. Dearing, J. A.: Integration of world and earth systems: heritage and
foresight, in: The World System and the Earth System, edited by: Hornborg, A. and Crumley, C., Left Coast Books, Santa Barbara, 2006a.
Dearing, J. A.: Human-environment Interactions: Learning from the Past, in: Integrated History and future Of People on Earth, edited by: Costanza, R., Graumlich, L., and Steffen, W., Dahlem Workshop Report 96, The MIT Press, Cambridge MA, 2006b.
Dearing, J. A., Battarbee, R. W., Dikau, R., Larocque, I., and Old-field, F.: Human-environment interactions: learning from the past, Regional Environmental Change, 6, 1–16, 2006a.
Dearing, J. A., Battarbee, R. W., Dikau, R., Larocque, I., and Old-field, F.: Human-environment interactions: towards synthesis and simulation, Regional Environmental Change, 6, 115–123, 2006b.
Dearing, J. A., Graumlich, L. J., Grove, R., Gr¨ubler, A., Haberl, H., Hole, F., Pfister, C., and van der Leeuw, S. E.: Integrating socio-environment interactions over centennial timescales: needs and issues, in: Integrated History and future Of People on Earth, edited by: Costanza, R., Graumlich, L., and Steffen, W., Dahlem Workshop Report 96, The MIT Press, Cambridge MA, 2006c. Dearing, J. A. and Jones, R. T.: Coupling temporal and spatial
di-mensions of global sediment flux through lake and marine sedi-ment records, Global and Planetary Change, 39, 147–168, 2003. Dearing, J. A. and Zolitschka, B.: System dynamics and environ-mental change: an exploratory study of Holocene lake sediments at Holzmaar, Germany, The Holocene, 9, 531–540, 1999. Deevey, E. S.: Coaxing history to conduct experiments, Biosci., 19,
40–43, 1969.
deMenocal, P. B, Ortiz, J., Guilderson, T., Adkins, J., Sarnthein, M., Baker, L., and Yarusinski, M.: Abrupt onset and termination of the African Humid Period: Rapid climate response to gradual insolation forcing, Quat. Sci. Rev., 19, 347–361, 2000.
deMenocal, P. B.: Cultural responses to climate change during the late Holocene, Science, 292, 667–673, 2001.
Devezas, T. and Modelski, G.: Power law behavior and world system evolution: A millennial learning process, Technological Forecasting and Social Change, 70, 819–859, 2003.
Diamond, J.: Collapse: how societies choose to fail or survive, Allen Lane, London, 2005.
Dodson, J. R. and Mooney, S. D.: An assessment of historic human impact on south-eastern Australian environmental systems using late Holocene rates of environmental change, Australian Journal of Botany, 50, 455–464, 2002.
Dykoski, C. A., Edwards, R. L., Cheng, H., Yuan, Daoxian, Cai, Y., Zhang, M., Lin, Y., Qing, J., An, Z., and Revenaugh, J.: A high resolution, absolute-dated Holocene and deglacial Asian mon-soon record from Dongge Cave, China, Earth Planet. Sci. Lett., 233, 71–86, 2005.
Elvin, M., Crook, D. S., Jones, R. T., and Dearing, J. A.: The Impact of Clearance and Irrigation on the Environment in the Lake Erhai Catchment from the Ninth to the Nineteenth Century, East Asian Studies, 23, 1–60, 2002.
Engstrom, D. R., Fritz, S. C., Almendinger, J. E., and Juggins, S.: Chemical and biological trends during lake evolution in recently deglaciated terrain, Nature, 408, 161–166, 2000.
Fisher, D. A. and Koerner, R. M.: Holocene ice-core climate history – A multi-variable approach, in: Global Change in the Holocene, edited by: Mackay, A., Battarbee, R. W., Birks, H. J. B., and Oldfield, F., Hodder Arnold, London, 2003.
Fitzhugh, W. W.: Biogeographical archaeology in the eastern North American arctic, Human Ecology, 25, 385–418,1997.
Foley, J. A., Coe, M. T., Scheffer, M., and Wang, G.: Regime shifts in the Sahara and Sahel: interactions between ecological and cli-matic systems in northern Africa, Ecosystems, 6, 524–539, 2003. Foster, D. R.: Insights from historical geography to ecology and conservation: lessons from the New England landscape, J.