HAL Id: hal-00304799
https://hal.archives-ouvertes.fr/hal-00304799
Submitted on 1 Jan 2003HAL is a multi-disciplinary open access archive for the deposit and dissemination of sci-entific research documents, whether they are pub-lished or not. The documents may come from teaching and research institutions in France or abroad, or from public or private research centers.
L’archive ouverte pluridisciplinaire HAL, est destinée au dépôt et à la diffusion de documents scientifiques de niveau recherche, publiés ou non, émanant des établissements d’enseignement et de recherche français ou étrangers, des laboratoires publics ou privés.
A modelling assessment of acidification and recovery of
European surface waters
A. Jenkins, L. Camarero, B. J. Cosby, R. C. Ferrier, M. Forsius, R. C.
Helliwell, J. Kopácek, V. Majer, F. Moldan, M. Posch, et al.
To cite this version:
A. Jenkins, L. Camarero, B. J. Cosby, R. C. Ferrier, M. Forsius, et al.. A modelling assessment of acidification and recovery of European surface waters. Hydrology and Earth System Sciences Discussions, European Geosciences Union, 2003, 7 (4), pp.447-455. �hal-00304799�
A modelling assessment of acidification and recovery of
European surface waters
A. Jenkins
1, L. Camarero
2, B.J. Cosby
3, R.C. Ferrier
4, M. Forsius
5, R.C. Helliwell
4, J. Kopácek
6,
V. Majer
7, F. Moldan
8, M. Posch
9, M. Rogora
10, W. Schöpp
11and R.F. Wright
121CEH, Wallingford, Oxon OX10 8BB, UK 2CEAB-CSIC, 17300 Blanes, Girona, Spain
3Department of Environmental Science, University of Virginia, Charlottesville, VA 22901, USA 4Macaulay Institute, Craigiebuckler, Aberdeen, AB15 8QJ, UK
5Finnish Environment Institute, PO Box 140, FIN-00251 Helsinki, Finland 6Hydrological Institute AS CR, 370 05 Ceské Budejovice, Czech Republic 7Czech Geological Survey, Klarov 3, CZ 118 21, Praha 1
8Swedish Environmental Research Institute, S-402 58 Gothenburg, Sweden
9Coordination Center for Effects, RIVM/CCE, Box 1, NL-3720 BA Bilthoven, The Netherlands 10CNR Institute of Ecosystem Study, I-28922 Verbania Pallanza, Italy
11International Institute for Applied Systems Analysis, A-2361 Laxenburg, Austria 12Norwegian Institute for Water Research, Box 173 Kjelsås, N-0411 Oslo, Norway
Email for corresponding author: [email protected]
Abstract
The increase in emission of sulphur oxides and nitrogen (both oxidised and reduced forms) since the mid-1800s caused a severe decline in pH and ANC in acid-sensitive surface waters across Europe. Since c.1980, these emissions have declined and trends towards recovery from acidification have been widely observed in time-series of water chemistry data. In this paper, the MAGIC model was applied to 10 regions (the SMART model to one) in Europe to address the question of future recovery under the most recently agreed emission protocols (the 1999 Gothenburg Protocol). The models were calibrated using best available data and driven using S and N deposition sequences for Europe derived from EMEP data. The wide extent and the severity of water acidification in 1980 in many regions were illustrated by model simulations which showed significant deterioration in ANC away from the pre-acidification conditions. The simulations also captured the recovery to 2000 in response to the existing emission reductions. Predictions to 2016 indicated further significant recovery towards pre-acidification chemistry in all regions except Central England (S Pennines), S Alps, S Norway and S Sweden. In these areas it is clear that further emission reductions will be required and that the recovery of surface waters will take several decades as soils slowly replenish their depleted base cation pools. Chemical recovery may not, however, ensure biological recovery and further reductions may also be required to enable these waters to achieve the good ecological status as required by the EU Water Framework Directive.
Keywords: Europe, acid-sensitive, waters, predictions, recovery, protocols.
Introduction
The impact of acidic deposition on surface waters in Europe is well documented and understood (Grennfelt et al., 1995). This understanding has contributed to international legislation to reduce the emissions of sulphur (S) and nitrogen (N) which are responsible for the acidic deposition (Jenkins 1999; Bull et al. 2001). As a result of these agreements, the deposition of S has fallen dramatically across Europe and many surface waters have begun to
recover from acidification, as manifest by trends of decreased sulphate (SO4), increased pH and increased acid
neutralising capacity (ANC). The key issues that remain concern the timescale over which the recovery process will occur across Europe and the degree to which pre-acidification conditions will be reached. Both of these issues have significant implications for the review of the latest United Nations Economic Commission for Europe
A. Jenkins et al.
(UNECE) Protocol under the Convention on Long-range Transboundary Air Pollution (CLRTAP), the 1999 Gothenburg or Multi-Pollutant Multi-Effect Protocol (UNECE 2002), and for new legislation within the European Union (EU) relating to standards for fresh water quality, the Water Framework Directive (WFD).
This paper makes a European scale assessment, using the output from dynamic acidification models, MAGIC and SMART, applied to acid-sensitive surface waters, to determine the extent and time to recovery and the implications with respect to achieving good ecological status in these ecosystems.
Background
The CLRTAP was established in 1979 and in the last 24 years has adopted four protocols to reduce the emission of S and N to the atmosphere (Jenkins 1999; Bull et al. 2001). The first S Protocol was signed in 1985 and committed signatories to reduce S emission by 30% by 1993 relative to 1980 levels. The second S (Oslo) Protocol was signed in 1994 and committed the signatories to a total emission reduction of c.80% of 1980 levels by 2010, but with different targets for each country. This was the first Protocol to be guided by the critical loads concept (Hettelingh et al., 1995). The first N Protocol was signed in 1988 with an agreement to stabilise emissions at the 1987 level by 1994. Finally, the Multi-Pollutant, Multi-Effect (Gothenburg) Protocol was signed in 1999 with the aim of abating acidification, eutrophication and ground level ozone through emission ceilings for S, N and volatile organic compounds. If fully implemented by 2010, this would reduce S emissions across Europe by at least 63%, NOx by 41% and NHy by 17%,
relative to 1990 levels (UNECE 2002), which are already substantially reduced from the peak levels of the late 1970s and 1980s as a result of the earlier agreements.
In parallel with these Protocols, the EU has developed and passed legislation to reduce S emission from large sources under the Large Combustion Plant Directive (NEGTAP 2001). More recently, the EU has established the National Emission Ceilings Directive which limits national emissions of S, NOx, NH3 and Volatile Organic Compounds
(Skeffington, 2002). By 2010, the overall effect of this legislation is expected to be a reduction in S emission to 85% of the 1980 level from the EU countries and to 74% of the 1980 level from the whole of Europe (Ferrier et al., 2001).
The EU has also established a new structure for maintaining the quality of surface and groundwater, called the Water Framework Directive (WFD) (European Community 2000). The air pollution legislation and water
pollution legislation both will affect water quality in headwater lakes and streams that are sensitive to acidic deposition and where biological resources are degraded as a result of acidification. In this case, the WFD does not explicitly legislate to prevent pollution but expects measures to be adopted that have the effect of reducing the problem. The WFD has the stated purpose of establishing a framework for the protection of inland waters which prevents further deterioration and protects and enhances the status of aquatic ecosystems. The main objective is to achieve good ecological status by 2016 relative to a reference condition. Reference conditions and good status remain as yet undefined. With respect to acidification in small headwater lakes, a key indicator of ecological status is the presence or absence of a viable brown trout population.
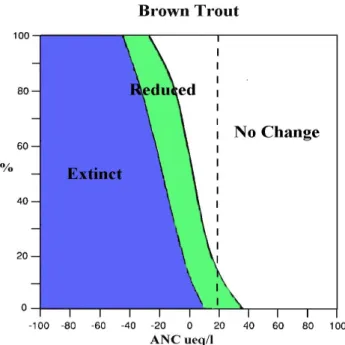
The dose-response relationships between water chemistry and damage to aquatic organisms are well-documented with respect to freshwater acidification. Key chemical parameters related to biological effects are pH and concentrations of inorganic aluminium, calcium (Ca) and ANC (calculated as the sum of base cations minus strong acid anions (Baker et al., 1987). This information has been used for calculating critical loads in Europe. The most widely used criterion is with respect to ANC, as both static and dynamic acidification models can be readily used to relate changes in acid deposition to changes in ANC in surface waters. Empirical relationships between ANC and fish population status have been developed for brown trout (Salmo trutta L.) and other species in Norway (Lien et al. 1992; Bulger et al. 1993; Lien et al. 1996). For brown trout in Norwegian lakes the probability of damage is < 10% if ANC > 20 µeq l-1 and is
50% if ANC < zero (Fig. 1). For the more sensitive species Atlantic salmon (Salmo salar L.), the critical limit is ANC 30 µeq l-1.
An acidification index for macro-invertebrates in Norway developed by Raddum and Fjellheim (1984) has been successfully applied in other regions in Europe (Raddum and Skjelkvåle 1995). For sites included in the ICP Waters database, the ANC limit suggested is 50 µeq l-1 in central
Europe, 30 µeq l-1 in the central Alps and 20 µeq l-1 in the
British Isles and Scandinavia (Skjelkvåle et al. 2000). In general, most organisms show a graded response to ANC rather than a step change and thus response curves can be fitted using logistic regressions. In this way, appropriate chemical targets can be defined to protect or establish a required biological status. For example, logistic regressions that describe the occurrence of the diatom Achnanthes minutissima; the macroinvertebrate Baetis rhodani; non-impoverished macroinvertebrate assemblages; number of mayfly species and the density of trout/salmonid populations in relation to surface water chemistry, in
Fig. 1. Brown trout population status in relation to surface water ANC for 827 lakes in Norway (after Lien et al., 1996). Note that the probability of damage to the fish population is < 10% at ANC 20 ueq l-1 and < 50% at ANC zero.
Table 1. Predicted biological status, in terms of the diatom A. minutissima (probability of occurrence), the mayfly B. rhodani
(probability of occurrence), number of mayfly species (number of taxa) and trout density (numbers per 100 m2) for given surface
water ANC concentration (meq l1), after Juggins et al., 1995.
ANC Probability of Number Trout occurrence of taxa density
100 0.01 0.03 0.02 5 50 0.06 0.09 0.04 9 20 0.17 0.18 0.06 12 0 0.30 0.28 0.08 14 20 0.48 0.39 1.1 17 50 0.74 0.59 1.8 23 100 0.95 0.85 4 37 200 0.99 0.99 19.4 94
particular ANC (Table 1), have been constructed from surveys undertaken in England, Scotland and Wales (Juggins et al., 1995) and elsewhere in Europe (Skjelkvåle et al., 2003). On the basis that critical loads for water considered in the existing protocols aim to protect brown trout, for evaluation purposes here, an ANC limit of 20 µeq l-1 was
used to indicate that the sites are capable of achieving the good ecological status as required by the WFD. With respect to other species, however, this ANC limit may not reflect good ecological status (Table 1).
Data sources
This analysis focused on acidified and acid-sensitive headwater lakes and streams in Europe as identified within the RECOVER:2010 and EMERGE projects (Table 2). The data used in this analysis are outputs from regional applications of the MAGIC model, except in Finland where the SMART model was used. MAGIC and SMART have been rigorously compared and found to be consistent in structure and output (Posch et al., 2003a). In all cases, the model applications used the best available soil physical and chemical data and were calibrated to match present-day observed water chemistry. Regional estimates of S deposition were adjusted to match observed S concentrations in surface water on a site-by-site basis (Table 3). Sulphur adsorption and de-sorption were not considered important processes affecting the current output flux of S in the regions modelled. Consistent deposition sequences from 1860 to 2020 (Schopp et al., 2003) were then used to scale the deposition through time.
These regional applications have been fully documented and discussed elsewhere: S Pennines, Wales and Galloway, SW Scotland (Helliwell et al., 2003), N Scotland (Helliwell, in press), Finland (Posch et al., 2003b), S Norway (Wright and Cosby, 2003a), Central Norway (Wright and Cosby, 2003b), S Alps (Rogora et al., 2003), Tatra mountains (Kopacek et al., 2003), Pyrenees (Camarero et al., in press), N and S Sweden (Moldan, et al., in press). The basis for this regional approach is that the physical and chemical catchment characteristics that mainly determine surface water chemistry are consistent for each group of lakes/ streams, e.g. bedrock geology, atmospheric deposition, climate. The regions are, therefore, of different sizes and characterised by different numbers of lakes/streams (Table 2). An assumption behind this European assessment was that the sites modelled in each region comprise a sample characteristic of the total population of lakes/streams.
In the UK, the surface water chemistry surveys in the S Pennines (undertaken in 1998) and Galloway (mean of surveys undertaken in 1996 and 1997) included all reservoirs and lakes in the regions, respectively. The Pennine reservoirs are more than 100 years old and most are not currently in use as water supplies (Evans et al., 2000). The water chemistry survey in Wales comprised 95 headwater streams sampled monthly during 1995 which enabled calculation of a reliable annual mean, but the sites were selected on the basis of accessibility and so are not necessarily repre-sentative of acid waters in the region. For N Scotland, the sites used are 30 headwater lochs, sampled during September-October 2000, that are representative of all lochs > 0.5 ha in the region.
A. Jenkins et al.
The 60 lakes in southern Norway are small, acid-sensitive headwater lakes, selected from the 1986 and 1995 Norwegian lakes surveys (Henriksen et al., 1988, Henriksen et al., 1997, Skjelkvåle et al., 2001). The lakes are characteristic of the majority of the several thousand lakes in the region. The 19 lakes in central Norway were selected for the EMERGE project (www.mountain-lakes.org) on the basis of the availability of biological data from previous investigations. These lakes are characteristic of acid-sensitive lakes in the region. Southern Norway received moderate levels (on a European scale) of acid deposition and the lakes in the region are highly acidified. Central Norway receives very low levels of acid deposition and the lakes in the region are only slightly acidified and thus serve as unpolluted references.
In the Tatra Mountains, 31 lakes were selected in the western part and central massive on the basis of a previous survey of water quality (Kopácek et al., 2000); the eastern part has no lakes. Of the total lake population in the district (138 perennial lakes > 0.01 ha), the selected 31 lakes were both regionally and morphologically representative for the alpine zone. The selected lakes included both seepage and drainage lakes and are all of glacial origin.
In the S Alps, only a small number of sites (three streams, ten alpine lakes) were used. These were chosen to be characteristic of the whole alpine and sub-alpine area in North-Western Italy. The sites have different sensitivities to acidification and reflect the geological complexity of the area, which is from igneous to carbonaceous rocks (Rogora et al., 2001).
In Finland, the sites were a subset of 36 of the 163 lakes in the Finnish acidification monitoring lake network
(RMLA; Forsius et al., 2003). The lakes are mostly small (median area = 10 ha), acid-sensitive, head water or seepage lakes and their catchments are forested and relatively undisturbed. These lakes were originally chosen subjectively by expert judgement for use in national acidification studies. The 36 lakes were sampled in 1987 and then annually since 1990.
In Sweden, 65 intensively monitored lakes were modelled in this study These are part of a national survey of water quality (Riksinventeringen, RI) started in 1972 (Bernes 1986) and repeated five times (Wilander et al., 1998). The monitoring programme was designed to represent all types of lakes that commonly occur in Sweden, especially with respect to TOC concentrations, acidity, size and geographical position (SNV, 1993).
In the Pyrenees, 85 lakes were sampled during the summer 2000. These were selected on the basis of altitudinal and lithologic distributions of the entire population of lakes in the Pyrenean range (Camarero et al., 2003). Typically, the lakes in the Pyrenees are located above the tree line, are relatively small and have short water renewal times. The majority of lakes are on acid sensitive catchments composed mainly of granites and granodiorites, but many lakes are located on carbonated, less sensitive rocks.
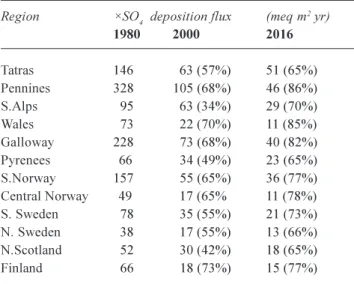
For predictions to 2016, the reduction in deposition of S, NOx and NH3 have been calculated (Table 3) using the
RAINS model on the 150 × 150 km EMEP grid (Schopp et al., 2003). These assume that the agreed reductions under the UN-ECE Protocols and EU legislation will be implemented and comprise the current legislation scenario (CLE) for 2010. The present day S deposition at each site in each region derived from the observed surface water Table 2. Regions modelled within the RECOVER:2010 and EMERGE projects. Sites are natural
lakes except where indicated. More details on each are given in the reference indicated.
Region No of Vegetation Reference
Sites
Tatra Mountains 31 Alpine Kopacek et al., 2003
S Pennines, England 59 Moorland (reservoirs) Helliwell et al., 2003
S Alps 13 Forest (streams) Rogora et al., 2003
Wales 95 Forest, moorland (streams) Helliwell et al., 2003
Galloway, S Scotland 54 Forest, heathland Helliwell et al., 2003
Pyrenees 85 Alpine Camarero et al., in press
S Norway 60 Forest, heathland Wright and Cosby, 2003
Central Norway 19 Forest heathland Wright and Cosby, in press
S Sweden 35 Forest, heathland Moldan et al., in press
N Sweden 30 Forest, heathland Moldan et al., in press
N Scotland 30 Heathland Helliwell et al., in press
Fig. 2. The 1860 model reconstructed surface water ANC concentration for each region expressed in 3 ANC classes. For Finland, the SMART model is used and this is initialised in 1960 and so no data are available.
Fig. 3. The 1980 (worst condition) model reconstructed surface
water ANC concentration for each region expressed in 3 ANC classes.
concentration was then reduced by the same percentage to 2010 (Table 3). Beyond 2010, deposition was assumed to remain constant.
Results
Background pre-acidification (1860) surface water ANC concentrations were in almost all cases above zero and predominantly above 20 µeq l-1 (Fig. 2). With the rapid
increase in emission and deposition of S and N from 1860 to 1980, the occurrence of acidic surface waters, indicated by ANC less than zero, became widespread in sensitive regions across the whole of Europe (Fig. 3). The dominant cause of this decline in ANC was the increase in SO4
concentration. By 2000, the effect of international agreements and European legislation has led to a reduction in SO2 emission of c.55% across Europe and this has led to
a similar reduction in S deposition (NEGTAP, 2001). These deposition reductions have been successful in promoting recovery from surface water acidification across Europe (Fig. 4). ANC in all regions was simulated to have increased over the last 20 years, a result in agreement with empirical evidence on trends in surface water recovery (Evans et al., 2001).
The model predictions to 2016 under the CLE scenario (Table 3) showed the potential benefit of the currently proposed reductions (Fig. 5). ANC concentrations in sensitive surface waters across most of Europe were predicted to recover and most waters reached levels above Table 3. Regional mean non-marine S deposition flux used in the
model simulations. Fluxes are in meq m2 yr1 and percent reduction
(shown in parentheses) is relative to 1980. 1980 and 2016 estimates are based on the deposition patterns derived for the relevant EMEP grid square (Schopp et al., 2003).
Region ×SO4 deposition flux (meq m2 yr)
1980 2000 2016 Tatras 146 63 (57%) 51 (65%) Pennines 328 105 (68%) 46 (86%) S.Alps 95 63 (34%) 29 (70%) Wales 73 22 (70%) 11 (85%) Galloway 228 73 (68%) 40 (82%) Pyrenees 66 34 (49%) 23 (65%) S.Norway 157 55 (65%) 36 (77%) Central Norway 49 17 (65% 11 (78%) S. Sweden 78 35 (55%) 21 (73%) N. Sweden 38 17 (55%) 13 (66%) N.Scotland 52 30 (42%) 18 (65%) Finland 66 18 (73%) 15 (77%) > 20 µeq L-1 0 - 20 µeq L-1 < 0 µeq L-1 1860 > 20 µeq L-1 0 - 20 µeq L-1 < 0 µeq L-1 1980
A. Jenkins et al.
Fig. 5. The 2016 model predicted surface water ANC concentration for each region expressed in 3 ANC classes.
20 µeq l-1. This does not imply, however, that these systems
have returned to their background conditions with respect to either chemical or biological characteristics.
At the Europe scale distinct patterns emerged from the model simulations through time. In the UK, the simulations indicated pre-acidification conditions with ANC generally above 20 µeq l-1. By 1980, after many decades of
significantly high levels of S deposition, severe acidification occurred across the whole country. By 2000, the signs of recovery were apparent and by 2016 it is only in the S Pennines that more than 10% of surface waters were predicted to be below zero ANC. The S Pennine region lies very close to major cities and local S deposition is extremely high (Table 3). Nevertheless, the deposition reductions by 2010 represent a very significant reduction from 1980 levels (6586%, Table 3) and the simulations indicated that the recovery of surface water ANC in the Pennines will be relatively rapid (a few decades from present).
In Scandinavia, acidification equally dramatic as that in UK situation was simulated between 1860 and 2000. Despite generally lower peak S deposition fluxes in 1980 but similar magnitude of deposition reduction to 2010 (6677%, Table 3), however, the predicted recovery by 2016 was not large. A significant proportion of surface waters were predicted to have ANC less than 20 µeq l-1, and in S Norway and S
Sweden ANC less than zero will still be widespread. This implies the need for additional deposition reductions and recovery may take much longer (several decades).
In the S Alps and the Tatras in central Europe the situation is very similar to Scandinavia; despite c. 65% reductions in S deposition from 1980 levels by 2010, significant
acidification was predicted to remain in 2016. In the Pyrenees, acidification has not occurred to a significant degree and ANC was predicted to be back at c.1860 levels by 2010.
Discussion
The ANC simulations for 1860 (pre-acidification condition) indicated that chemical conditions across Europe were generally suitable for supporting brown trout in nearly all cases ANC was greater than 20 µeq l-1. ANC 20 µeq l-1
can be used as a threshold for defining good status with respect to the WFD as well as a recovery target in terms of CLRTAP. The problem of generalising this as an indicator of a reference condition against which current status and future predictions can be assessed is that some waters had background predicted ANC below 20 µeq l-1 in particular in
the S Pennines, the Pyrenees, S Norway and the Tatra Mountains (Fig. 2). Low ANC may be due to the dilute nature of the water as a result of low rates of weathering and thin soils or from high concentrations of SO4 derived
from mineral weathering. The latter is almost certainly the cause in the Pyrenees where a significant contribution from weathering to SO4 concentrations has been identified at some
sites (Catalan et al., 1993). In S Norway and the Tatra Mountains, thin and organic-rich soils combined with low base cation weathering rates are the likely cause of the low background ANC levels. In the S Pennines, SO4 from
mineral weathering probably contributed to low background ANC levels.
A further problem in considering the simulated
Fig. 4. The 2000 observed surface water ANC concentration for each region expressed in 3 ANC classes.
> 20 µ eq L-1 0 - 20 µeq L-1 < 0 µ eq L-1 2000 > 20 µ eq L-1 0 - 20 µeq L-1 < 0 µeq L-1 2016
background condition as an indicator of a reference condition is that the pre-acidification biological status of many of these sites with respect to brown trout populations and other key indicator organisms is not known. The simulated water chemistry in 1860, however, should have been sufficient for brown trout although other hydromorphological, physical or chemical factors may have prevented them from being present.
By 1980, deposition of S reached a maximum and both observed and simulated surface water acidification was widespread and severe across all of Europe (Fig. 3). The simulated acidification agrees with reports of widespread acidification problems at that time in the UK, Scandinavia and Central Europe (e.g. Drablos and Tollan, 1980). In regions of Europe with substantial S deposition, more than 25% of sensitive waters had ANC below zero and would have been unlikely to support brown trout. The substantial changes from background levels imply, therefore, that fish populations had been damaged across wide areas. The extent of the problem around 1980 prompted the establishment of the CLRTAP and the initial negotiations for reductions in the emission of acidifying pollutants. There exists little or no monitoring data to verify the modelled decreases in ANC before 1980, but systematic observations that began in the late 1970s indicate severe acidification (e.g. Overrein et al., 1980). In addition, there exists a well established body of evidence from sediment core diatom reconstructions of surface water pH that indicate a severe acidification at many sites in these regions (e,g. Battarbee et al., 1990).
Between 1980 and 2000 there have been significant observed improvements in ANC of acidified surface waters in Europe (Stoddard et al., 1999; Evans et al., 2001) and these improvements were simulated by the model applications (Fig. 4). The improvements are largely in response to major decreases in S deposition in all regions (Table 3) and demonstrate the success of the policies and agreements already in place for reducing emission of acidifying compounds. It is also widely reported (Evans et al., 2001; Stoddard et al., 1999) that recovery in pH and Al have not always occurred in conjunction with the improved ANC and this may have consequences for the timescale of biological recovery. Significant acidity problems remain, however, in parts of the UK, Norway, Finland and the S Alps, where many waters have ANC below 20 µeq l-1. The
situation in these areas is significantly different from the reconstructed background or reference condition and so imply a significant departure from good status with respect to the WFD. Nevertheless, the rapid recovery from the 1980 worst case levels emphasises the benefits that may be achieved by making further reductions to 2010 under the existing agreements.
The model predictions for 2016, the key year with respect to achieving good status under the WFD, indicated that surface water acidification will be much less of a problem across most of Europe (Fig. 5). This assumes, of course, that the emission reductions agreed under the Gothenburg Protocol and existing and proposed EU legislation will actually be implemented by 2010. In Norway, Sweden, Finland, the S Alps and the S Pennines model predictions indicated that a significant percentage of waters will still have ANC less than 20 µeq l-1 and waters in these areas
remain significantly different from their simulated pre-acidification condition. In S Norway, there remains the issue that many lakes have background ANC less than 20 µeq l-1
and so it is not relevant to aim for improvement beyond that level. In general, however, there is clear need for further emission reductions to reduce deposition to these areas.
Sulphur is the the key driver of the acidification and now recovery of surface waters across Europe. Nitrogen is not considered here as it plays a secondary role in most regions, although as SO4 concentrations decrease, nitrate will become
increasingly important. The speed of change in surface water ANC, both in terms of acidification and recovery lies not only in the magnitude of change in S deposition but in the soil characteristics and weathering rates in the regions. The key process in catchments for neutralising acid inputs is the exchange of base cations from soils. This store of exchangeable cations (the product of cation exchange capacity, the base saturation percentage and the bulk density of the soil) is in turn mainly replenished by base cations supplied from weathering of soil minerals. The pool of exchangeable base cations can only recover when the S deposition decreases to below the critical load.
In soils with low rates of weathering of base cations, the base cation pool has been depleted as S deposition increased. The model simulations showed reduced % base saturation between 1860 and 1980 (Table 4). Between 1980 and 2016, the model results suggest that the large deposition reductions in all regions will be insufficient to increase % base saturation and in most regions the soil will continue to acidify. It is possible that the base saturation will recover over a much longer time period (several decades from present) at the lower level of S deposition but it is more likely that the restoration of the original base status of catchment soils will require further emission reductions and will take many decades. For surface waters, therefore, even after the S deposition flux is reduced, ANC will remain below pre-acidification levels until the soil base cation pool is replenished (cf. Reuss et al., 1987). In areas where the weathering rate is higher, the rate of recovery can be equally rapid as the rate of acidification, as exemplified in the S Pennines.
A. Jenkins et al.
Table 4. Model simulated regional median and 25 percentile values of soil % base saturation in 1860, 1980 and 2016.
Region 1860 1980 2016
(25%ile) Median (75%ile) (25%ile) Median (75%ile) (25%ile) Median (75%ile)
Tatras (14) 16 (18.5) (10.5) 11.5 (12.2) (10.5) 13.2 (13.7) Pennines (15.7) 18 (21) (11.2) 11.7 (12.2) (9.7) 10.2 (11) S.Alps (14) 22 (24) (10.2) 18.2 (20.5) (7.5) 9.5 (16) Wales (10.7) 14 (22.2) (7.2) 10.5 (15.7) (6.7) 9.5 (15) Galloway (8.7) 12 (17) (5.2) 6.5 (9.5) (4.2) 5.7 (8) Pyrenees (31.4) 43.4 (51.6) (21.9) 34.5 (43.4) (24.3) 38.1 (44.8) S.Norway (29) 35 (46) (26) 27 (36) (26) 29 (37) C Norway (20.5) 21.5 (22.5) (18.7) 20 (20.2) (18.7) 19.7 (20) S. Sweden (30) 36 (40) (21) 23 (29) (18) 21 (27) N. Sweden (29) 34 (39) (24) 28 (36) (21) 26 (35) N.Scotland (3.7) 6.5 (11.7) (2.7) 5 (10.7) (3.2) 5.5 (11.2) Finland (24) 39 (67) (21) 37 (67) (20) 36 (62)
If the acidification status of all European acid-sensitive surface waters is to be returned to levels which are capable of maintaining brown trout populations or another relevant indicator of similar sensitivity (= good ecological status), further reductions of S (and potentially N) emission will be required. These must encompass consideration of catchment soil characteristics, weathering rates, historical, present and future deposition in conjunction with a specified chemistry (ANC) target to be reached within a given timescale. Dynamic models such as MAGIC and SMART are currently capable of providing this assessment and model outputs are available for use in assessing the potential recovery in response to further emission reduction scenarios and in defining new emission reduction targets (Jenkins et al., 2002). Further assessments must also be capable of including the potential impact of other environmental drivers, such as climate change, which may have an impact on the recovery from acidification over the same time period (Skjelkvåle et al., 2002).
Acknowledgements
This work was funded by the Commission of the European Communities under the EMERGE (EVK1-CT-1999-00032) and RECOVER:2010 (EVK1-CT-1999-00018) projects. The work was also supported in part by the Natural Environment Research Council (UK), the UK Department of the Environment, Food and Rural Affairs (Contract No. EPG 1/3/194) ,the Scottish Executive Environment and Rural Affairs Department and the Norwegian Institute for Water Research. Work in the Pyrenees was also funded by CICYT (REN2000-0889/GLO).
References
Baker, J.P., Creager, C.S. and Christensen, S.W., 1987.
Identification of critical values for effects of acidification on fish populations. USEPA Project E5-25, Washington DC, 155pp.
Battarbee, R.W., Mason, J., Renberg, I. and Talling, J.F., 1990. Palaeolimnology and lake acidification. Phil. Trans. Royal Soc.,
Series B, 327, 223445.
Bernes, C., 1986. Sura och försurade vatten (Acid and Acidified
Waters). Statens Naturvårdsverk, Solna, Monitor 1986.
Bulger, A.J., Lien, L., Cosby, B.J. and Henriksen, A., 1993. Brown trout (Salmo trutta) status and chemistry from the Norwegian thousand lake survey: statistical analysis. Can. J. Fish. Aquat.
Sci., 50, 575585.
Bull, K.R., Achermann, B., Bashkin, V., Chrast, R., Fenech, G., Forsius, M., Gregor, H-D., Guardans, R., Haussmann, T., Hayes, F., Hettelingh, J.P., Johannessen, T., Krzyzanowski, M., Kucera, V., Kvaeven, B., Lorenz, M., Lundin, L., Mills, G., Posch, M., Skjelkvåle, B.L. and Ulstein, M.J., 2001. Co-ordinated effects monitoring and modelling for developing and supporting international air pollution control agreements. Wat. Air Soil Poll.,
130, 119130.
Camarero, L., Catalan, J., Ventura, M. and Wright, R.F., 2003. Application of MAGIC to Lake Redó (Central Pyrenees): assessment of the role of climate driven changes in weathering rates. J. Limnol. (in press).
Catalan, J., Ballesteros, E., Gacia, E., Palau, A., Camarero, L., 1993. Chemical composition of disturbed and undisturbed high mountain lakes in the Pyrenees: a reference for acidified sites.
Wat. Res., 27, 133141.
Drablos, D. and Tollan, A., 1980. Ecological Impact of Acid
Precipitation. SNSF Project, Oslo. 383pp.
European Community, 2000. Directive 2000/60/EC of the European Parliament and of the Council of 23 October 2000 establishing a framework for community action in the field of water policy. Official J. European Communities, L 327, 1.72. Evans, C.D., Jenkins, A. and Wright, R.F., 2000. Surface water
acidification in the South Pennines: I. Current status and spatial variability. Environ. Pollut., 109, 1120.
Evans, C.D., Cullen, J.M., Alewell, C., Kopácek,J., Marchetto, A., Moldan, F., Prechtel,A., Rogora, M., Veselý, J., and Wright, R.F. (2001) Recovery from acidification in European surface waters. Hydrol. Earth Syst. Sci., 5, 283297.
Ferrier, R.C., Helliwell, R.C., Cosby, B.J., Jenkins, A., and Wright, R. F., 2001. Lochs in the Galloway area, southwest Scotland, UK, show recovery from acidification 1979-1998. Hydrol. Earth
Syst. Sci., 5, 421431.
Forsius, M., Vuorenmaa, J., Mannio, J. And Syri, S., 2003. Recovery from acidification of Finnish lakes:regional patterns and relations to emission reduction policy. Sci. Tot. Environ.
310, 121132.
Grennfelt, P., Rodhe, H., Thornelof, E. and Wisniewski, J., (Eds.), 1995. Acid Reign 95? Water, Air Soil Poll., 85, 14. Helliwell, R., Jenkins, A., Ferrier, R.C. and Cosby, B.J., 2003b.
Modelling the recovery of surface water chemistry and the ecological implications in the British uplands. Hydrol. Earth
Syst. Sci. 7, 456466.
Helliwell, R.C. and Kernan, M.R., 2003a. Modelling hydrochemical and ecological trends in acid sensitive surface waters in the Scottish uplands. Measured and modelled trends in European mountain lakes. J. Limnol. (in press).
Henriksen, A., Lien, L., Traaen, T.S., Sevaldrud, I. and Brakke, D.F., 1988. Lake acidification in Norway present and predicted chemical status. Ambio, 17, 259266.
Henriksen, A., Skjelkvåle, B.L., Mannio, J., Wilander, A., Jensen, J.P., Moiseenko, T., Harriman, R., Traaen, T.S., Fjeld, E., Vuorenmaa, J., Kortelainen, P. and Forsius, M., 1997. Results
of national lake surveys 1995 in Finland, Norway, Sweden, Denmark, Russian Karelia, Scotland and Wales. Acid Rain
Research Report 47/1997, NIVA Report SNO 3645-97, Norwegian Institute for Water Research, Oslo, 43pp.
Hettelingh, J-P., Posch, M., de Smet, P.A.M. and Downing, R.J., 1995. The use of critical loads in emission reduction agreements in Europe. Water Air Soil Pollut., 85, 23812388.
Jenkins, A., 1999. End of the acid reign? Nature, 401, 537538. Jenkins, A., Larssen, T., Moldan, F., Posch, M. And Wright, R.F.,
2002. Dynamic Modelling of Surface Waters: Impact of Emission
Reduction possibilities and limitations. ICP-Waters Report
70/2002, NIVA, Oslo, 42pp.
Juggins, S., Ormerod, S.J. and Harriman, R., 1995. Relating critical loads to aquatic biota. In: Critical Loads of Acid Deposition for
UK Freshwaters. Department of the Environment, London.
Kopácek, J., Stuchlik, E. Strakrabová, V. and Penáková, P., 2000. Factors governing nutrient status of mountain lakes in the Tatra Mountains. Freshwater Biol., 43, 369383.
Kopácek, J., Cosby, B.J., Majer, V., Stuchlik, E. and Vesely. J., 2003. Predicting the reversibility of Central European mountain ecosystems from acidification with the MAGIC model: II The Tatra Mountains. Hydrol. Earth Syst. Sci., 7, 510524. Lien, L., Raddum, G.G. and Fjellheim, A., 1992. Critical loads of
acidity to freshwater fish and invertebrates. Naturens
Tålegrense Fagrapport 23, Norwegian Institute for Water Research, Oslo, 36pp.
Lien, L., Raddum, G.G., Fjellheim, A. and Henriksen, A., 1996. A critical limit for acid neutralizing capacity in Norwegian surface waters, based on new analyses of fish and invertebrate responses.
Sci. Total Environ., 177, 173193.
Moldan, F., Kronnäs, V., Wilander, A., Karltun, E. and Cosby, B.J., 2003. Modelling acidification and recovery of Swedish lakes. Wat. Air Soil Pollut., Focus (in press).
NEGTAP, 2001, Transboundary Air Pollution: Acidification,
Eutrophication and Ground-Level Ozone in the UK. DEFRA,
London. 314pp.
Overrein, L., Seip, H.M. and Tollan, A. (1980) Acid Precipitation Effects on Forest and Fish. Final Report of the SNSF Project,
1972-1980. Oslo, Norway.
Posch, M., Hettelingh, J.-P. and Slootweg, J., (Eds.), 2003a.
Manual for dynamic modelling of soil response to atmospheric deposition. Report 259101012/2003. WGE ICP-M&M
Coordination Center for Effects, Bilthoven, The Netherlands.
Posch, M., Forsius, M., Johansson,M., Vuorenmaa, J. and Kämäri, J., 2003. Modelling the recovery of acid-sensitive Finnish headwater lakes under present emission reduction agreements.
Hydrol. Earth Syst. Sci., 7, 484493.
Raddum, G.G. and Fjellheim, A., 1984. Acidification and early warning organisms in freshwater in western Norway. Verh.
Internat. Verein. Limnol., 22, 19731980.
Raddum, G.G. and Skjelkvåle, B.L., 1995. Critical limits of acidification to invertebrates in different regions of Europe.
Water Air Soil Pollut., 85, 475480.
Reuss, J., Cosby, B.J. and Wright, R.F., 1987. Chemical processes governing soil and water acidification. Nature, 329, 27-32. Rogora, M., Marchetto, A. and Mosello, R., 2001. Trends in the
chemistry of atmospheric deposition and surface waters in the Lago maggiore watershed. Hydrol. Earth Syst. Sci., 5, 379390. Rogora, M., Marchetto, A. and Mosello, R., 2003. Modelling the effects of the deposition of acidity and nitrogen on selected lakes and streams in central Alps (Italy). Hydrol. Earth Syst.
Sci., 7, 540551.
Schöpp, W., Posch, M., Mylona, S. and Johansson, M., 2003. Trends in acid deposition (1880-2030) for sensitive freshwater regions in Europe. Hydrol. Earth Syst. Sci., 7,436446. Skeffington, R., 2002. European nitrogen policies, nitrate in rivers
and the use of the INCA model. Hydrol. Earth Syst. Sci, 6, 315 325.
Skjelkvåle, B.L., Andersen, T., Halvorsen, G.A., Heegaard, E., Stoddard, J.L. and Wright, R.F., 2000. The 12-year report:
Acidification of surface water in Europe and North America; trends, biological recovery and heavy metals. ICP Waters report
52/2000, Norwegian Institute for Water Research, Oslo. 108pp. Skjelkvåle, B.L., Mannio, J., Wilander, A. and Andersen, T., 2001. Recovery from acidification of lakes in Finland, Norway and Sweden 1990-1999. Hydrol. Earth Syst. Sci, 5, 327338. Skjelkvåle, B.L., Evans, C.D., Larssen, T., Hindar, A. and Raddum,
G.G., 2002. Recovery from acidification in European surface waters: A view to the future. Ambio, 32, 170-175.
Skjelkvåle, B.L.(Ed.), 2003. DRAFT 15-year report: Assessment
and monitoring of surface waters in Europe and North America; acidification and recovery, dynamic modelling and heavy metals.
ICP Waters Report 73/2003. Norwegian Institute for Water Research, Oslo. 112pp.
SNV, 1993. Svensk nationell miljöövervakning. (Swedish National
Environmental Monitoring Programme). Program antaget av
Naturvårdsverkets miljöövervakningsnämnd, 7 juni 1993. SNV Rapport 4275 (in Swedish).
Stoddard, J., Jeffries, D.S., Lukewille, A., Clair, T., Dillon, P.J., Driscoll, C.T., Forsius, M., Johannessen, M., Kahl, J.S., Kellog, J.H., Kemp, A., Mannio, J., Monteith, D., Murdoch, P., Patrick, S., Rebsdorf, A., Skjelkvåle, B.L., Stainton, M.P., Traaen, T., van Dam, H., Webster, K., Wieting, J. and Wilander, A., 1999. Regional trends in aquatic recovery from acidification in North America and Europe. Nature, 401, 575578.
UNECE, 2002. http://www.unece.org/env/lrtap/
Wilander, A., Johnson, R., Goedkoop, W. and Lundin, L., 1998.
National surface water survey: A synoptic study of water chemistry and benthic fauna in Swedish lakes an streams (in
Swedish with English summary). Swedish Environment Protection Agency Report 4813.
Wright, R.F. and Cosby, B.J., 2003a. Future recovery of acidified lakes in southern Norway predicted by the MAGIC model.
Hydrol. Earth Syst. Sci., 7, 467483.
Wright, R.F. and Cosby, B.J., 2003b. Recovery of acidified mountain lakes in Norway as predicted by application of the MAGIC model. J. Limnol. (in press).