The Development Of A Simulation Model To Determine Plant
Capacity And Production Variability
by John R. Souza
B.S. Chemical Engineering, University of Pennsylvania, 1989 B.S. Economics, University of Pennsylvania, 1989
Submitted to the Sloan School of Management and to the Department of Chemical Engineering in Partial Fulfillment of the Requirements for the Degrees of
Master of Science in Management and
Master of Science in Chemical Engineering at the
Massachusetts Institute of Technology June 1997
@ 1997 Massachusetts Institute of Technology
Signature of Author
Sloan School of Management Department of Chemical Engineering Certified by
Gabriel R. Bitran Nippon Telephone and Telegraph Professor of Management Certified by_
Paula Hammond / Professor of Chemical Engineering
Accepted by Larry Aben
Larry Abeln Director of Master's Program -Sloan School of Management.
Accepted by
-Robert E. Cohen St. Laurent Professor of Chemical Engineering
S ci' ::Chairman, Committee on Graduate Students
The Development Of A Simulation Model To Determine Plant Capacity
And Production Variability
by John R. Souza
Submitted to the Sloan School of Management and to the Department of Chemical Engineering in Partial Fulfillment of the Requirements for the Degrees of
Master of Science in Management and Master of Science in Chemical Engineering
ABSTRACT
AlliedSignal's Hopewell plant produces caprolactam, the raw material for Nylon-6. Hopewell supplies caprolactam to many downstream businesses. However, over the past five years, the plant has not been able to meet the demands of these internal customers. Caprolactam shortfalls have caused yearly business plans to go unmet, negatively
impacting profitability by millions of dollars. More realistic business plans have not been developed in part because the production capacity and variability of Hopewell are not well understood.
The demands on Hopewell will only increase over time as the Polymers division pursues aggressive growth targets. However, significant increases in caprolactam production will require excessive amounts of capital, most likely beyond what will be made available to the plant. Hopewell thus needs to allocate its resources wisely so that it can reliably support the demands of the AlliedSignal nylon system.
This thesis examines the development of a simulation model to assist in the development of business plans and the optimization of capital allocation. Specifically, it:
* determines production capacity and variability through the creation of a production probability distribution
* serves as a tool to evaluate the ultimate impact on caprolactam production resulting from projects designed to improve the reliability and/or capacity of one or more of Hopewell's various production areas
Causes of variability and capacity limitations are explored for each of the individual production areas. However, the plant must be evaluated as a system rather than a collection of independent parts. The model incorporates this information from the individual production areas into a total system analysis.
Thesis supervisors:
Professor Gabriel Bitran, MIT Sloan School of Management
ACKNOWLEDGMENTS
I would like to thank AlliedSignal, Inc. for sponsoring this work and supporting the Leaders for Manufacturing Program at MIT. In particular, I appreciate all the efforts by Jeff Wilke to make my time at AlliedSignal as fruitful and enjoyable as possible. I also thank all the people at Hopewell who assisted me in my work.
I wish to acknowledge the Leaders for Manufacturing Program for its support of this work. Also, I would like to thank Professors Gabriel Bitran and Paula Hammond for their input and flexibility.
Finally, I am grateful to all my classmates for making my time at MIT not only educational, but also extremely enjoyable.
TABLE OF CONTENTS
Title Page ...
Abstract... ... 3
Acknow ledgm ents ... 5
Table of Contents... 7
List of Figures ... 9
List of Tables ... 10
1. Thesis Overview ... 11
1.1 Business background... ... 11
1.2 Business environm ent ... ... 11
1.3 Objectives... 12 2. Caprolactam System ... ... 13 2.1 W hat is caprolactam ? ... ... . . . . ...... 13 2.2 V alue chain... 13 2.3 H opewell plant ... ... 14 2.3.1 Background ... 14 2.3.2 Production history ... ... 15
2.3.3 Capital spending during the past two decades... ... 16
2.3.4 Production process ... ... 16
2.3.5 Organization ... ... 17
2.4 System m anagem ent issues ... 18
2.4.1 Evolution of supply/dem and im balance ... 18
2.4.2 Business planning problem s ... 18
3. Business Clim ate ... ... 21
3.1 Basis of com petition... ... 21
3.2 Growth dem ands ... ... 21
3.3 Accountability ... ... 21
3.4 Organizational changes ... 22
4. Current Status of Hopewell ... 23
4.1 Pressures on Hopewell ... 23
4.1.1 Support growth in downstream businesses ... ... 23
4.1.2 Capital constraints ... ... 23
4.1.3 Risk assessment of business plans ... ... ... 24
4.2 Shift toward a proactive, systems perspective... ... 25
4.2.1 Bottleneck analysis... ... 25
4.2.2 Risk and variability recognition ... ... 26
4.2.3 Past efforts in m odel developm ent ... .... ... 29
4.2.4 Initiation of a coordinated long-term strategy ... 33
5. Sim ulation M odel... 35
5.1 Purpose... 35
5.1.2 Enable better business planning ... ... . ... 35
5.1.3 Optimize resource allocation... 36
5.2 Description ... ... 37
5.3 Scope ... 38
5.4 Data ... 40
5.5 How the model works ... ... 47
6. Refinement of the model ... ... 51
6.1 Need for accuracy... ... 51
6.2 Iterative process to ensure accuracy ... 51
6.3 Challenges in attaining accurate data ... 54
7. M odel Output ... 57
7.1 Capacity/variability determination ... ... 57
7.2 Effect of additional Area 9 turnarounds ... 58
7.3 Capacity expansion scenarios... 59
7.4 Other applications ... ... 60
8. Other Insights/Benefits... 61
8.1 Impact of interactions between production areas ... .... 61
8.2 Buffer analysis... 62
8.3 Improved understanding of area capacities and sources of unreliability... 63
9. Recommendations ... ... 65
10. Bibliography ... 67
LIST OF FIGURES
Figure 2.1 AlliedSignal Nylon System... 14
Figure 2.2 Hopewell Production History... 15
Figure 2.3 Simplified Hopewell Production Process ... 17
Figure 4.1 Caprolactam Capacity According to Hydrox 800 Team... 26
Figure 4.2 Maximum Monthly Production by Year ... 27
Figure 4.3 Determination of Variability ... ... 28
Figure 4.4 Cumulative Probability Curves (Based on Historical Data) ... 29
Figure 4.5 Area 9 Simplified Process Diagram... ... 30
Figure 5.1 Hopewell Model Scope... 39
Figure 7.1 Cumulative Probability Curve for Hopewell Caprolactam Production ... 57
LIST OF TABLES
Table 4.1 Area 9 Nitrite Reliability Events ... ... 31 Table 8.1 Comparison of Area Capacity to Overall Capacity ... 61
1. Thesis Overview
1.1 Business background
AlliedSignal, Inc. is composed of the Aerospace, Automotive, and Engineered Materials sectors. This thesis concerns the Polymers division of the Engineered Materials Sector. In 1996, Polymers' revenue was $1.7 billion. Most of this revenue came from the sale of Nylon-6 derived products by the following businesses: Carpet Fibers, Industrial Fibers, and Engineering Plastics.
The raw material for the Nylon-6 polymer is caprolactam (also known as lactam), produced at the Hopewell, Virginia plant. Over time, the demand for caprolactam has grown beyond the productive capacity of Hopewell. Because the Hopewell plant is a complicated system involving several interacting production areas, this shortfall has not been well enough understood to be fully incorporated into the business plans for the downstream business units. Significant lactam production variability, due to several sources of unreliability, compounds this problem. As a result, there have been short term supply crises, forcing the undesirable situation of having to determine which nylon businesses and customers to short. Yearly shortfalls from planned production have also occurred, negatively impacting Polymers' profitability by millions of dollars. Positive outgrowths of these problems have been: the tendency toward a systems perspective of Hopewell in order to better understand capacity, a recognition of the need to improve the quality of information used in business planning, and an effort to develop a long term strategy for the plant. The simulation model resulting from this research project is intended to assist in each of these efforts.
1.2 Business environment
Growth has become a central objective at AlliedSignal; it is demanded of all businesses. For the Polymers businesses, revenue growth and success in meeting the business plans depend on the ability of Hopewell to reliably supply increasingly larger amounts of lactam.
A major expansion of the plant would cost tens of millions of dollars. In addition, the Hopewell plant faces increasing capital demands for environmental projects,
maintenance, and reliability upgrades. Yet, as the case has been for several years, the plant faces limited capital availability. Thus, it is critical to ensure optimal allocation of capital at Hopewell.
1.3 Objectives
This thesis examines the development of a simulation model during the fourth quarter of 1996 to accomplish the following:
* Evaluate the entire Hopewell lactam system in order to determine the probability distribution describing lactam production capacity. This
distribution can be used to understand the risk involved in the business plans for the downstream SBUs.
* Determine the sources of unreliability throughout the various production areas.
* Provide guidance on how to best allocate resources (capital and people) to increase Hopewell's production capacity and reliability. Also, the model provides a tool enabling comparison of capacity increase versus reliability improvement opportunities.
Note: In this thesis, the capacity numbers cited as output from the model have been disguised so as to protect proprietary information. The historical production data is public information and is thus not modified, but the results of the analysis of current capability have been changed to prevent public access to this data.
2. Caprolactam System
2.1 What is caprolactam?
Caprolactam, also referred to as lactam throughout this document, is a specific molecule, the basis for the Nylon-6 polymer. The lactam monomer is a cyclic molecule, given its reactive properties by adjacent NH and CO groups (the rest of the ring is carbon/hydrogen based). One caprolactam molecule can be reacted with another, with a CO-N bond forming and the ring opening up so that a long chain polymer (Nylon-6) can be formed as this process is repeated with other monomer molecules [6]. The caprolactam product from Hopewell is this monomer at a given quality (specific allowable levels of impurities).
2.2 Value chain
The AlliedSignal nylon system value chain is described in Figure 2.1. The company is almost completely vertically integrated, from the raw material for lactam to products made from the nylon polymer. Several AlliedSignal plants comprise the nylon value chain in United States, geographically located in the eastern states.
Figure 2.1 AlliedSignal Nylon System
Phenol
(Frankford, PA)
Purchased
Caprolactam
Caprolactam
(Hopewell, VA)
(Chesterfield, VA
Nylon Polymerand
Columbia,
SC)
Textile Nylon
Carpet Fibers
Industrial Nylon
Engineering Plastics
Specialty Films
Some caprolactam is purchased from external sources. Purchased lactam is acquired through contracts and spot purchases. Spot purchases come from international sources and must be coordinated months in advance; thus, caprolactam shortages must be identified well ahead of time.
2.3 Hopewell plant
2.3.1 Background
The Hopewell site and facilities are certainly not new. The site was first used in 1915 as a Dupont munitions plant. In 1928, Atmospheric Gas established a synthetic ammonia plant. In 1954, AlliedSignal entered the nylon business and expanded the facility to produce caprolactam at Hopewell. The plant now employs over 1000 people and is the world's largest producer of caprolactam. The site also produces more ammonium sulfate (a caprolactam co-product) than any other plant.
14
2.3.2 Production history
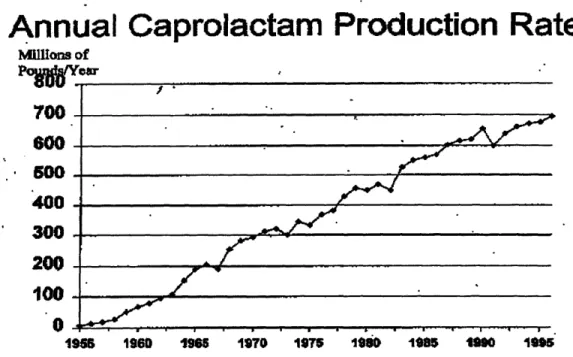
Since caprolactam production began at Hopewell, annual production rates have steadily climbed, averaging a 17 million pound increase per year (see Figure 2.2). By the mid-70's, production had reached 350 million pounds per year; this yearly amount has doubled over the past twenty years as annual caprolactam production rates have now reached 700 million pounds per year. Although this type of improvement now only represents a 2-3% yearly increase in production, attaining these gains is difficult.
Figure 2.2 Hopewell Production History
Annual Caprolactam Production Rates
Millions of Poo/Year
700
300200
100
198 1960 1965 1970 1975 1980 985 1990 1995The increased lactam production has been accompanied by increased production and sales of co-products and products derived from intermediate chemicals in the lactam
production process. This is perhaps most evident in the agricultural fertilizer ammonium sulfate, as approximately four pounds of this product are produced for each pound of purified caprolactam.
2.3.3 Capital spending during the past two decades
The facilities for caprolactam production have been in place at Hopewell for over 40 years. In each year since 1980, depreciation has far exceeded replacement/maintenance spending. Over this time, cumulative depreciation less replacement/maintenance spending has equaled total investment at Hopewell. This suggests that for plant equipment to be brought up to its 1980 reliability level, additional funds equaling total investment from 1980 to 1995 would have to be spent on replacement/maintenance.
It has certainly not been the case that no capital has been spent at Hopewell. Various expansion investments have enabled a greater than 50% increase in yearly production since 1980. However, the yearly capital allocation for the plant has been fairly constant. The increase in expansion spending has taken money away from reliability needs. This history has resulted in a plant pushed to its production limits, coping with elevated reliability risk.
2.3.4 Production process
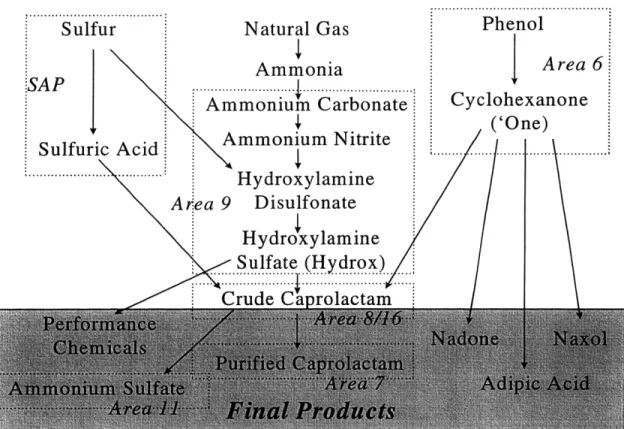
There are few major raw materials (sulfur, natural gas, and phenol) in the lactam production process. However, the overall process is very complex, with several intermediate chemicals produced and several different production areas interacting in order to create the lactam molecule. Figure 2.3 depicts a simplified version of the lactamrn production process. The basic operations occurring at each step are reaction and
separation/purification (through processes such as crystallization, distillation, and extraction).
Figure 2.3 Simplified Hopewell Production Process
Sulfur Natural Gas
Ammonia
SA P
I
...Ammonium Carbonate
Sulfuric Acid
Ammonium NitriteSulfuric Acid:
Hydroxylamine
Area 9 Disulfonate
Hydroxylamine Sulfate (Hydrox) .. Crude Carolactam
Crude Carolactam
Phenol
Area 6
Cyclohexanone ('One)
As figure 2.3 illustrates, five other final products result from the lactam process.
Ammonium sulfate is a co-product, with a certain amount produced per pound of lactam. Ammonium sulfate production could impact lactam production if all the crude
ammonium sulfate cannot be processed and the crude ammonium storage tanks fill to capacity. This would curtail crude caprolactam production. The other final products impact caprolactam production differently; they take intermediate chemicals ("hydrox" or "'One") away from lactam production. Thus, increased production and sales of these products could limit the availability of intermediate materials for lactam production.
2.3.5 Organization
The Hopewell organization is aligned along the process flow as described in Figure 2.3. The production units central to the caprolactam process, Areas 9 (ammonium carbonate through hydrox), 8/16 (crude caprolactam), and 7 (lactam purification) report to one manager, with the remaining areas reporting to a different manager. In each production area, there is generally one to two process engineers responsible for process monitoring,
troubleshooting, and process improvements. Each production area has its own operations staff and operations supervision.
2.4 System management issues
2.4.1 Evolution of supply/demand imbalance
Through 1991, Hopewell was a net seller of lactam. However, lactam shortages have resulted since early 1992 despite the continued increase in lactam production, as fibers and plastics sales growth (and associated lactam demand) in the downstream business units has outpaced the growth in caprolactam production. The annual difference between
downstream SBU demand and Hopewell supply has approached 100 million pounds.
This shortfall has been somewhat offset by market purchases of lactam. Contracts with domestic producers provide a reliable supply source and make up over half the difference. Additional needs are met at times by purchases on the spot market. However, these suppliers are mainly located in Eastern Europe or the former Soviet Union.
Transportation times are therefore significant and purchases must be arranged two to three months in advance of the need.
2.4.2 Business planning problems
Total yearly caprolactam demand for the AlliedSignal nylon system is determined by summing the demands from the downstream SBUs. This total is then used to budget a certain production amount from Hopewell and to plan for contract and spot purchases. The budgeted Hopewell production level has typically represented a "stretch goal" for the plant. Over the last four to five years, the Hopewell business plan has at times not been met. Short term supply crises have resulted from reliability problems at Hopewell. Longer term shortages have also occurred, as yearly production has fallen short of budgeted amounts.
Contract and emergency supplies (re-melt of flake lactam at Hopewell) are not sufficient to compensate for major short term supply crises at Hopewell. Inventory in the lactam
system is on the order of just a few days. The reliability of Hopewell is such that normally one or more of this type of crisis events occurs per year. When such an event happens, not all nylon customer obligations can be met and decisions on allocations must be made. Customers put on allocation often cannot obtain product from other producers on such short notice. Obviously, this damages customer relationships and impacts the profits of the nylon system SBUs.
The difficulty in understanding yearly Hopewell capacity results in longer term production shortfalls. When these shortages occur, Polymers must decide whether to pursue spot purchases. This is an economic decision; the price of purchased lactam is far greater than the cost of making it at Hopewell. Only those end uses that can justify the marginal cost of purchased lactam will be satisfied. These long term shortfalls therefore impact total nylon system sales and margins and therefore the ability of Polymers to meet yearly profitability targets. Millions of dollars in profits have been lost due to yearly lactam shortfalls.
3. Business Climate
3.1 Basis of competitionThe AlliedSignal nylon system competes mainly on cost. In general, caprolactam for Nylon-6 is less costly to make than the raw materials for the competing Nylon-6,6 technology. In addition, Hopewell makes lactam extremely cheaply compared to all Nylon-6,6 and Nylon-6 competitors.
Throughout the downstream SBUs, especially the fibers businesses, much of the equipment and technology is old, but conversions costs are competitive. Quality differences vary among products. However, AlliedSignal is somewhat behind industry leaders (such as Dupont) in maximizing prices through product branding. Furthermore, in many product markets, Nylon-6,6 sells at a premium to Nylon-6. Thus, AlliedSignal's competitive advantage stems from low cost production, due in large part to the cost efficiency of Hopewell.
3.2 Growth demands
AlliedSignal requires revenue and income growth from all of its sectors. To contribute to this objective, Polymers is demanding significant growth from each SBU. The total Polymers target revenue growth is greater than 15% in 1997 and totals more than 75% over four years. Most of Polymers' revenue and income is from caprolactam based products, so this corresponds to significant additional lactam demand.
3.3 Accountability
Accountability is central to the AlliedSignal culture. In general, plans must be met and excuses are not tolerated. The company is not shy about removing individuals from the organization if performance is not up to standards. This aspect of the AlliedSignal culture is relevant to this thesis in that the caprolactam shortfalls over recent years have caused some tension and a sense of urgency and insecurity at Hopewell. This impacted the ability to obtain accurate capacity information.
3.4 Organizational changes
Polymers has been an organization in flux. Whereas past and impending re-organizations and layoffs have not greatly affected Hopewell, they have contributed to a general
realization that job security is not guaranteed. These changes have also perhaps contributed some chaos to the business planning process.
4. Current Status of Hopewell
4.1 Pressures on Hopewell
4.1.1 Support growth in downstream businesses
As previously described, Polymers is targeting approximately 15% revenue growth in 1997 and 75% growth through 2000. These increases do not directly correspond to the additional amount of lactam needed, as some of the growth will result from shifting lactam to higher price, higher margin products. Yet, yearly lactam demand could still jump by 100 to 200 million pounds (representing an increase of as much as 25%).
Due to the large required lead times, spot market lactam is too unwieldy to make up much of this expansion. The contract purchase market may soon be disappearing. These
concerns, combined with the poor economics of purchased lactam, make it important to supply the increased demand internally. The most likely and cost-effective vehicle to do this is Hopewell (as opposed to building a new facility). Yet, the plant has been running full out; significant increases in production would suggest a major expansion, upgrading plant infrastructure and increasing the capacity and reliability of all the production areas.
4.1.2 Capital constraints
The major barrier standing in the way of augmenting capacity is capital availability. Huge amounts of capital will be required; the estimated funds required over the next three years just to maintain the current capacity and reliability are equal to the total investment in the plant from 1980 through 1995.
About one third of this anticipated investment is to improve environmental performance, and therefore would contribute little to increasing capacity and reliability. This is not a new issue, as over the last decade a substantial portion Hopewell's capital expenditures have targeted environmental performance, in response to legislation such as the Clean Air Act. However, the magnitude of these impending expenditures raise doubts about how much more capital will be available to maintain or improve plant capabilities. The
anticipated difficulty in securing these funds makes it necessary to construct a detailed need hierarchy, with the various proposed projects judged on an accurate assessment of the ultimate impact on overall Hopewell capacity and reliability.
Expanding plant capacity will cost an additional several million dollars. Large increases will not come cheaply, as all production areas must be expanded. Since 1985, increases in plant capacity have been relatively inexpensive because some production areas had significant excess capacity. This is no longer the case.
4.1.3 Risk assessment of business plans
The inability of Hopewell to meet budgeted production in recent years has demonstrated that these business plans have had a high degree of associated risk. As production increases further, even if the variability to total production ratio can be held constant or reduced (which is itself an ambitious target, as inventory capacity in terms of days will fall and the entire system will be operating at higher velocity), variability in terms of pounds and dollar revenue is likely to grow. This means greater risk manifest in the probability of even greater deviations from business plans.
On the surface, the difference between Hopewell making 700 and 710 million pounds in a year seems small. However, the impact on Polymers is great; such a difference would represent incremental net income of millions of dollars. Therefore, it is important to not only recognize risk, but accurately quantify it.
Understanding the probability distribution describing Hopewell capacity would allow Polymers to select an appropriate amount of risk. For example, whereas recent business plans seem to have been dependent on Hopewell production levels that the plant had approximately a 50 percent probability of meeting or exceeding in a given year, Polymers management has expressed the desire to construct business plans that Hopewell would have a 90 percent chance of meeting. Understanding the Hopewell probability
distribution would also enable risk to be further reduced by ensuring that contract and spot purchases are properly anticipated and executed. Contingency plans for caprolactam
production in excess of planned amounts could also be devised, ensuring that if Hopewell falls at the high end of its distribution, plans would be in place to optimally distribute and maximize the value from this additional lactam.
4.2 Shift toward a proactive, systems perspective
In response to the pressures to increase production and reliability and the difficulties that Hopewell has experienced over the past few years fulfilling Polymers' needs, Hopewell management has developed a more long term, analytical, data driven approach. This began with identification and evaluation of the plant's bottleneck, progressed to attempts to estimate variability and risk, and continued with the initiation of long term strategy development.
4.2.1 Bottleneck analysis
By 1995, hydrox production in Area 9 had been identified as the plant's bottleneck. Thus, Hopewell commissioned a Hydrox 800 team to investigate capacity restrictions and determine how to expand Area 9 capacity to 800 million pounds of equivalent lactam (the amount of hydrox which would enable the production of 800 million pounds
caprolactam). Note: In reality, this would enable Hopewell to produce 750 million pounds caprolactam, as 50 million pounds of equivalent lactam are lost through
Performance Chemicals' consumption of hydrox (Figure 2.3 shows this use of hydrox). The Hydrox 800 team identified ammonium nitrite (hereafter referred to as nitrite) and hydroxylamine disulfonate (hereafter referred to as disulfonate) capacity as limiting hydrox production. In addition to identifying specific capacity constraints in the production of these two chemicals, the team also determined that the plant bottleneck moved within Area 9 as ambient temperature changed. During summer months, nitrite capacity was severely limited. During cooler months, disulfonate capacity was thought to be the restriction. Figure 4.1 presents the team's findings. The thick line is the minimum of nitrite and disulfonate capacities, representing the overall capacity by month.
Figure 4.1 Caprolactam Capacity According to Hydrox 800 Team
Mlbs/yr
780
7
7
0 •
Nitrite
760
Disulfonate
capacit
750
750
ca
acity
740730
720 710 Area 9700
capacity
890680
670 2L <5
<
Q Z 04.2.2 Risk and variability recognition
The Hydrox 800 team took some important first steps in bottleneck analysis. However, capacity could still only be referred to as a specific number. The need to quantify variability and understand risk still remained. In preparation for the development of the
1996 business plans, the operations manager (OM) of Areas 9, 8/16, and 7 made progress here by analyzing historical caprolactam production rates. Hopewell was to be asked to produce 710 million pounds of caprolactam in 1996; the OM attempted to determine the plant's chances of meeting these goals.
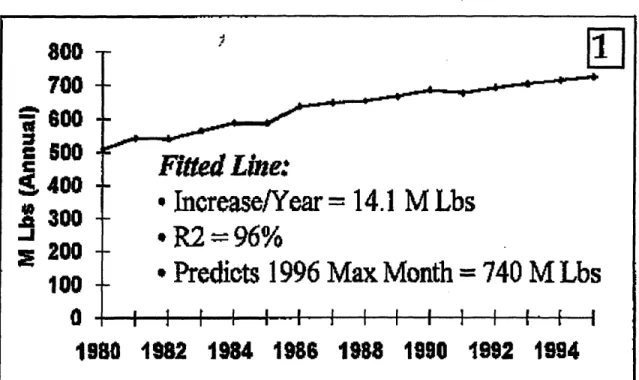
Simply calculating total variability over the last several years would not provide an accurate picture of current production variability. A significant amount of the total variability is due to the consistent increase in production rates through the years (Figure 2.2 displayed this increase). The OM's first step in removing this interference was to determine the maximum monthly production rate for each year since 1980 (Figure 4.2). This gave an idea of what to expect for the best month in 1996.
Figure 4.2 Maximum Monthly Production by Year
800
700
* 5600-
'0
Fitted Line:
4
400
a*
IncreaseNYear
=
14.1
M Lbs
.e300
-'
*R2
=
96%
g
200
--*
Predicts 1996 Max Month = 740 M Lbs
100
--1980
1982
1984 198
1988
1990 1992
1994
The next step was to examine the variability in the difference between the annualized rate for the best month of each year and the actual year end production total (Figure 4.3). The result was a probability distribution for this difference.
Figure 4.3 Determination of Variability
7
6
4
-LL
2
0
-1
--
0
20
Max
Monthly
Rate
40
60
80
100
(Annualized) - Year-end
Total
Notice that two curves are shown in Figure 4.3, one for "all data" and one labeled "reduced variability." The "all data" curve overestimates variability, as one factor contributing to this total variability is plant utilization. For the'first two thirds of this time period, demand did not force Hopewell to consistently operate at capacity.
Therefore, in some years, production rates were far below maximum monthly production simply because there was insufficient and inconsistent demand through the year, not because there was truly high capacity variability. The "reduced variability" curve weeds out some of these outlying data points, based on what variability would be expected to be with the plant consistently running at full capacity. The anticipated impact of recently completed Operational Excellence projects and the new process control (distributed control) systems were also used to shape the "reduced variability" distribution.
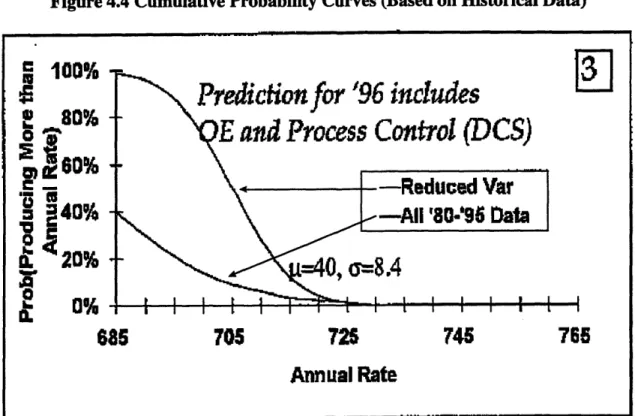
Following from the quantification of measures for capacity and variability, Figure 4.4 presents cumulative probability curves for production. These curves show the probability of exceeding various yearly production levels for both the "reduced variability" and "all data" cases. If Hopewell were to be budgeted for 710 million pounds in 1996, this graph
estimates (using the "reduced variability" curve) that there would only be a 25% chance of meeting or exceeding the budgeted production. If Polymers wanted to minimize risk by ensuring that Hopewell would have about a 90% chance of reaching budgeted production, this analysis would suggest a target of 690 to 695 million pounds caprolactam.
Figure 4.4 Cumulative Probability Curves (Based on Historical Data)
S100o%
jjj
SPrediction
for '96 includes
S80%
E and Process Control (DCS)
og
60%
Be -
-Reduced
Var
S~
40% r--All
'80-'96 Data
08
685
705
725
745
765
Annual
Rate
4.2.3 Past efforts in model development
The estimation of capacity through historical data contributed much to the understanding of Hopewell capacity. Yet, it was still based on data from the past fifteen years. Between the Hydrox 800 team and other Operational Excellence efforts, capacity and variability had likely changed significantly during the past few years. In early 1996, Hopewell personnel developed two models to try to understand the impact of these changes.
Using Excel spreadsheets, the operations manager and one of the process engineers supporting Area 9 (the plant bottleneck) each developed models using current (at that time) reliability and capacity information to estimate Area 9 capacity. Figure 4.5 is a simplified diagram of Area 9.
Figure 4.5 Area 9 Simplified Process Diagram
Ammonia Ammonium Hydroxylamine Carbonate Nitrite Reaction Disulfonate Reaction Trains Trains Reaction Trains
A A A
B - B - Hydrox
formation
C - C C
storage storage storage
D - D D
E 1 7E - E
Hydrox storage Water, ammonia, NOx SO2
C02
The OM's model considered five reaction trains for Area 9, grouping the carbonate, nitrite, and disulfonate trains together into entities A through E. A probability was assigned to each of these reaction train groups operating on a given day. With an assumed maximum capacity of 740 million pounds per year equivalent lactam
(accounting for hydrox consumption by Performance Chemicals), random numbers were generated to determine the number of trains on-line for each day of the year. The total calculated capacity was 701 million pounds per year with a standard deviation of 11, agreeing reasonably well with the historically derived probability distribution.
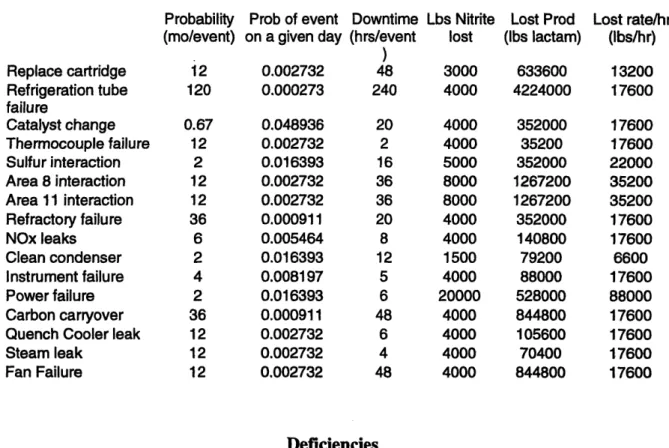
The process engineer's model incorporated more specific reliability information (see Table 4.1). This model used random number generation to simulate the occurrence of
of available equivalent lactam post-Performance Chemicals demand). The result was a probability distribution centered at 705 million pounds per year. This too agreed reasonably well with the distribution derived from the historical data.
Table 4.1 Area 9 Nitrite Reliability Events
Replace cartridge Refrigeration tube failure Catalyst change Thermocouple failure Sulfur interaction Area 8 interaction Area 11 interaction Refractory failure NOx leaks Clean condenser Instrument failure Power failure Carbon carryover Quench Cooler leak Steam leak Fan Failure Probability (mo/event) 12 120 0.67 12 2 12 12 36 6 2 4 2 36 12 12 12 Prob of event on a given day 0.002732 0.000273 0.048936 0.002732 0.016393 0.002732 0.002732 0.000911 0.005464 0.016393 0.008197 0.016393 0.000911 0.002732 0.002732 0.002732 Deficiencies
Whereas each of these models made great strides in the incorporation of actual reliability information and the creation of capacity distributions, they did not provide a complete picture of the capacity of the entire Hopewell caprolactam system. Since there is such a significant business impact from the additional output of just 5 to 10 million pounds, more accurate determinations of capacity and variability were desired. The capabilities of Excel and the amount of available information prevented these models from achieving the desired level of precision. Specifically, the following factors hindered the accuracy of these models:
The models did not consider the entire plant. Even though Area 9 is the primary bottleneck, other production areas may limit production several days
Downtime (hrs/event 48 240 20 2 16 36 36 20 8 12 5 6 48 6 4 48 Lbs Nitrite lost 3000 4000 4000 4000 5000 8000 8000 4000 4000 1500 4000 20000 4000 4000 4000 4000 Lost Prod (Ibs lactam) 633600 4224000 352000 35200 352000 1267200 1267200 352000 140800 79200 88000 528000 844800 105600 70400 844800 Lost rate/hr (lbs/hr) 13200 17600 17600 17600 22000 35200 35200 17600 17600 6600 17600 88000 17600 17600 17600 17600
each month. Thus, actual Hopewell capacity will be below area 9 capacity. These other sources of unreliability needed to be better understood.
* The models could not fully explore the capacity of the bottleneck area, Area 9. Model 1 lumps carbonate, nitrite, and disulfonate reaction trains together. Model 2 considers only nitrite production in detail.
* The buffering impact of inventory is not included. Storage tanks between various production steps help reduce variability and the ultimate impact of specific events.
* The impact of long term events is not fully explored. For example,
refrigeration tube failures cause a nitrite train to be down for 10 days. Model 1 does not carry such an event through to its duration. Model 2 reduces production by this total amount, but also makes it possible for another production hit to be taken on the same train during this time period
(essentially double counting downtime).
* The seasonal impact (relationship to ambient temperature) on capacity is not included.
* The data used in the development of these two models was quickly outdated. Numerous improvement projects were performed at Hopewell during 1995
and 1996 and the full impact of these improvements was not evident in early 1996.
In addition, the models do not allow for "what-if' type scenarios analyses to determine the relative merits of increasing capacity or reducing variability throughout the different production areas. None of the above deficiencies take away from what these models were meant to accomplish. However, the need had become evident for more complete
information, a more powerful modeling tool, and a more comprehensive model with the capability to evaluate multiple scenarios.
4.2.4 Initiation of a coordinated long-term strategy
In 1996, Hopewell also initiated an effort to develop a long term strategy for the plant. This plan would be driven by Polymers' business needs and accomplish the following:
* Identify sources of production variability and quantify risks.
* Identify alternative uses of capital.
* Set out a ten year plan for the plant.
To accomplish these objectives, lactam production capacity and variability must be known and alternative capital projects evaluated. This comprehensive strategy was also intended to include strategies for environmental issues (understanding and anticipating environmental regulations and determining conformance options and permitting needs),
other Hopewell products (especially Performance Chemicals and Nadone), and make vs. buy decisions.
5. Simulation Model
The simulation model (hereafter referred to as the Hopewell model) that is the topic of this thesis was created in late 1996 in order to assist in the effort to develop a long term
strategic plan for Hopewell.
5.1 Purpose
5.1.1 Accurate caprolactam capacity and variability determination
Although the previous attempts at determining plant capacity and variability, whether through historical data analysis or modeling using reliability information, produced similar results, in mid-1996 Hopewell management recognized a need for accuracy improvements. The historical model reflects past trends, and doesn't explicitly recognize the current state of the manufacturing facility. The Area 9 models do not consider the plant as a whole.
In order to best describe the probability distribution for caprolactam production, the Hopewell model includes all production units (including utilities) that could impact variability and total production. For each of these areas, research was done to determine and incorporate detailed and accurate capacity and variability information. The Hopewell model includes factors such as preventative maintenance, which prevents a production area from running at maximum capacity every day. For Areas 9 and 8/16, seasonal differences were also determined, so that the impact of ambient temperature on capacity would be reflected in the overall capacity determination. For all areas, the recent data
(from 1996 experience) on capacity and reliability was included.
5.1.2 Enable better business planning
An additional 10 million pounds of lactam in a year means millions of dollars in income to Polymers. The business needs to understand the risk in budgeting Hopewell for, say 710 million pounds rather than 700 million pounds. Also, contracts for yearly purchases to make up shortfalls must be negotiated and plans for spot purchases must be developed.
The probability distribution generated by the Hopewell model enables these business needs to be met. Because the model considers all the production areas, it also allows business planning for other Hopewell products (most importantly Performance
Chemicals, Nadone, and ammonium sulfate) to be improved. Furthermore, the model provides a tool for business planning throughout the future; it can be updated as
improvements are made or information is refined for the various production areas.
5.1.3 Optimize resource allocation
The Hopewell model provides the plant the capability to determine the ultimate impact that current or future improvement proposals would have on caprolactam (and co-product
and 'One-derived products) output. In the past, this has been extremely difficult. The plant's high level of complexity (due to the multiple interactions between production areas, the number of individual events that could impact overall production, and the buffering capacity of intermediate storage tanks) have made it impossible for anyone to accurately predict the eventual effect on lactam capacity and variability.
The model enables the comparison of various capital expenditures, for example,
reliability improvements in Area 9 disulfonate versus capacity improvements in Area 9 nitrite. Projects can also be bundled together across production areas to determine the net impact of several independent proposals on the production probability distribution. The most immediate use of the model in this capacity was to evaluate the cross-area proposal that was developed in late 1996 to increase average plant capacity by 30 million pounds per year.
There is also the potential to improve the allocation of non-capital resources.
Concentrating maintenance efforts on different production areas or pieces of equipment affects reliability. Estimates of these impacts can be entered in the model to determine how to best use these resources. Similarly, the allocation of process engineering resources among the production areas can conceivably be guided by input from the model.
5.2 Literature Review
There primary goals of the simulation model -quantification of uncertainty for risk evaluation in business planning, and the optimization of capital allocation through scenario evaluation -are well supported by literature.
Effective business planning requires identification of risk and understanding of variability. Boehm cites the use of systems analysis to clarify uncertainties so that decision-makers can minimize risk [1]. Norden states that modeling empowers an executive by providing estimates of the probabilities of the states of nature. A clearer understanding of the situation allows better decisions [5].
Optimal capital is enabled by the ability to compare scenarios. Walls states that the critical issue associated with strategy is the allocation of scarce capital. His multi-attribute utility theory compares scenarios to create the optimal portfolio of projects[7]. Koselka describes how simulation models allow for what-if analyses. They can be designed to cope with interactions and randomness, qualities lacking in equation-based models [4].
5.3 Description
The past attempts at modeling demonstrated that Excel does not offer sufficient capabilities by itself. Despite the limited scope of the Area 9 model (in terms of information and number of process areas included), it required significant computing power and memory. A more powerful tool which could use detailed probability distributions for the various production areas and generate an overall distribution for caprolactam was required. Crystal Ball, which works in conjunction with Excel, provides these capabilities for the Hopewell model.
The Hopewell model is a Monte Carlo simulation. It runs several times (say 500 or 1000 iterations, as chosen by the modeler), calculating an overall lactam production probability distribution. The data for all production area distributions is in Excel spreadsheets. The location of this data is defined for Crystal Ball, which generates probability curves for
these distributions. On each individual iteration, Crystal Ball randomly picks points off the input distributions, according to the assigned probabilities. Excel then executes all
the calculations necessary to determine total caprolactam production for the iteration. This information is fed back to Crystal Ball, which generates the overall production
distribution for the entire run. A more specific step-wise description of the model is included in Chapter 5.5 The spreadsheets for the entire model are not included in this report in order to protect proprietary AlliedSignal information.
In order to accurately represent the complexity of the plant, the model executes thousands of calculations during each iteration. An individual iteration simulates the occurrences and interactions which occur over a sixty day time period, with the production total converted to an annualized amount; attempts to simulate a 365 day period required too much computing power. Even with the sixty day simulation, computing power demands are high and the generation of a single output distribution (consisting of data from 250 to
1000 individual iterations) takes up to an hour on a typical PC (100 Mhz Pentium processor).
To determine the final yearly distribution, individual simulations are run for summer and non-summer scenarios to account for the ambient temperature effects. The output for these simulations serves as the input for another, much simpler Crystal Ball model which generates the final distribution.
The data for the production area probability distributions can be easily modified. Thus, the Hopewell model can be used to evaluate hypothetical scenarios.
5.4 Scope
All production areas which under the current state could conceivably have a
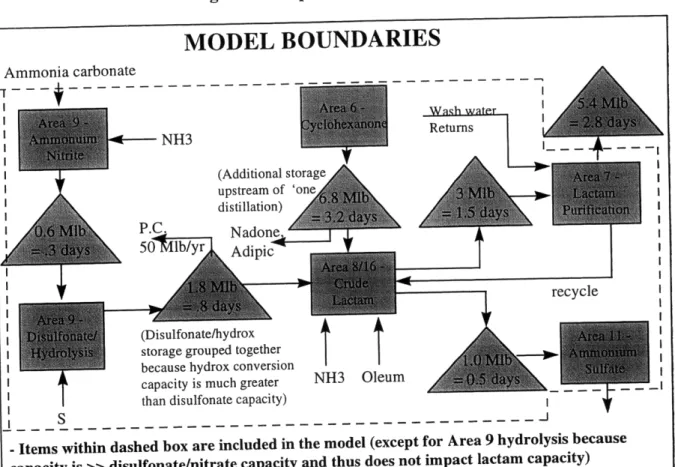
non-negligible impact on caprolactam production are included in the Hopewell model. Figure 5.1 depicts the scope of the model.
Figure 5.1 Hopewell Model Scope
MODEL BOUNDARIES
Ammonia carbonate -T---f---NH3 P.C. 50 ilblyr Wash water Returns as---sLI (Additional storage upstream of 'one distillation) Nadone k Adipic recycle (Disulfonate/hydrox storage grouped together because hydrox conversion capacity is much greaterthan disulfonate capacity)
I
NH3 Oleum
S I
- -- - - - - - - - - - - - - - - - - - - - - - - - - - - - - -
--Items within dashed box are included in the model (except for Area 9 hydrolysis because capacity is >> disulfonate/nitrate capacity and thus does not impact lactam capacity)
-Storage capacities are useable tank capacity (considering min and max), in lactam equivalents
Specific input distributions are included for the following: * Area 9 ammonium nitrite capacity
* Area 9 hydroxylamine disulfonate capacity
* Area 6 Cyclohexanone capacity * Area 8/16 crude lactam capacity
* Area 7 caprolactam purification capacity
* Area 11 ammonium sulfate capacity
* Combined utility (water/power/etc.), NH3 (Ammonia), Sulfuric Acid Plant
(known as SAP, produces oleum) reliability
I
:1
As shown in Figure 5.1, storage tanks for ammonium nitrite, hydroxylamine
disulfonate/hydrox, cyclohexanone, crude lactam, and crude ammonium sulfate are also included. In addition, the hydrox demand from Performance Chemicals and
cyclohexanone demand for 'One-derived product sales are represented in the model. The following items are not included in the model:
* ammonium carbonate capacity -this is currently well above demand, so this process never limits lactam production.
* hydroxylamine to hydrox conversion capacity -capacity is currently sufficient to never limit disulfonate production
* finished lactam storage -based on experience, it is assumed that caprolactam production will not be limited by the ability to transport finished lactam from these tanks to the polymer plants.
5.5 Data
The capacity distributions in the model reflect the most accurate information available in late 1996. The distributions were determined through discussions with, and investigation by, the process engineers supporting each area. These distributions represent the capacity of each production assuming no external constraints. The simulation determines when
interactions between production areas (external constraints) occur.
The approaches to creating these distributions were somewhat different for the different production units -the determining factor was what level of information was already
available and what type of useful, accurate data could be uncovered with a reasonable amount of work. For most areas, maximum capacity and events that prevent this capacity from being reached on any given day were determined. The probability distributions therefore correspond to the sources of unreliability (these potential events are assigned probabilities, durations, and impacts). If, through the random generation of events given their probabilities, one of these events occurs on a given day, its impact is subtracted from
the maximum capacity to determine the theoretical capacity for that day. In Area 9 (nitrite and disulfonate), each of the five reaction trains is treated as an entity. Thus, in the simulation, the data in Exhibits 5.1 and 5.2 is translated into a reliability distribution for each reaction train.
For other units, such as Areas 7 and 11, this level of detailed data was unavailable. Therefore, historical production levels (adjusted for external factors that limited
production) were used to generate capacity probability distributions for these production areas. For each day of an iteration, a point is pulled off each of these distributions to determine the capacity of these areas.
Exhibits 5.1 through 5.7 present the data used to generate the input probability
distributions. The capacities are listed in lactam "units" per year, with a unit equaling a some number of millions of pounds, so as to protect AlliedSignal information. Again, each of the production area distributions excludes all capacity limitations that are external to that area, as an external event does not actually affect the area's manufacturing
capabilities. The area capacities are not compensated for Performance Chemicals and Nadone demand; the model makes these adjustments. Note that Area 6 events are described in terms of predicted impact on lactam production; the amount of
cyclohexanone normally stored in Area 6 minimizes the ultimate impact of specific events.
Exhibit 5.1 Area 9 Ammonium Nitrite Data Maximum capacity (daily average if all trains up for entire day)
* non-summer: 2.12 units/yr lactam * summer: 2 units/yr lactam
Train downtime causes, impacts (frequencies are for entire unit, not per train)
Catalyst change Condenser cleaning Instrument failure Train PM Environmental issues Fan failure Cartridge replacement Quench cooler leak Steam leak
Thermocouple failure Carbon carryover Refractory failure
Refrigeration tube failure
Events/yr 15 6 3 2.5 2 1 1 1 1 1 .33 .33 .1
Lost train hours/eveni 20 6 5 336 (2 weeks) 8 48 48 6 4 2 48 20 240 (10 days)
Exhibit 5.2 Area 9 Hydroxylamine Disulfonate Data Maximum capacity (daily average if all trains up for entire day)
*non-summer: 2.03 units/yr lactam *summer: 2.00 units/yr lactam
Train downtime causes, impacts (frequencies are for entire unit, not per train) Environmental issues
Thermocouple failure Acid pipe leak
Instrument failure Train PM
Fan problem
Plugged SACT demister Refrig. cond. cleaning Refractory failure Acid cooler leak Plugged candles Hot spot repair Tank failure
Refrigeration tube failure
Events/yr 48
12
Lost train hours/event
3 2.5 2 2 2 1 1 1 1 .25 4 336 (2 weeks) 18 18 6 120 24 18 4 72 240 (10 days)
Exhibit 5.3 Area 6 Data
Maximum capacities -Cyclohexanone available for lactam/Nadone production (feed to adipic acid already accounted for), in lactam equivalents for sections of Area 6:
Phenol purification: 2.30 units/yr Hydrogenation: 2.30 units/yr 'One distillation: 2.06 units/yr
Impact of equipment downtime -Since there is 2-2.5 Mlb (equivalent lactam) useable tank volume upstream of the Area 6 bottleneck ('One distillation), an event upstream of the bottleneck is assumed to impact potential available 'One for lactam only if the event's impact is greater than this storage. Events at or downstream of the bottleneck are assumed to directly impact potential available 'One for lactam/Nadone. Although Area 6 has historically not limited lactam production and many of the events cannot currently impact production, they are
included in the model because they could impact the scenarios which include improvements in lactam production capacity.
Downtime causes, impacts (in Mlb equivalent lactam per event) Impact on
'One available
Events/yr for lactam
Phenol supply shortage 2 2.8
Phenol pur. tower down 2 .9
Hydrogenation poisoning 1 .7
Annual hydrog. shutdown 1 2.2
'One dist. column down 3 1.2
'One dist. flooding, etc. 10 .2
Cryogenic down 18 No ultimate impact
Exhibit 5.4 Area 8/16 Data
Maximum capacity (hourly average if unit runs at 100% for an entire day). This represents capacity available for finished lactam; it accounts for the 0.22 units/yr lactam included in the recycle from Area 7 to area 16.
non-summer: 2.04 units/yr finished lactam summer: 1.88 units/yr finished lactam
Downtime causes
Events/yr Duration (hrs) % rate reduction
Various cooler cleanings 6 16 20%
CL-33 cleaning 6 8 15%
C-62 cleaning 4 8 15%
Pump failure (spare smaller) 2 4 10%
CL-62 pump failure 2 4 50%
Hydrox piping 2 8 50%
High lactam in dilute 2 12 10%
Instrument failure 1 8 60%
Feed quality 1 24 50%
Area-8 cooler 1 8 10%
Exhibit 5.5 Area 7 Data
A truncated capacity probability distribution was developed for Area 7 using one year of data (neglecting days when other units or insufficient feed limited
throughput).
mean: 1.86 units/yr standard deviation: .018
Exhibit 5.6 Area 11 Data
Exhibit 5.7 Utility/SAP/Ammonia Data
Utility Failures This category includes steam, electricity, water, etc. Failure frequency: 6/year
Hours of lactam production (in all units) lost each event: 6
SAP /Kellogg /Catastrophic Events
Catastrophic events such as the 1996 SAP outage can cause the loss of several days of lactam production. These events are very infrequent, but cause greater variability in yearly lactam production and lower long term average rates.
Frequency of event: 1 per 10 years
Days of lactam production lost per event: 5
The process engineers also provided data on storage tank capacities. Because a tank cannot be filled to its roof and all product in a tank is not available due to tank heels and minimum levels for pump suction, only useable tank capacity is included in the model. This is typically 80 to 85% of total tank volume.
5.6 How the model works
As mentioned in Chapter 5.2, depending on the type of data for a production area, Crystal Ball randomly generates a theoretical capacity or an event which limits production below maximum rates (which then leads to a theoretical production capacity) for each day of each iteration for each production area. Area 9 is a little more complex since each train is a separate entity. Thus, although each nitrite train has the same associated reliability distribution, on a given day, one train may be capable of operating at maximum capacity while another could experience a complete shutdown. The total Area 9 nitrite or
disulfonate capacity on a given day is the sum of the capacities of the five trains in that area.
To determine "actual" production on a given day, the interactions between all the production areas must be considered. Each production area on each day will not necessarily produce to its theoretical capacity; it is dependent on the upstream and downstream production areas. For example, if Area 8/16's capacity on a given day is randomly determined to be 740 million pounds annualized, but Area 9 disulfonate production is experiencing difficulty (operating at an annualized rate of 650 million pounds) and beginning disulfonate inventory is minimal, actual Area 8/16 production could be limited below its theoretical capacity. A similar situation would exist if a downstream production area were experiencing reliability problems and the storage tank between the two areas started the day with little available space. A great challenge in the development of the Hopewell model (second only to securing accurate capacity and reliability information for the production areas) was to create logic in the Excel spreadsheets to address these relationships. The following step-wise order of model calculations and functions (refer back to Figure 5.1 for a depiction of the relationships between production areas and the location of storage tanks) accounts for these
interactions:
1. All initial tank inventory levels are set at half of useable tank space. 2. For each area (and in Area 9, for each train), on each day, a theoretical
capacity is randomly determined by the model, based on the probability inputs. 47
The utility/SAP/ammonia input distribution is used to randomly determine if an event affecting the reliability of these processes occurs on any of the 60 days.
3. Daily theoretical capacity for all production areas is adjusted for
utility/SAP/ammonia incidents. Also, theoretical capacities are adjusted for previously occurring events of duration greater than one day. For example, if on day 1, a nitrite train suffers a 10 day outage, then even though it may have been randomly determined to be capable of operating at full capacity on day 2, the remaining impact of the day 1 event is carried through and the day 2 theoretical capacity is set at 0. This would continue for days 3 through 10.
4. Possible nitrite available for conversion to disulfonate is calculated each day based on nitrite capacity and the level in the nitrite tanks at the start of the day.
5. Possible hydrox available is the sum of beginning disulfonate/hydrox in
storage and the minimum of disulfonate capacity and possible nitrite available. Because disulfonate to hydrox conversion capacity is currently not an issue, it is not modeled.
6. Available hydrox for lactam production is calculated by subtracting Performance Chemicals hydrox demand from possible hydrox available. 7. Area 8/16 production is then calculated. It is the minimum of: available
hydrox for lactam production; available 'One ('One in storage plus 'One capacity less 'One consumption by Nadone); crude lactam production that can be sent to Area 7 (Area 7 capacity plus available room in crude lactam tanks); and ammonium sulfate solution production that can be sent to Area 11 (Area 11 capacity plus available room in ammonium sulfate solution tanks). In summary, this step compares theoretical Area 8/16 production rate, available raw materials from upstream production areas, and available downstream storage and production capacity to see what would limit Area 8/16 production.
8. Given Area 8/16 production, the relationships are worked in reverse, with Area 9 actual disulfonate production determined and then used to determine Area 9 actual nitrite production. Area 6, 7, and 11 actual production rates are similarly determined given actual Area 8/16 production and available space or inventory in tanks.
9. All the tank levels are adjusted based on the actual production rates and the simulation carries these levels to the next day where the process is done again.
10. The simulation is run for 60 days with total production converted into a yearly rate. This rate is then adjusted for production which resulted solely from the lowering of tank inventories during the simulation (this consumption of initial inventory is not sustainable over a year and thus does not represent real
production).
11. Steps 1 through 10 are repeated for iterations 2, 3, etc..
12. The output from all the iterations is used to determine the capacity distribution for the scenario simulated.
Notes: Area 8/16 production is defined to reflect what will end up in finished lactam (Area 7 recycle is accounted for). Area 7 capacity is in terms of virgin lactam capacity; it doesn't count flake lactam processing and lactam extracted from wash water returns.
The output for each of the summer and non-summer scenarios is converted into an acceptable input distribution for the model which determines the final yearly distribution. This takes some manipulation, as Crystal Ball output is not ideally suited for use as an input distribution. This final model is an additional Crystal Ball Monte Carlo simulation. Four months of each year are assumed to be described by the summer distribution, the
rest by the non-summer distribution. This model generates a final Hopewell caprolactam yearly production probability distribution.
6. Refinement of the model
6.1 Need for accuracy
The development of the Hopewell model was initially seen as a one week or less effort. The first generation required the area engineers to do minimal data development and refinement and did not include events such as SAP failures. The average capacity generated from the model was obviously off by about 50 million pounds per year.
It thus became apparent that the accurate determination of lactam capacity would mean a much more intensive effort. The model needed to have an error of no more than 1.5% (10 million pounds per year) to fully satisfy the business needs.
6.2 Iterative process to ensure accuracy
Several modifications to and generations of the model were needed to achieve the accuracy goals. The following means were used to assess and improve the model's validity:
* review of recent production data - 1995 and 1996 monthly and yearly production levels were reviewed versus the Hopewell model output. Exact conformance to the output distribution could not be expected, as the collection of monthly production rates is a group of random selections from a
distribution with high variability. However, if the model output suggested that the probability of production for a given month exceeding a given annualized rate to be less than 2% and this had already occurred twice in the last six months, the output distribution would not seem to reflect the actual state of the plant.
* comparison of the output distribution to the distribution generated from historical data -Whereas the Hopewell model was meant to improve on the historically derived probability distribution, differences of several percent could mean inadequacies in the Hopewell model.