HAL Id: hal-00318152
https://hal.archives-ouvertes.fr/hal-00318152
Submitted on 13 Sep 2006
HAL is a multi-disciplinary open access
archive for the deposit and dissemination of
sci-entific research documents, whether they are
pub-lished or not. The documents may come from
teaching and research institutions in France or
abroad, or from public or private research centers.
L’archive ouverte pluridisciplinaire HAL, est
destinée au dépôt et à la diffusion de documents
scientifiques de niveau recherche, publiés ou non,
émanant des établissements d’enseignement et de
recherche français ou étrangers, des laboratoires
publics ou privés.
Reconfiguration of polar-cap plasma in the magnetic
midnight sector
S. E. Pryse, A. G. Wood, H. R. Middleton, I. W. Mccrea, M. Lester
To cite this version:
S. E. Pryse, A. G. Wood, H. R. Middleton, I. W. Mccrea, M. Lester. Reconfiguration of polar-cap
plasma in the magnetic midnight sector. Annales Geophysicae, European Geosciences Union, 2006,
24 (8), pp.2201-2208. �hal-00318152�
Ann. Geophys., 24, 2201–2208, 2006 www.ann-geophys.net/24/2201/2006/ © European Geosciences Union 2006
Annales
Geophysicae
Reconfiguration of polar-cap plasma in the magnetic midnight
sector
S. E. Pryse1, A. G. Wood1, H. R. Middleton1, I. W. McCrea2, and M. Lester3
1Institute of Mathematical and Physical Sciences, University of Wales Aberystwyth, UK
2Space Physics Division, Space Science and Technology Department, CCLRC Rutherford Appleton Laboratory, UK 3Department of Physics, University of Leicester, UK
Received: 15 May 2006 – Accepted: 25 July 2006 – Published: 13 September 2006
Abstract. Radio tomography and the EISCAT and Super-DARN radars have been used to identify long-lived, high-altitude, cold plasma in the antisunward convective flow across the polar cap. The projection of the feature to later times suggests that it was reconfigured in the Harang discon-tinuity to form an enhancement that was elongated in longi-tude in the sunward return flow of the high-latilongi-tude convec-tion pattern. Comparison with a tomographic image at a later time supports the interpretation of a polar patch being recon-figured into a boundary blob. There is also evidence for a second plasma enhancement equatorward of the reconfigured blob, likely to have been produced by in situ precipitation. The observations indicate that the two mechanisms proposed in the literature for the production of boundary blobs are op-erating simultaneously to form two distinct density features separated slightly in latitude.
Keywords. Ionosphere (Ionosphere-magnetosphere interac-tions; Plasma convection; Polar ionosphere)
1 Introduction
The polar ionosphere is highly complex containing structures in electron density with a wide range of spatial scale sizes. Of relevance to the current study are density enhancements on horizontal scales of ∼100 s to 1000 s km in the F-region, known as polar patches. These patches were studied first us-ing ionospheric sounders and airglow emissions (Buchau et al., 1983; Weber et al., 1984), but they have since been in-vestigated by a variety of experimental techniques, including radio scintillation (Buchau et al., 1985), incoherent scatter radar (Pedersen et al., 1998), HF radar (Ogawa et al., 1998) and radio tomography (Walker et al., 1999). However, com-parisons of features observed by different techniques are not
Correspondence to: S. E. Pryse
always straight-forward, with different techniques using dif-ferent criteria to define a patch. A comprehensive review of the structures and associated phenomena has been given by Crowley (1996).
Polar patches are found when the interplanetary magnetic field (IMF) Bz component is negative (McEwen and
Har-ris, 1996). They drift anti-sunward in the cross-polar flow at speeds of typically between 300 and 1000 m s−1. The patches have been observed in both winter and summer at sunspot maximum and minimum (Buchau and Reinisch, 1991) and in geomagnetically conjugate regions (Rodger et al., 1994a). Complete understanding of the mechanisms re-sponsible for the increased density is still open, with both soft-particle precipitation (Weber et al., 1984) and photoioni-sation at sub-polar latitudes (Buchau et al., 1985) being cited. Experimental evidence is increasingly supportive of the lat-ter idea, suggesting that dayside photoionisation from lower latitudes is entrained into the polar convection pattern and is subsequently structured into discrete patches. Patch den-sity levels comparable to those at dayside sub-auroral lati-tudes were reported by Buchau et al. (1985), whilst the ob-servations of Pryse et al. (2004) indicated that the enhanced density could have originated in the postnoon sector, near the equatorward edge of the high-latitude convection pat-tern. The observations of Valladares et al. (1994) suggested that the plasma convected from sub-auroral latitudes into the polar cap in a tongue-of-ionisation (TOI), and supportive evidence for a latitudinally-extended feature near magnetic noon was presented by Sims et al. (2005). The break-up of the TOI into patches has been attributed to many processes, including temporal changes in the plasma convection pattern due to variations in the IMF By component (Sojka et al.,
1993), the expansion of the convection throat of the polar cap to lower latitudes (Anderson et al., 1988) and increased plasma loss in flow channel events (Rodger et al., 1994b), but the balance of the contributions of the different mecha-nisms remains an open question. Modelling studies of the
2202 S. E. Pryse et al.: Reconfiguration of polar-cap plasma in the magnetic midnight sector
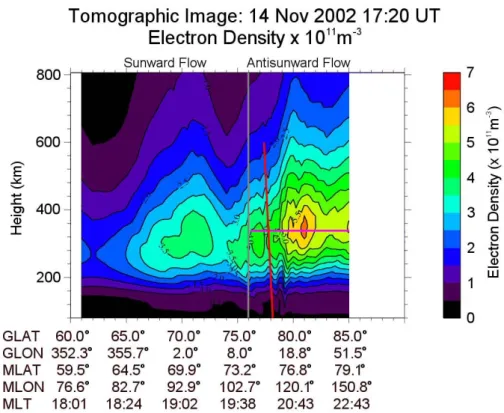
Fig. 1. Tomography image for a southbound satellite pass crossing the latitude of 75◦N at 17:20 UT on 14 November 2002. The pink horizontal line indicates the observed latitudinal extent of enhanced densities at an altitude of 350 km. The line extends from the equatorward edge of the enhancement in the antisunward flow, defined by the 4×10¹¹m−3electron density contour, to the poleward extreme of the field-of-view. The vertical grey line shows the location of the flow reversal boundary between sunward and antisunward flow identified by the SuperDARN electric potential map at 17:16 UT. The red line near 78◦N indicates the observing direction of the EISCAT Svalbard Radar 42-m dish.
polar ionosphere have shown that the TOI can be modulated by IMF By, the season and UT effects (Sojka et al., 1993;
1994) as it is drawn antisunward from the dayside across the polar cap. A subsequent study discussed the dependency of the UT modulation on the observing location, by consider-ing three locations in different longitude sectors (Bowline at al., 1996). This indicated that the feature was expected to be prominent at Ny- ˚Alesund in the European sector in the evening under conditions of Bynegative.
An earlier modelling investigation by Robinson et al. (1985) suggested that a polar density enhancement could be drawn out of the polar cap on the nightside through the Harang discontinuity. Further restructuring of the feature in the zonal convective flow might result in a longitudinally ex-tended, but latitudinally-confined boundary blob in the re-turn sunward convection flow of the auroral region. Exper-imental observations of the boundary blobs in the evening auroral ionosphere have been reported by Rino et al. (1983) and Jones et al. (1997). It was suggested that the feature in the former study was produced by localised precipitation, while the blob in the latter study was observed by the EIS-CAT radar to be produced in situ by ongoing soft-particle precipitation. The mechanism of formation of such blobs
thus remains open to debate. This current paper presents a case study in support of formation by re-configuration of a polar patch, as suggested by the earlier modelling study. However, a second field-aligned enhancement was also ob-served in the region of return, sunward flow that was consis-tent with production by soft-particle precipitation. The un-derstanding of the occurrence and formation of the boundary blobs is of relevance to the mitigation of propagation effects on radio systems, where steep density gradients at the pole-ward edge of the mid-latitude trough can present particular problems (Pryse et al., 2006).
2 Experimental facilities
2.1 Radio tomography
The radio tomography experiment operated by the Univer-sity of Wales Aberystwyth comprises a chain of receivers at four locations in northern Scandinavia, separated in latitude but aligned essentially in longitude: Ny- ˚Alesund (78.9◦N, 12.0◦E; 76.0◦MLAT, 112.3◦MLON), Longyearbyen (78.2◦N, 15.7◦E; 75.1◦MLAT, 113.0◦MLON), Bjørnøya
S. E. Pryse et al.: Reconfiguration of polar-cap plasma in the magnetic midnight sector 2203
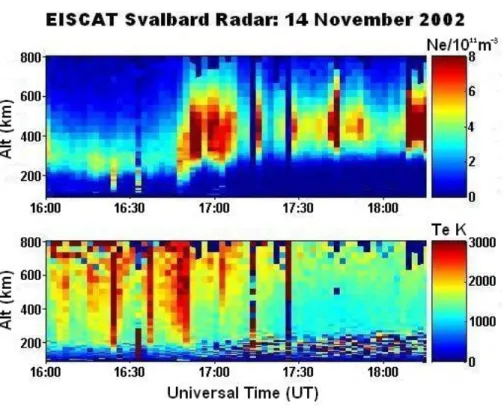
Fig. 2. Electron densities (top panel) and temperatures (bottom panel) measured by the EISCAT Svalbard Radar 42-m dish observing along
the geomagnetic field.
(74.5◦N ,19.0◦E; 71.3◦MLAT, 108.8◦MLON) and Tromsø (69.8◦N, 19.0◦E; 66.1◦MLAT, 103.4◦MLON). Phase co-herent signals from the polar orbiting satellites of the Navy Ionospheric Monitoring System (NIMS) are received at each site to measure total electron content along the satellite-to-receiver ray paths. The collective observations during a satellite pass from a large number of intersecting ray-paths are inverted in a tomographic algorithm to yield the spatial distribution of electron density in a height-versus-latitude plane through the ionosphere (Pryse, 2003 and references therein).
2.2 EISCAT Svalbard radar
The international European Incoherent Scatter radar (EIS-CAT) facility comprises instrumentation on mainland north-ern Scandinavia and at Longyearbyen on Svalbard. Of par-ticular interest to the current work are measurements of iono-spheric electron density and temperature made by the static 42-m dish of the EISCAT Svalbard radar (ESR) (78.2◦N, 16.1◦E 75.0◦MLAT, 113.1◦MLON,) which observes along the local geomagnetic field line in the F-region.
2.3 Super dual auroral radar network
The Super Dual Auroral Radar Network, SuperDARN, (Greenwald et al., 1995) consists of nine coherent scatter radars at high latitudes in the Northern Hemisphere and seven
in the Southern Hemisphere. These radars measure the line-of-sight velocity of the F-region convection flows. The ob-servations can be inverted using the spherical harmonic fit-ting technique described by Ruohoniemi and Baker (1998) to produce global maps of the ionospheric convection pat-tern and the high-latitude electric potential, which are used in the present study.
3 Experimental observations
3.1 Radio tomography image 17:20 UT, 14 November 2002
The tomographic image for a southward satellite pass that crossed the geographic latitude of 75◦N at 17:20 UT on 14 November 2002 is shown in Fig. 1. The image reveals an ionosphere structured in latitude with a density enhance-ment in the northern field-of-view. The enhanceenhance-ment extends from about 74◦MLAT to beyond the poleward extremity of
the field-of-view and has a density maximum of greater than 6×10¹¹m−3near 77.5◦MLAT. Its latitudinal extent is high-lighted by the horizontal pink line at an altitude near 350 km, which extends poleward from the 4×10¹¹m−3 contour on the equator-most side of the feature. A second, smaller en-hancement is also to be seen at a similar altitude, centred near 70◦MLAT with density levels reaching some 3.5×10¹¹m−3. The vertical grey line down the image indicates the location
2204 S. E. Pryse et al.: Reconfiguration of polar-cap plasma in the magnetic midnight sector
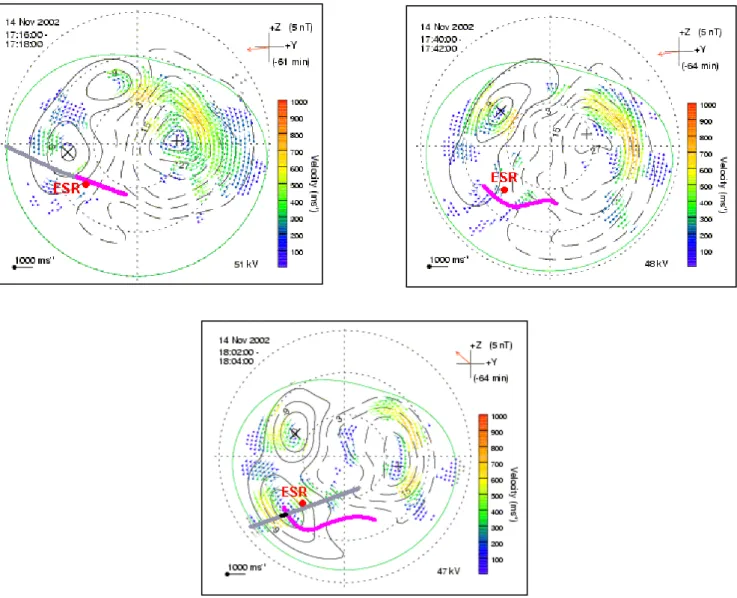
Fig. 3. SuperDARN electric potential maps for 17:16 UT (first panel), 17:40 UT (second panel) and 18:02 UT (third panel) on a magnetic
latitude versus MLT polar plot. The latitudinal extent of the polar patch as observed at 17:20 UT is mapped onto the first plot and is shown by the pink portion of the satellite trajectory mapped to 350 km. The anticipated locations of the enhancement following projection through the electric potential patterns are shown by the pink curves in the subsequent panels. The electron density enhancement observed in the tomography image at 18:02 UT lies in the return flow and is indicated in the bottom panel by the short dark blue line on the trajectory for this pass.
of the flow-reversal boundary between the cross-polar anti-sunward flow and the return flow of the dusk convection cell, identified from the SuperDARN measurements (Sect. 3.3). 3.2 EISCAT Svalbard Radar 16:00 UT–18:15 UT,
14 November 2002
The electron densities and temperatures measured by the 42-m dish of the ESR radar between 16:00 UT and 18:15 UT are shown in the two panels of Fig. 2. The fixed observing direction of the dish (Azimuth: –179.0◦, Elevation: 81.6◦)is aligned along the magnetic field. Two clear regimes are
ap-parent in the panels. In the earlier part of the data record be-fore about 16:45 UT, the F-region layer peak is below 300 km and the sporadically increased electron temperatures are in-dicative of ongoing soft-particle precipitation. At later times the maximum height of the F-region peak is closer to 400 km and electron temperatures are consistently low. It can also be noted that significant temporal structure can be seen, with changes in peak density by at least a factor of two taking place on a time scale of minutes. At about 17:20 UT the radar beam was close to the plane of the tomography image. Its pointing direction is indicated by the red line near 78◦N in Fig. 1. The density at the peak was measured between 3 and
S. E. Pryse et al.: Reconfiguration of polar-cap plasma in the magnetic midnight sector 2205
4×10¹¹m−3, in broad agreement with the tomographic
ob-servation at the same location. The high altitude of the layer peak and the low electron temperatures at this time indicate that the density enhancement in the tomography image com-prised long-lived cold plasma, created well before the obser-vation and convected into the field of view. It can be noted that the altitude of the layer peak, marginally above 400 km, is higher than in the tomographic image. However, it must be recalled that, in addition to small differences in the co-location of the measurements, the radio tomographic tech-nique is limited in its ability to reconstruct precisely the verti-cal distribution of the electron density (Pryse, 2003), though this restricted ability to determine the exact height of the peak does not detract from the validity of the present study. 3.3 SuperDARN electric potential maps 17:16 UT–
18:04 UT, 14 November 2002
Measurements in the solar wind upstream of the Earth dicated that the IMF was exerting a reasonably constant in-fluence on the polar ionosphere at the time of interest. Ob-servations by the ACE spacecraft, with appropriate adjust-ment of just over 1 h for the delay between measureadjust-ment and the ionospheric flow-response, showed that the clock angle was dominated by an IMF By component with values
be-tween –7 nT and –4 nT, whilst the Bzcomponent fluctuated
between +4 nT and –4 nT. The electric potential maps from the SuperDARN radars, examined at 2-min intervals, were correspondingly reasonably stable with each showing a dawn cell that was larger and more rounded than the dusk cell, in keeping with the negative By component. The pattern for
the interval starting at 17:16 UT is shown in the first panel of Fig. 3, in terms of magnetic latitude and MLT with local noon at the top. The time corresponds to the time of observation of the main enhancement in Fig. 1, just before the 75◦N cross-ing of the NIMS satellite at 17:20 UT. Also shown in the pan-els of Fig. 3 are the horizontal velocity vectors derived from the ionospheric backscatter measured by the radars, which have been used to shape the electric potential patterns. In the ionospheric F-region, the E×B drift transports plasma along the equipotential contours, so that at the time of interest there was a general antisunward flow across the polar cap, slightly displaced towards dusk, consistent with the patterns of Cow-ley et al. (1991). The trajectory of the 17:20 UT tomography satellite pass mapped to 350 km is shown in the first panel by the grey and pink line that extends from about 60◦MLAT to 80◦MLAT in the evening sector. The pink northern-most part of the trajectory corresponds to the latitudinal extent of the polar density enhancement marked in Fig. 1. It can be seen that the enhancement lies exactly in the antisunward plasma flow between the two cells. Also shown on the panel is the intersection of the ESR radar at the corresponding time. Plots similar to those of Fig. 3 were used to project the de-velopment of the plasma feature indicated on the first panel forward in time, by estimating the strength and direction of
the electric field from the potential gradients. The field was initially determined at regular intervals of 1◦geographic
lat-itude along the line through the feature in the first panel, then each of these points was projected forward in location with the velocity of the E×B drift through a time interval of 2 min. The process was repeated on the same points using potential patterns at 2-min separation until 18:02 UT. The centre panel of Fig. 3 shows an intermediate projection of the polar patch for the 2-min interval starting at 17:40 UT, with the third panel showing the final projected location at 18:02 UT. It can be seen that in the latter plot the equator-ward edge of the patch lies in the sunequator-ward return flow of the dusk cell, while the poleward extreme extends towards the return flow of the dawn cell, with the overall feature now be-ing drawn out in longitude along the auroral region.
3.4 Radio tomographic image 18:02 UT, 14 November 2002
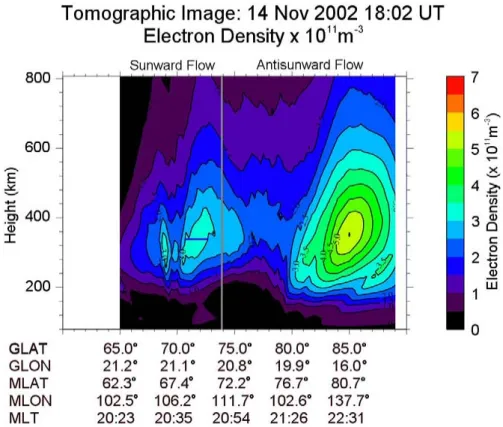
The radio tomographic image for a later southward satellite pass at 18:02 UT is shown in Fig. 4. Of particular interest is the density enhancement between 68◦MLAT and 70◦MLAT,
as defined by the 3×10¹¹m−3contour. Its latitudinal cross-section is indicated by the horizontal dark blue line. The tra-jectory of the satellite pass mapped to an altitude of 350 km is shown by the grey line in the third panel of the electric potential patterns of Fig. 3. The short dark blue segment on the trajectory corresponds to the latitudinal cross-section through the density enhancement identified in the tomogra-phy image, and is seen to lie in the sunward return flow of the dusk cell almost coincident with the projection of the polar patch.
4 Discussion
Experimental observations have been presented of a large-scale density enhancement on the nightside of the antisun-ward plasma flow across the polar cap ionosphere. The high altitude and cold electron temperatures suggest that the plasma had been produced upstream at an earlier time. In the absence of a local solar EUV or impact ionisation source, the plasma decays at the lower altitudes where recombina-tion rates are higher. A horizontal cross-secrecombina-tion through the enhancement was projected forward in time using the Super-DARN electric potential maps. A later tomographic image showed good agreement of a density enhancement with the projected location of the convecting plasma. The results sug-gest that the plasma at the lower latitudes of the polar patch had been carried through the Harang discontinuity and elon-gated in the return sunward flow of the dusk cell to form a boundary blob in the auroral evening sector. By contrast, the projection indicates that the ionisation seen at the highest lat-itudes in the tomographic image of Fig. 1 was swept around the dawn cell, though regrettably experimental evidence in
2206 S. E. Pryse et al.: Reconfiguration of polar-cap plasma in the magnetic midnight sector
Fig. 4. Tomography image from a southbound satellite pass crossing the latitude of 75◦N at 18:02 UT on 14 November 2002. The dark blue horizontal line indicates the latitudinal extent of the density enhancement of interest in sunward return flow as defined by the 3×10¹¹m−3 electron density contour. The vertical grey line shows the location of the flow reversal boundary between sunward and antisunward flow at 18:02 UT.
the form of another tomographic image is not available for confirmation in this case.
The expected decay of the electron densities can be esti-mated along the projected path. Calculations, using the re-combination coefficients quoted by Brekke (1997) show that a density of 4×10¹¹m−3at 350 km in cold plasma might be
expected to decrease to 3.4×10¹¹m−3, in the absence of any
production mechanism, during the time interval of 46 min be-tween the two tomography images. The difference bebe-tween the chosen level of 4×10¹¹m−3 in the image for the ear-lier time and that of 3×10¹¹m−3in the second plot is thus broadly consistent with this decay, given the uncertainties in the recombination rates and the accuracy of the density esti-mates from the image.
The variability seen in the temporal observations made by ESR suggests that the density enhancement in the tomo-graphic image was probably a polar-cap patch rather than a steady tongue of ionisation (TOI). The cold nature of the plasma seen at high-altitude indicates that it was likely to have originated earlier, upstream on the dayside, and was carried into the region of observation in a TOI that had been modulated into patches. A less-likely alternative interpreta-tion might be of a uniform TOI moving spatially in-and-out
of the radar field-of-view, although knowledge of the spa-tial and temporal structure of the convective flow on such fine scales is well beyond the capabilities of the measurement techniques available.
Rino et al. (1983) were the first to present the idea of a boundary blob in the evening auroral ionosphere. Us-ing observations by the Chatanika radar they suggested that the structure may have been produced by precipitation of low-energy electrons from the inner edge of the central plasma sheet. EISCAT radar measurements reported by Jones et al. (1997) showed that the feature, tracked over many hours, was a field-aligned structure associated with bursts of latitudinally-localised increases in the electron temperature in the F-region, a clear indication of production in situ by soft-particle precipitation. Tomographic reconstructions of the mid-latitude ionosphere confirmed that such an enhance-ment formed the poleward edge of the mid-latitude trough (Kersley et al., 1997). A more recent investigation, aimed at characterising the morphology of the trough for the vali-dation of ionospheric models, showed that a boundary blob could be identified at the poleward wall for some 23 of the 600 troughs studied (Pryse et al., 2006). However, the pro-duction mechanism behind the formation of the blob still
S. E. Pryse et al.: Reconfiguration of polar-cap plasma in the magnetic midnight sector 2207
remains open to debate and the observations presented here provide experimental evidence for plasma reconfiguration, as opposed to impact ionisation from soft particle precipitation, thus supporting the original modelling work of Robinson et al. (1985).
In view of the conflicting evidence in the literature sup-porting two distinct physical mechanisms for the production of boundary blobs, it is interesting to see the presence of a narrow field-aligned enhancement at 66.5◦MLAT in the to-mographic image at 18:02 UT (Fig. 4). The location of this feature is equatorward of the enhanced densities that have mapped from the earlier image and interpreted as a recon-figured patch. This narrow structure has an electron density at the layer peak similar to that of the reconfigured patch, but the altitude of the peak is lower. The field alignment and lower altitude are both in keeping with production by localised soft precipitation. While impact ionisation cannot be established conclusively, it can be noted that simultane-ous measurements to the south, by the EISCAT UHF radar on mainland Norway, showed evidence of localised precipi-tation near 18:00 UT. Hence, it seems likely that in situ soft-particle precipitation and plasma reconfiguration were both operating in the sunward return plasma flow of the evening auroral region to create a complex structure of boundary blobs that were separated in latitude. It must thus be con-cluded that both physical mechanisms play roles in the for-mation of boundary blobs. While it may be possible to at-tribute a single source to some of the simpler structures, in line with the evidence found in the literature, in practice, for many situations the plasma seen in the density enhancements may have had more complex origins.
It is of interest to note that there is a suggestion, in the projection of the polar patch, of higher density plasma being convected around the equatorward edge of the dawn cell. It is well established that the main ionisation trough is to be found in the post-midnight sector as well as at pre-midnight times. In the evening, it forms in the vicinity of the stagnation re-gion between the sunward return flow and the co-rotation at lower latitudes. However, after the Harang discontinuity, the return flow at the auroral edge of the dawn cell is no longer opposed to the co-rotation. While information is now avail-able on the statistical character and morphology of the post-midnight trough (Pryse et al., 2006), little investigation has been done on the mechanisms operating in this sector. While troughs of “fossil” ionisation from the evening may be car-ried round in the co-rotating flow towards dawn, the present results suggest the reconfiguration of trans-polar plasma may have a role to play in the location and details of the poleward wall of troughs to be found after midnight. Further study is clearly needed with appropriately located observations. It is known that the TOI undergoes modulation both in UT, due to the offset of the geographic and geomagnetic poles, and because of the polarity and strength of the IMF By
compo-nent, hence leading to effects that are more pronounced in some sectors and under certain geomagnetic conditions. An
early investigation, trying to compare electron densities in different longitudinal sectors using limited incoherent scatter radar data, was presented by de la Beaujardi`ere et al. (1985). However the establishment of radio tomography chains by the International Ionospheric Tomography Community now opens up the possibility of routine comparisons of density structures in different geographic regions.
5 Conclusions
Radio tomography, EISCAT and SuperDARN observations have been used to identify a long-lived enhanced density fea-ture in the cross-polar antisunward plasma flow. The pro-jection of its location using the electric potential maps, from its initial observed location to a final position some 46 min later, indicates that it may have been reconfigured in the mid-night sector to form a plasma enhancement extended lon-gitudinally in the sunward return flow. Comparison of the projection with a later tomographic image at the end of the projection time interval revealed a density enhancement co-located with the projected density structure. The observa-tions provide experimental evidence for the mechanism pro-posed by the modelling work of Robinson et al. (1985) for the reconfiguration of polar plasma into a longitudinally-extended feature near the equatorward boundary of the auro-ral oval. There is also evidence for a second plasma enhance-ment equatorward of the reconfigured blob, likely to have been produced by in situ precipitation. Taken collectively the observations indicate that the two mechanisms proposed previously in the literature for the production of boundary blobs are operating simultaneously to form two distinct fea-tures separated slightly in latitude.
Acknowledgements. Financial support for the project was provided
by the UK Particle Physics and Astronomy Research Council un-der grants PPA/G/O/2003/00017 and PPA/G/O/2003/00013. The assistance of the University of Tromsø and the Norwegian Polar Research Institute in the tomographic measurements is gratefully acknowledged. The SuperDARN radar facility is funded by the Na-tional Research Programs of Australia, Canada, Finland, France, Japan, South Africa, Sweden, UK and USA. EISCAT is an interna-tional facility supported by the nainterna-tional science councils of Finland, France, Germany, Japan, Norway, Sweden and the United King-dom. The IMF data was provided by N. Ness and obtained from the CDAWeb. A. G. Wood acknowledges receipt of a PPARC postgrad-uate studentship.
Topical Editor M. Pinnock thanks L. Zhu and another referee for their help in evaluating this paper.
References
Anderson, D. N., Buchau, J., and Heelis, R. A.: Origin of density enhancements in the winter polar cap ionosphere, Radio Sci., 23, 513–519, 1988.
2208 S. E. Pryse et al.: Reconfiguration of polar-cap plasma in the magnetic midnight sector
Bowline, M. D., Sojka, J. J., and Schunk, R. W.: Relationship of theoretical patch climatology to polar cap patch observations, Radio Sci., 31, 635–644, 1996.
Brekke, A.: Physics of the upper polar atmosphere, John Wiley and Sons, 1997.
Buchau, J. and Reinisch, B. W.: Electron density structures in the polar F-region, Adv. Space Res., 11, 29–32, 1991.
Buchau, J., Weber, E. J., Anderson, D. N., Carlson Jr., H. C., Moore, J. G., Reinisch, B. W., and Livingston, R. C.: Ionospheric struc-tures in the polar cap: their origin and relation to 250-MHz scin-tillation, Radio Sci., 20, 325–338, 1985.
Buchau, J., Reinisch, B. W., Weber, E. J., and Moore, J. G.: Struc-ture and dynamics of the winter polar cap F-region, Radio Sci., 18, 995–1010, 1983.
Cowley, S. W. H., Morelli, J. P., and Lockwood, M.: Dependence of convective flows and particle precipitation in the high-latitude dayside ionosphere on the X and Y components of the interplan-etary magnetic field, J. Geophys. Res., 96, 5557–5564, 1991. Crowley, G.: Critical review of ionospheric patches and blobs,
URSI Review of Radio Science 1993–1996, edited by: Stone, W. R., 619–648, 1996.
de la Beaujardi`ere, O., Wickwar, V. B., Caudal, G., Holt, J. M., Craven, J. D., Frank, L. A., Brace, L. H., Evans, D. S., Win-ningham, J. D., and Heelis, R. A.: Universal time dependence of nighttime F region densities at high latitudes, J. Geophys. Res., 90, 4319–4332, 1985.
Greenwald, R. A., Baker, K. B., Dudeney, J. R., Pinnock, M., Jones, T. B., Thomas, E. C., Villain, J.-P., Cerisier, J.-C., Senior, C., Hanuise, C., Hunsucker, R. D., Sofko, G., Koehler, J., Nielsen, E., Pellinen, R., Walker, A. D. M., Sato, N., and Yamagishi, H.: Darn/Superdarn: A global view of the dynamics of high-latitude convection, Space Sci. Rev., 71, 761–796, 1995.
Jones, D. G., Walker, I. K., and Kersley, L.: Structure of the pole-ward wall of the trough and the inclination of the geomagnetic field above the EISCAT radar, Ann. Geophys., 15, 740–746, 1997,
http://www.ann-geophys.net/15/740/1997/.
Kersley, L., Pryse, S. E., Walker, I. K., Heaton, J. A. T., Mitchell, C. N., Williams, M. J., and Willson, C. A.: Imaging of elec-tron density troughs by tomographic techniques, Radio Sci., 32, 1607–1621, 1997.
McEwen, D. J. and Harris, D. P.: Occurrence patterns of F layer patches over the north magnetic pole, Radio Sci., 31, 619–628, 1996.
Ogawa, T., Nishida, N., Pinnock, M., Sato, N., Yamagishi, H., and Yukimato, A. S.: Antarctic HF radar observations of irregular-ities associated with polar patches and auroral blobs: A case study, J. Geophys. Res., 103, 26 547–26 558, 1998.
Pedersen, T. R., Fejer, B. G., Doe, R. A., and Weber, E. J.: Inco-herent scatter radar observations of horizontal F-region plasma structure over Sondrestrom, Greenland, during polar cap patch events, Radio Sci., 33, 1847–1866, 1998.
Pryse, S. E.: Radio tomography: A new experimental technique, Surveys in Geophysics, 24, 1–38, 2003.
Pryse, S. E., Sims, R. W., Moen, J., Kersley, L., Lorentzen, D., and Denig, W. F.: Evidence for solar-production as a source of polar-cap plasma, Ann. Geophys., 22, 1093–1102, 2004,
http://www.ann-geophys.net/22/1093/2004/.
Pryse, S. E., Kersley, L., Malan, D., and Bishop, G. J.: Parame-terisation of the main ionospheric trough in the European sector, Radio Sci., 41, RS5S14, doi:10.1029/2005RS003364, 2006. Rino, C. L., Livingston, R. C., Tsunoda, R. T., Robinson, R. M.,
Vickrey, J. F., Senior, C., Cousins, M. D., Owen, J., Klobuchar, J. A.: Recent studies of the structure and morphology of auroral-zone F-region irregularities, Radio Sci., 18, 1167–1180, 1983. Robinson, R. M., Tsunoda, R. T.,Vickrey, J. F., and Guerin, L.:
Sources of F-region ionisation enhancements in the nighttime au-roral zone, J. Geophys. Res., 90, 7533–7546, 1985.
Rodger, A. S., Pinnock, M., Dudeney, J. R., Watermann, J., de la Beaujardiere, O., and Baker, K. B.: Simultaneous two hemi-sphere observations of the presence of polar patches in the night-side ionosphere, Ann. Geophys., 12, 642–648, 1994a.
Rodger, A. S., Pinnock, M., Dudeney, J. R., Baker, K. B., and Greenwald, R. A.: A new mechanism for polar patch formation, J. Geophys. Res., 99, 6425–6436, 1994b.
Ruohoniemi, J. M. and Baker, K. B.: Large-scale imaging of high-latitude convection with Super Dual Auroral radar Network HF radar observations, J. Geophys. Res., 103, 20 797–20 811, 1998. Sims, R. W., Pryse, S. E., and Denig, W. F.: Spatial structure of summertime ionospheric plasma near magnetic noon, Ann. Geo-phys., 23, 25–37, 2005,
http://www.ann-geophys.net/23/25/2005/.
Sojka, J. J., Bowline, M. D., Schunk, R. W.: Patches in the polar ionosphere: UT and seasonal dependence, J. Geophys. Res., 99, 14 959–14 970, 1994.
Sojka, J. J., Bowline, M. D., Schunk, R. W., Decker, D. T., Val-ladares, C. E., Sheehan, R., Anderson, D. N., and Heelis, R. A.: Modelling polar-cap F-region patches using time-varying con-vection, Geophys. Res. Lett., 20, 1783–1786, 1993.
Valladares, C. E., Basu, S., Buchau, J., and Friis-Christensen, E.: Experimental evidence for the formation and entry of patches into the polar cap, Radio Sci., 29, 167–194, 1994.
Walker, I. K., Moen, J., Kersley, L., and Lorentzen, D.: On the possible role of cusp/cleft precipitation in the formation of polar-cap patches, Ann. Geophys., 17, 1298–1305, 1999,
http://www.ann-geophys.net/17/1298/1999/.
Weber, E. J., Buchau, J., Moore, J. G., Sharber, J. R., Livingston, R. C., Winningham, J. D., and Reinisch, B. W.: F-layer ionization patches in the polar cap, J. Geophys. Res., 89, 1683–1694, 1984.